


Although the literature describes a favorable course of low back pain (LBP) in adults, little information is available for older adults. LBP is prevalent and complex in older adults, and the analysis of its trajectories may contribute to the improvement of therapeutic approaches.
ObjectiveTo describe pain and disability trajectories in older adults with a new episode of LBP.
MethodsOlder adults (n = 542), aged >55 years with a new episode of nonspecific LBP, were followed for 12 months in a prospective cohort. Pain intensity (Numeric Rating Scale) and disability (Roland-Morris Disability Questionnaire) were assessed at baseline and 3, 6, 9, and 12 months. Latent class growth analysis (LCGA) was used to model pain and disability scores over time. Baseline biopsychosocial characteristics were compared using one-way analysis of variance or Chi-square test (α=0.05).
ResultsThe LCGA identified three and four trajectories in the pain and disability courses, respectively. Trajectories with low, intermediate, or high scores over time were defined. Worse biopsychosocial status at baseline was associated with worst prognosis over 12 months. Low educational level, physical inactivity, poor mobility, recent falls, worse fall self-efficacy, presence of depressive symptoms, more kinesiophobia, greater number of comorbidities, and the presence of other LBP-associated complaints were found in older adults with severe and persistent symptoms.
ConclusionThe trajectories allow the identification of clusters with similar clinical prognoses in older adults with a new episode of LPB. In practice, excessive treatments and unnecessary tests can be avoided, while more accurate and targeted interventions can be implemented.
Low back pain (LBP) is the leading cause of disability globally, affecting individuals of all ages.1,2 Previous studies indicate a favorable course of LBP, with symptom recovery mostly observed within 6–12 weeks.3,4 However, large variability in outcome recovery is observed. A systematic review of prospective studies, including adults with acute LBP, showed high variability in reduction of pain (12%–84%) and disability (33%–83%), at 1-month follow-up.5 Although lower variability was observed among older adults, pain (26%–32%) and disability (3%–20%) recovery levels at 3 months were also variable.6,7
In general, prospective studies consider the mean scores of the outcomes in the total group over time,5 assuming that LBP follows a single linear trajectory on an average. This can obscure biopsychosocial characteristics8 of subgroups and contribute to more variability and impression of the pain and disability outcomes.6,7 This approach may not truly represent the clinical course of subgroups with specific and more homogeneous biopsychosocial characteristics. In the case of LBP, a greater detail of the prognosis with the use of trajectories to identify the underlying characteristics of clusters of patients with similar prognoses,9 may allow more targeted and accurate therapeutic approaches. For example, excessive treatments and unnecessary examinations can be avoided in patients with a profile conforming with significant symptom recovery. Similarly, investigating the course of LBP in older adults through trajectories can minimize heterogeneity and distortions when clinical outcomes are analyzed in a single group.
Investigating recovery trajectories in older populations with LBP is clinically relevant considering the high prevalence of LBP and associated costs in older adults.10 Two studies described the course of LBP in older adults using trajectories and observed different courses for pain and disability, with three11 and six12 trajectories for pain and five12 trajectories for disability. However, a comprehensive understanding of how patients follow a defined set of trajectories remains poorly understood. Further studies of trajectories in older adults should be conducted, including populations from different countries and locations. In support of this, a review that included studies on trajectories in LBP concluded that research is lacking in all age groups and recommended conducting trajectory studies in specific groups such as older adults and children.13 In addition, levels of pain and disability related to LBP may differ between older populations according to the different biopsychosocial profiles.14 Thus, the present study provides previously unavailable novel data on LBP trajectories for older adult Brazilians and contributes to the consolidation of knowledge concerning LBP trajectories in older adults.
We hypothesized that there are subgroups of older adults with acute LBP with different trajectories for pain and disability outcomes and that the biopsychosocial characteristics are different between the subgroups. Thus, this study aimed to identify and describe pain and disability trajectories in a cohort of older adults with a new episode of LBP and to compare the biopsychosocial characteristics among the subgroups with different trajectories.
MethodsData from the Back Complaints in the Elders (BACE)-Brazil from 2011 to 2014 were used. BACE-Brazil is a prospective cohort that aims to describe the clinical course and prognosis of LBP in older adults and is part of the international consortium of epidemiological studies between researchers from Brazil, Australia, the Netherlands, and Norway.15
The study included community older adults, aged 55 years and older, affected by a new episode of acute LBP, referred to public and private health service professionals. LBP was defined as pain, tension, or stiffness located in the region between the last ribs and gluteal line, with or without pain irradiation to the lower limbs.16 A new episode of LBP was defined as one in which the individual had not sought care in health services owing to LBP in the 6 months before the current complaint.15 Acute symptoms were defined as pain of fewer than 6 weeks.17
Participants with any visual, motor, hearing, or cognitive impairment that may have hindered the testing procedures were excluded. All participants signed an informed consent form, and the Universidade Federal de Minas Gerais research ethics committee approved the study (ETIC 0100.0.203.00-11). Participants were reassessed by telephone interview at 3, 6, 9, and 12 months.
OutcomesThe intensity of LBP in the last week was assessed using an 11-point numeric rating scale (NRS), with scores ranging from 0 (no pain) to 10 (extreme pain).18 LBP-related disability was assessed using the Roland-Morris Disability Questionnaire (RMDQ), which has satisfactory reliability and validity for the Brazilian population.19 The scores range from 0 to 24, with higher values indicating greater disability, and the cut-off point for severe disability is defined as a score higher than 14.20
Biopsychosocial characteristicsThe biopsychosocial characteristics of the participants were defined according to the proposed biopsychosocial approach to LBP,8 based on clinical21 and theoretical criteria,22 as measured using instruments and procedures described previously in the BACE consortium's guidelines.15
Biological: Complaints of pain irradiation to lower limbs (yes/no); report of pain during active trunk movements: anterior flexion, lateral flexion, and trunk rotation (yes/no); trouble sleeping owing to LBP evaluated using the Pittsburgh Sleep Quality Index (yes/no)23; low back morning stiffness (yes/no); the presence of at least one sign or symptoms considered red flags (yes/no)17; positive Lasègue test (yes/no); history of LBP (yes/no); reported use of medications for LBP (yes/no); functional mobility, as measured by the Timed up and Go24; recent report of falls in the last 6 weeks (yes/no); the number of comorbidities, evaluated by self-administered comorbidity questionnaire25; body mass index (BMI); physical health, evaluated by the physical realm of the Short Form Health Status Questionnaire-36 (SF-36)26; other pain sites evaluated using McGill Pain Questionnaire.27
Psychological: Mental health, evaluated using the mental realm of the SF-3626; kinesiophobia, evaluated by the physical activity subscale of the Fear-Avoidance Beliefs Questionnaire, which measures the fear, beliefs, and avoidance behaviors of people with LBP28; depressive symptoms, evaluated using the Depression Scale Center for Epidemiological Studies29; falls self-efficacy, evaluated through the Falls Efficacy Scale-International questionnaire, which registers the elderly's concern with falls during the performance of 16 activities.30
Social: Age in years, sex (male/female), marital status (married/common-law marriage, single/divorced, widower); schooling level (low, medium, and high); and physical activity level, using the International Physical Activity Questionnaire and categorized into three activity levels: inactive, moderately active, and active.31
Statistical analysisPain and disability trajectories were shaped using latent class growth analysis (LCGA). The levels of pain and disability were categorized and equally spaced in the LCGA for the five assessments made throughout the study. The pain scores were categorized as “no pain” (NRS≤1), “mild-moderate pain” (NRS=2–4), and “severe pain” (NRS≥5).9,32 Similarly, disability scores were grouped into three categories: “no disability” (RMDQ<4), “mild-moderate disability” (RMDQ=4–14), and “severe disability” (RMDQ>14).20,33,34
The LCGA linear model was used, unconditionally and without the inclusion of covariables. LCGA uses the maximum likelihood to assign individuals to a cluster; however, it does not contain a definitive method for determining the optimal number of clusters.35 It uses the model fit log-likelihood (LL). The larger the value of LL, the worse the model fit. The bootstrap p-value was calculated, with non-significant values indicating poorness of fit for the model of the number of clusters tested.36 The LCGA models for pain and disability were adjusted interactively. The models started with one cluster, with additional clusters added until the model attained the ideal number of clusters.35,36
Additionally, information criterion statistics that consider the parsimony of the model: Akaike's information criterion (AIC), Bayes’ information criterion (BIC), and entropy were used. The optimal number of clusters corresponds with the AIC and BIC values at their minimum36 and the entropy values at its maximum.37 The analysis of two times the log likelihood difference is also considered. The optimal number of clusters occurs when the difference changes markedly from one model to another.36 Other criteria used were a minimum cluster size of 5%, high average posterior probability of belonging to each cluster, and a distinctive pain and disability course for each trajectory.36,37
Participants with missing data were allocated to the clusters without the need for imputation through maximum likelihood. LCGA, the statistical model, was assumed to be randomly missing, indicating that the missing data may depend on observed variables; however, not on unobserved variables.38 However, for a better fit of the LCGA model, those with “missing data” in more than two of the five assessments were excluded from the analyses.9
We used one-way analysis of variance (ANOVA) (continuous variables) or the chi-square test (categorical variables) to determine whether baseline biopsychosocial health characteristics were different among the trajectory subgroups. The Bonferroni post-hoc test or the adjusted residual value was used to define significant differences in trajectory comparisons by one-way ANOVA and the chi-square test, respectively.
The software Mplus (version 7.2) and SPSS for Windows (version 22.0) were used to perform the analyses, with a significance level of 5%.
ResultsSample characteristicsThe sample comprised 602 community older adults, with 60 participants (9.7%) excluded from the analysis due to “missing data” in more than two follow-up periods. Therefore, the present study included 542 older adults, the majority being women (86%), married (44%), with low schooling levels (62%), of whom 512 (94%), 500 (92%), 470 (87%), and 446 (84%) completed all questionnaires at 3, 6, 9, and 12 months, respectively. The study flowchart is shown in Fig. 1, and the descriptive characteristics of the participants are presented in Table 1.

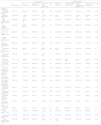
Baseline biopsychosocial characteristics of all participants with acute LBP and comparison of the baseline biopsychosocial characteristics of participants between different trajectories of pain and disability, BACE-Brazil, n = 542.
BACE, Back Complaints in the Elders; NRS, Numeric Rating Scale; RMDQ, Roland-Morris Disability Questionnaire; TUG, Timed Up and Go; SF-36, Short Form Health Status Questionnaire-36; McGill, McGill Pain Questionnaire; FABQ-Phys, Fear Avoidance Beliefs Questionnaire – subscale physical activities; CESD, Depression Scale Center for Epidemiological Studies; FESI, Falls Efficacy Scale-International; IPAQ, International Physical Activity Questionnaire; CI, confidence interval. Data are indicated as mean or proportion (%) with a 95% CI. Data indicated as mean are compared (P-value) using one-way analysis of variance (ANOVA) and data indicated as proportions are compared using the Chi-square test.
Significant differences between trajectories in the Bonferroni post-hoc test or adjusted residual analysis: a, pain recovery vs. incomplete pain recovery; b, pain recovery vs. persistent severe pain; c, incomplete pain recovery vs. persistent severe pain; d, disability recovery vs. incomplete disability recovery; e, disability recovery vs. persistent moderate-severe disability; f, disability recovery vs. persistent severe disability; g, incomplete disability recovery vs. persistent moderate-severe disability; h, incomplete disability recovery vs. persistent severe disability; i, persistent moderate-severe disability vs. persistent severe disability.
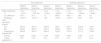
The optimal number of clusters was defined based on the model fit criteria of the LCGA for each outcome. LCGA models with two to five clusters for pain and disability were tested using goodness-of-fit indices to determine the best model, as shown in Table 2. The rate of change in LL diminished markedly after the three-and four cluster models for pain and disability, respectively. The bootstrap likelihood ratio test indicated that four pain clusters and five disability-cluster models were not significant. The fit statistics AIC and BIC decreased until the three-pain-cluster and four-disability-cluster model solutions; however, not for four and five clusters, respectively. Entropy was adequate for all models, practically 0.7, in all solutions, without marked changes between models. Additionally, the four pain-cluster and five disability-cluster models had a rate of less than 5% in the smallest cluster. Given these results, we defined the three- and four-cluster models as the best solutions for pain and disability trajectories in our sample, respectively.
Adjustment parameters in the LCGA models for setting optimal number of clusters “goodness of fit criteria”, in the pain and disability trajectories, BACE-Brazil, n = 542.
| Pain trajectories | Disability trajectories | ||||||
|---|---|---|---|---|---|---|---|
| Model 2 trajectories | Model 3 trajectories | Model 4 trajectories | Model 2 trajectories | Model 3 trajectories | Model 4 trajectories | Model 5 trajectories | |
| Model comparison | 1 vs 2 | 2 vs 3 | 3 vs 4 | 1 vs 2 | 2 vs 3 | 3 vs 4 | 4 vs 5 |
| LL | −1871.2 | −1755.738 | −1736.9 | −2420.5 | −1977.6 | −1854.8 | −1839.9 |
| 2LL difference | 231.0 | 37.6 | 7.3 | 885.8 | 245.5 | 29.8 | 8.2 |
| Boststrap p-value | <0.001⁎⁎ | <0.001⁎⁎ | 0.06 | <0.001⁎⁎ | <0.001⁎⁎ | 0.02* | 0.07 |
| Information criterion | |||||||
| AIC | 3523.5 | 3491.9 | 3493.6 | 3967.1 | 3727.7 | 3703.8 | 3705.7 |
| BIC | 3549.2 | 3530.5 | 3542.1 | 3992.9 | 3766.3 | 3755.4 | 3764.1 |
| Sample-Size Adjusted BIC | 3530.2 | 3501.9 | 3504.0 | 3973.9 | 3737.8 | 3717.3 | 3726.5 |
| Entropy | 0.624 | 0.692 | 0.758 | 0.849 | 0.853 | 0.758 | 0.716 |
| Cluster partipants (%) | 0.62 | 0.06 | 0.03 | 0.45 | 0.15 | 0.13 | 0.04 |
LCGA, latent class growth analysis; BACE, Back Complaints in the Elders; LL, log-likelihood value; 2LL difference, 2 times the likelihood difference, change in LL as each additional cluster is added; bootstrap p-value, bootstrap likelihood ratio test (p> 0.05 suggests no further improvement in model fit by adding another cluster); AIC, Akaike's information criterion; BIC, Bayesian information criterion (information criterion value better at is at its lowest); entropy, the ability of the model to provide well-separated clusters (range: 0–1 with higher values superior); cluster participants (%), percentage of members in the smallest cluster (suggested higher than 5%).
The course of pain and disability, plotted by the mean NRS and RMDQ scores in each trajectory throughout the follow-up period are shown in Fig. 2. In general, the mean pain and disability scores decreased in all the trajectories in the first 3 months. The scores continued to decrease gradually in the trajectories with the recovery of symptoms; however, not in those with intense and persistent symptoms until 12 months.

Pain and disability trajectories. Description of pain and disability outcomes for each time point over 12 months stratified by latent class growth analysis subgroups. Mean scores and standard error in each time point of the different paths for pain and disability was plotted along the segment. NRS, Numeric Rating Scale; RMDQ, Roland Morris Disability Questionnaire; BAS, baseline; 3 M, three months; 6 M, six months; 9 M, nine months; 12 M, twelve months; BACE-Brazil, n = 542.
The three pain trajectories were defined as: (1) Pain recovery, this trajectory had the lowest proportion of older adults and was characterized by rapid pain recovery in the first 3 months and an increase in upper “no pain score” of 85% between 3 and 12 months. (2) Incomplete pain recovery, this was characterized by a slow and incomplete pain recovery, marked by a gradual decrease in “severe pain score,” and an increase in “no pain score” over time. (3) Persistent severe pain, this was the most prevalent pain trajectory, characterized by persistent severe symptoms, with a “severe pain score” for 94% or more of the participants in all follow-ups.
The four disability trajectories were defined as: (1) Disability recovery, this trajectory demonstrated gradual and significant recovery from disability, the “no disability score” increased gradually from 57% of participants in that group at 3 months to 96% at 12 months. (2) Incomplete disability recovery was the most common subgroup for disability outcome, and was characterized by the most marked reduction in disability in the first 3 months, followed by a slow and gradual decline until 12 months; however, without reaching full recovery levels, the number of participants in this group with “mild-moderate disability scores” was 75% or more in all follow-ups. (3) Persistent moderate-severe disability was characterized by a modest reduction in disability at 3 months and stable levels until 12 months, with the scores “mild-moderate disability”(39%) and “severe disability” (59%) being predominant over time. (4) Persistent severe disability was characterized by high and stable disability, with ratings of “severe disability score” for 93% or more of those in that group at baseline and follow-ups.
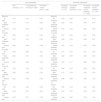
The probabilities of pain and disability scores for each trajectory in the final model are shown in Table 3.
Probability of pain and disability scores in different trajectories, BACE-Brazil, n = 542.
BACE, Back Complaints in the Elders.
Data show the probabilities of occurrence of the categorized scores of pain and disability in the trajectories at baseline, 3, 6, 9, and 12 months.
Considering the pain and disability data of the total sample, a statistically significant reduction in pain (baseline: 7.2 [95% confidence interval [CI]: 7.0, 7.4]; 3 months: 5.8 [95% CI: 5.5, 6.1]; 6 months: 5.8 [95% CI: 5.5, 6.1]; 9 months: 5.4 [95% CI: 5.0, 5.7]; 12 months: 5.2 [95% CI: 4.9, 5.6]) and disability scores (baseline: 13.7 [95% CI: 13.2, 14.2]; 3 months: 12.1 [95% CI: 11.5, 12.6]; 6 months: 12.2 [95% CI: 11.6, 12.8]; 9 months: 11.9 [95% CI: 11.2, 12.2]; 12 months: 11.5 [95% CI: 10.8,12.2]) was observed in the first 3 months; however, no further statistical reduction was recorded from 3 to 12 months.
Biopsychosocial characteristics of health in trajectoriesParticipants with persistent severe pain and persistent severe disability trajectories had worse biopsychosocial health conditions at baseline. Accordingly, women with lower educational level; sedentary lifestyle; depressive symptoms; a higher number of comorbidities; worse functional mobility; other clinical signs and symptoms associated with complaints (a minimum of one of these: pain irradiation, red flags, positive Lasègue, previous LBP, pain when moving); history of falls; worse self-efficacy in falls; and a higher level of kinesiophobia, had worse progression of LBP over the 12-month longitudinal follow-up (Table 1, Supplementary material).
DiscussionThis study used longitudinal data from the BACE-Brazil cohort, consisting of older adults with a new acute nonspecific LBP episode. The LCGA identified three and four different trajectories in the course of pain and disability, respectively. We identified subgroups of older adults with complete recovery of symptoms and subgroups of older adults with severe and persistent symptoms throughout the follow-up period.
LBP trajectories have already been reported in different studies and populations,9,11-13,32,39 with high variability in the number and size of the subgroups. Our results corroborate this variability; however, a detailed comparison of our results is more adequate with the trajectories of the two studies with older adults.11,12
Our results are consistent with those of Deyo et al.,12 who found six pain trajectories and five disability trajectories in a sample of older adults who visited the general practitioner due to LBP. Similarity concerning pain and disability course patterns were observed; both studies showed trajectories with marked reductions in pain and disability and trajectories with severe and persistent symptoms. However, differences in the number and size of the trajectories were observed, which can be elucidated by the duration of LBP between the samples. Deyo et al.12 analyzed older adults with variable duration of symptoms, including acute and chronic pain, while our study included only older adults with acute LBP. As previously described, there are important differences in the prognosis and progression of acute and chronic LBP.40 However, in both our study and that by Deyo et al., almost half of the samples were classified with intense and persistent symptoms. Therefore, the persistence of symptoms in our sample, frequent in chronic LBP, may raise questions as to our enrolment criteria for acute LBP, especially because we used self-reported information as the basis. However, both the levels of pain and disability at onset were higher in our study, compatible with acute LBP.3
Researchers from the BACE-Netherlands found three pain trajectories in older adults with acute LBP in primary care.11 The number of trajectories and course pattern was similar to the trajectories of BACE-Brazil. Both studies identified trajectories with a significant reduction in scores in the first 3 months, followed by a pattern of gradual reduction up to 12 months. In other trajectories, the symptoms remained severe and persistent throughout the follow-up period. However, the proportion of older adults in the trajectory with low pain levels was higher in BACE-Netherlands (n = 254, 38%).11 Differences in socioeconomic and demographic characteristics between countries are determinants for variations in the manifestation of pain and disability in older adults with LBP.14 Thus, the differences found between the percentage of older adults in trajectories can be elucidated by the biopsychosocial characteristics of the study populations. BACE-Netherlands did not describe disability trajectories, and it was not possible to compare this outcome.
Based on the sample as a single group, our results revealed a modest reduction in the mean pain (27%) and disability (16%) scores at 12 months of follow-up. Similar results were observed by Rundel et al.,6 who followed a longitudinal cohort of older adults with complaints of back pain and found modest reductions in pain (26%) and disability (12%) in the total sample after 12 months of follow-up. Guidelines regarding the minimal important change in general LBP, suggest that clinically relevant pain and disability reductions are 30% or more.41 Both this study and that by Rundell et al. demonstrated reduction percentages of less than 30%, that is, without meaningful clinical improvement. It is assumed that many older adults showed improvements in pain and disability greater than 30%; however, this was not visible in the general average of the sample. In our study, the LCGA analysis stratified subgroups and identified older adults with clinically significant reductions in pain and disability in more than half of the samples.
Older adults with severe and persistent pain and disability symptom trajectories had worse biopsychosocial health conditions at baseline, with worse parameters in practically all the variables investigated. Previous studies have also identified worse biopsychosocial factors predicting less favorable trajectories.11,39 Investigating trajectories in older adults with LBP, Enthoven et al.11 found an association between women, higher BMI, chronic pain, more significant disability, worse physical status in SF-36, and negative expectation of recovery, with moderate and severe pain trajectories. Another study analyzing non-elderly adults demonstrated that worse socioeconomic level; higher pain; and negative perceptions (lower emotional response, passive behavior, perception of non-recovery) were associated with a worse prognosis of LBP in 5 years.39 This is consistent with our results about biopsychosocial characteristics; however, we emphasize that our data are not predictive.
LCGAs use in the description of the LBP course in older adults, with the definition of subgroups with a more homogeneous prognosis, can be useful in health care in older adults with LBP, aligning with other tools used to stratify baseline characteristics in adults with LBP.42 In practice, this suggests that older adults with biopsychosocial clinical profiles compatible with trajectories of intense and persistent symptoms, can benefit from more intensive health care3 and improve self-management of persistent LBP.43 In contrast, we assume that older adults with biopsychosocial profiles similar to those of trajectories with mild symptoms can avoid excessive and unnecessary health care.
Study strengths and limitationsA strength of this study was the use of a cohort consisting of older adults with a new episode of acute LBP, as suggested in the recommendations for prognosis studies.44 The excellent adherence rate of older adults in the follow-ups, with at least 83% of the sample reporting complete data for the outcomes analyzed at all times of the study was noteworthy. Another strength of our study is that it was one of the few that used trajectories to investigate the nonspecific acute LBP course in a specific elderly population,11,12 and the first with Brazilian older adults.
As a limitation, we highlight the external validity as the majority of the sample comprised women. We highlight possible selection bias due to non-random recruitment and the use of self-reported criteria for enrolment in acute LBP. We excluded approximately 10% of the sample due to missing data. However, there were no differences in the outcomes between the excluded and analyzed samples. The use of univariate associations to compare the characteristics of the clusters limited discussions. The potential for misclassification by categorizing the outcomes in the LCGA models and not using other types of modeling (cubic, quadratic) can have influenced the statistical methodology.
ConclusionsDifferent trajectories were identified for the course of pain and disability in older adults with acute nonspecific LBP, and a worse biopsychosocial health profile in those who did not present clinical recovery. These findings contribute to a better understanding of the LBP course in older adults and can be used in clinical practice to enable differentiated health care in subgroups with specific clinical profiles.
This work was supported by CNPq, CAPES and FAPEMIG.


