The STarT Back Screening Tool (SBST) is used to stratify care. It is unclear if the SBST approach works as well for patients in low- and medium-income countries as for patients from high-income countries.
Objectives(1) To investigate whether patients with chronic low back pain (LBP) stratified by the SBST are different at baseline; (2) to describe the clinical course for each SBST subgroup; (3) to investigate the SBST utility to predict clinical outcomes; and (4) to determine which SBST subgroup show greater clinical improvement.
DesignThis is a secondary analysis of data derived from a previously published clinical trial.
Methods148 patients with chronic nonspecific LBP were included. Pain intensity, disability, global perceived effect, and the SBST were assessed at baseline and at 5, 12, and 24 weeks after baseline. Descriptive data were provided and ANOVA, unadjusted and adjusted regression models, and linear mixed models were used for data analysis.
ResultsDuration of symptoms, use of medication, pain, disability, and global perceived effect were different between SBST subgroups. Clinical improvements over a 6-month period were consistently greater in patients classified as high risk. The SBST was able to predict disability but this predictability decreased when the analysis was adjusted for possible confounders.
ConclusionClinical outcomes were different between SBST subgroups over 6 months. Adjusting for confounders influenced the predictability of SBST. Patients classified as high risk presented higher improvements in terms of disability.
The STarT Back Screening Tool (SBST) is a 9-item questionnaire developed to stratify care and to assist primary health care physicians in guiding the initial treatment for patients with acute, subacute, and chronic low back pain (LBP).1 The SBST classifies patients in three different subgroups (low, medium, or high risk) of having an unfavorable prognosis with regards to long-term disability.1,2 The intended purpose of stratification is for patients to receive different levels of care according to their SBST subgroup.2 Although the SBST was specifically designed to be a stratification tool for treatment in primary care,1,3–5 many studies have also tested the SBST as a predictive tool for disability.1,6–13 However, reported results have been inconsistent depending on the studied patient population and clinical setting.12,13
Some studies have investigated the predictive ability and risk stratification of the SBST in physical therapy settings,6,8–10,14,15 with the majority of the evidence coming from high-income countries. It is unclear if similar results would be achieved in medium or low-income countries.16 Implementation of the SBST in physical therapy departments from low and mid income countries, where resources may be scarce, has potential to improve access to treatment for patients who need it most.
We identified a single study testing the SBST in a physical therapy department from a medium-income country.8 This study aimed to monitor patients to determine what would be the best time to use the SBST.8 It was determined that re-assessment after 6-weeks, after adjusting the analysis for possible confounders, was better at predicting long-term disability then results at baseline evaluation. Prior to full implementation of the SBST approach in low- and medium-income countries, it is necessary to further explore the predictive ability of this tool. Additionally, whether clinical characteristics of patients differ between SBST subgroups needs to be determined, as there are no data on the clinical characteristics of each subgroup measured over six months in medium-income countries.
Therefore, the objectives of this study are: (1) to investigate whether patients with chronic LBP have different baseline characteristics among SBST subgroups; (2) to describe the course of clinical outcomes of patients in each SBST subgroup over a 6 month period; (3) to investigate the utility of the SBST to predict pain intensity, disability, and global perceived effect at 5 weeks and 3 and 6 months post-baseline in patients with chronic non-specific LBP who received physical therapy treatment; and (4) to determine which SBST subgroup has higher improvements in pain intensity, disability, and global perceived effect at 5 weeks and at 3 and 6 months post baseline assessment.
MethodsDesignThis is a prospective longitudinal cohort study that was conducted in the Physical Therapy Department of Hospital Santa Isabel – Irmandade Santa Casa de Misericórdia de São Paulo, Brazil. This cohort used the dataset of an entire sample from a previously published randomized controlled trial.17,18 Data were analysed as a cohort study because the results of the clinical trial indicated no difference between groups.17,18 The original trial was approved by the Ethics Committee of Universidade Cidade de São Paulo, São Paulo, SP, Brazil (number: 14386513.4.0000.0064) and was prospectively registered at ClinicalTrials.gov (trial registration number: NCT01866332 (https://clinicaltrials.gov/ct2/show/NCT01866332)).
ParticipantsConsecutive patients seeking care for chronic nonspecific LBP (i.e., duration greater than 3 months) from both sexes and 18–60 years of age were considered eligible to participate in this study. Participants were excluded if they were pregnant, had contraindications to physical exercise according to the guidelines of the American College of Sports Medicine,19 had a serious spinal pathology, had nerve root compromise, or had cardiovascular diseases.
All participants included in the study were referred to the physical therapy department from their medical doctors who conducted a physical examination to identify the patient's diagnosis and the need for physical therapy intervention. During the baseline assessment for the study, eligible participants received information about the study aims and signed a consent form. All participants received 10 physical therapy sessions consisting of general and specifics exercises and manual therapy. Patients were treated twice a week for 5 weeks. The participants were assessed at baseline and at follow up appointments at 5 weeks (immediately post-treatment) and at 3 and 6 months after baseline.
InstrumentsDemographic, anthropometric, and clinical characteristics at baseline were collected using standardized procedures. In addition, four instruments were used: (1) the SBST;1,20 (2) a Numeric Rating Scale (NRS) for pain;21 (3) the Roland Morris Disability Questionnaire (RMDQ);22,23 and (4) the Global Perceived Effect Scale (GPE).21 All instruments have previously been translated and cross-culturally adapted into Brazilian–Portuguese.20–22,24
The SBST is a validated questionnaire used to classify patients with LBP into three subgroups: low, medium, and high risk of persistent LBP related disability.1,24 The SBST consists of 9 items that assess physical (leg pain, comorbid pain, and disability) and psychosocial (bothersomeness, catastrophizing, kinesiophobia, anxiety, and depression) modifiable factors of poor prognosis. Each positive item adds one point to the total score. Patients with a total score of 0–3 points are classified as low risk, and those scoring 4 or 5 points on the psychosocial subscale are classified as high risk. Patients who score above 3 in the total score and below 4 in the psychosocial subscale are classified as medium risk.
The NRS is an 11-point scale which assesses pain intensity. This scale ranges from 0 “no pain” to 10 “the worst possible pain”. Participants were instructed to report the mean back pain intensity over the last seven days.21
The RMDQ evaluates the patient's level of disability associated with LBP using 24 items that describe daily tasks that the individuals may have difficulty performing due to LBP. Scores range from 0 to 24 with higher scores interpreted as higher level of disability.22,23
The GPE assesses the patient's global impression of recovery by comparing how they felt at the onset of symptoms to how they feel over the last few days. It is an 11-point numerical scale ranging from −5 (absolutely worse), 0 (no changes), to +5 (completely recovered).21
Data analysisThe normality of the data was tested by visual inspection of histograms. Descriptive statistics are provided for the characteristics of the sample and the clinical outcomes for each SBST subgroup over the 6-month period. We used one-way analysis of variance (continuous variables) or chi-square (categorical variables) to determine if baseline characteristics were different among SBST subgroups.
Multiple linear regression models were calculated to analyze the ability of the SBST to predict pain intensity, disability, and global perceived effect at 5 weeks and at 3 and 6 months post-baseline using both adjusted and unadjusted analysis. The reasons for using adjusted and unadjusted prediction analyses were:
(1) to determine the SBST ability at baseline to predict clinical outcomes in both short and medium terms (unadjusted analyses) and (2) to identify the influence of adding SBST results to other baseline characteristics (i.e., age, sex, duration of symptoms, and baseline outcomes) to predict clinical outcomes in both short and medium terms (adjusted analysis).
We chose age, sex, duration of symptoms, and outcomes at baseline as potential predictors as these variables add predictability to the SBST.6,8 There is evidence that the SBST is more likely to predict disability in older men1 and in patients with symptom duration ranging between 1 and 6 months.1 Additionally, there is also evidence that scores on outcomes measures at baseline are the strongest predictor of future outcomes in patients with back pain.10,25 Finally, these variables were tested as potential confounders in previous studies using the SBST.2,6,8 Therefore, we considered important to adjust the analysis using these variables.
To test the SBST predictive ability, nine linear regression models were built. We used patients’ classification into SBST risk subgroups as independent variable in all models. Pain intensity (NRS), disability (RMDQ), and global perceived effect (GPE) scores at 5 weeks and at 3 and 6 months were coded as dependent variables, that is, one model for each outcome at each time-point. All models were then re-built by adjusting them for the following possible confounders: age, sex, LBP duration, and the score on the related outcome measure at baseline. Dummy variables were used to allow inclusion of the SBST classification (low, medium, or high risk) in the regression models. The low-risk classification was coded as the reference variable.
Finally, to analyze which patients’ subgroup improved most in pain intensity, disability, and global perceived effect at all time-points, linear mixed models were calculated. Interaction terms of risk subgroups versus time were calculated to obtain the between-group differences. The dependent variables of each model were pain intensity, disability, and global perceived effect at different time-points. The SBST subgroups were considered as independent variables in all models. We used data imputation for missing data using the worst case scenario (i.e., we imputed the worst possible score). We used the IBM SPSS software package, version 19 in all analysis (IBM Corp, Armonk, New York).
ResultsFrom a total of 198 patients who were seeking care for LBP in the physical therapy department, 148 were considered eligible and were included in the study between June 2013 and November 2014 (supplemental online material 1). At baseline, based on the SBST, 21% of the patients were classified as low risk, 35% as medium risk, and 44% as high risk of poor prognosis. All patients were assessed at baseline and reassessed after 5 weeks. Two (1.4%) and three patients (2%) missed follow-up appointments at 3 and 6 months, respectively.
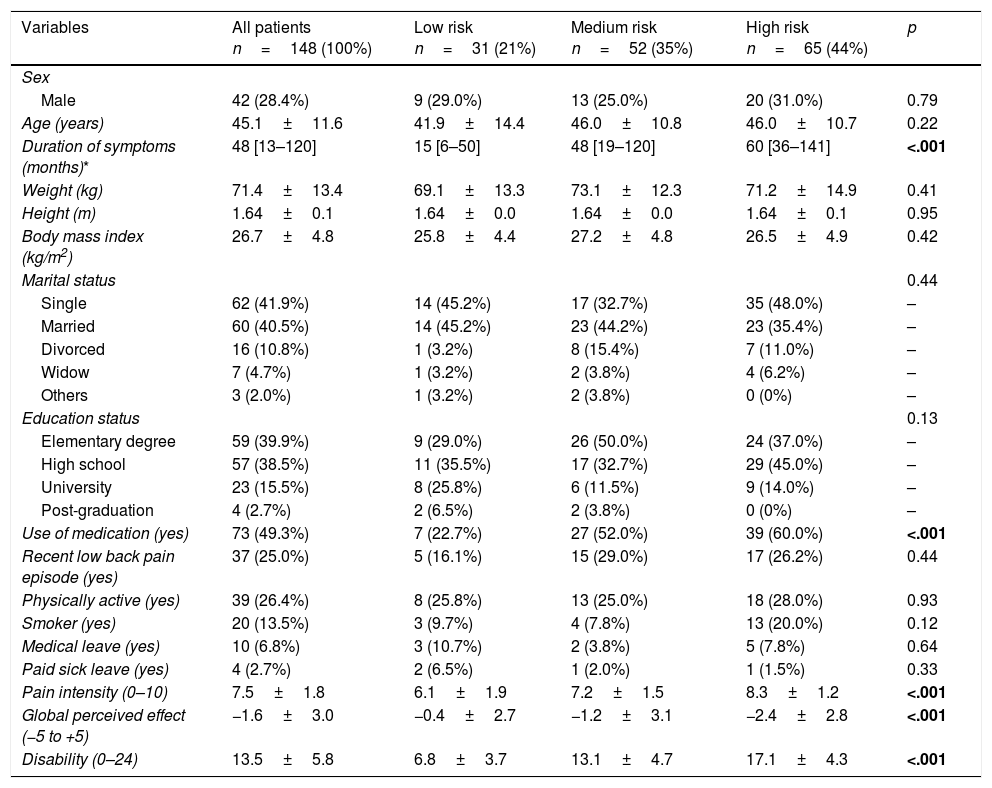
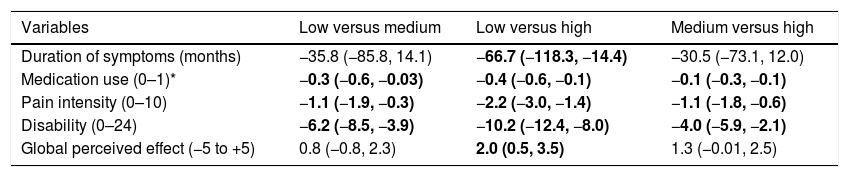
Most of the participants were women (71.6%), with a mean age of 45 years. Related to the first objective of this study, the following patients’ baseline characteristics were different among the SBST subgroups: duration of symptoms, use of medication, pain intensity, disability, and global perceived effect (Table 1). Post hoc tests showed that duration of symptoms and global perceived effect were different only between the low-and high-risk SBST subgroups. There were significant differences across the 3 sub-groups for all other variables (Table 2).
Characteristics of the participants at baseline (n=148).
| Variables | All patients n=148 (100%) | Low risk n=31 (21%) | Medium risk n=52 (35%) | High risk n=65 (44%) | p |
|---|---|---|---|---|---|
| Sex | |||||
| Male | 42 (28.4%) | 9 (29.0%) | 13 (25.0%) | 20 (31.0%) | 0.79 |
| Age (years) | 45.1±11.6 | 41.9±14.4 | 46.0±10.8 | 46.0±10.7 | 0.22 |
| Duration of symptoms (months)* | 48 [13–120] | 15 [6–50] | 48 [19–120] | 60 [36–141] | <.001 |
| Weight (kg) | 71.4±13.4 | 69.1±13.3 | 73.1±12.3 | 71.2±14.9 | 0.41 |
| Height (m) | 1.64±0.1 | 1.64±0.0 | 1.64±0.0 | 1.64±0.1 | 0.95 |
| Body mass index (kg/m2) | 26.7±4.8 | 25.8±4.4 | 27.2±4.8 | 26.5±4.9 | 0.42 |
| Marital status | 0.44 | ||||
| Single | 62 (41.9%) | 14 (45.2%) | 17 (32.7%) | 35 (48.0%) | – |
| Married | 60 (40.5%) | 14 (45.2%) | 23 (44.2%) | 23 (35.4%) | – |
| Divorced | 16 (10.8%) | 1 (3.2%) | 8 (15.4%) | 7 (11.0%) | – |
| Widow | 7 (4.7%) | 1 (3.2%) | 2 (3.8%) | 4 (6.2%) | – |
| Others | 3 (2.0%) | 1 (3.2%) | 2 (3.8%) | 0 (0%) | – |
| Education status | 0.13 | ||||
| Elementary degree | 59 (39.9%) | 9 (29.0%) | 26 (50.0%) | 24 (37.0%) | – |
| High school | 57 (38.5%) | 11 (35.5%) | 17 (32.7%) | 29 (45.0%) | – |
| University | 23 (15.5%) | 8 (25.8%) | 6 (11.5%) | 9 (14.0%) | – |
| Post-graduation | 4 (2.7%) | 2 (6.5%) | 2 (3.8%) | 0 (0%) | – |
| Use of medication (yes) | 73 (49.3%) | 7 (22.7%) | 27 (52.0%) | 39 (60.0%) | <.001 |
| Recent low back pain episode (yes) | 37 (25.0%) | 5 (16.1%) | 15 (29.0%) | 17 (26.2%) | 0.44 |
| Physically active (yes) | 39 (26.4%) | 8 (25.8%) | 13 (25.0%) | 18 (28.0%) | 0.93 |
| Smoker (yes) | 20 (13.5%) | 3 (9.7%) | 4 (7.8%) | 13 (20.0%) | 0.12 |
| Medical leave (yes) | 10 (6.8%) | 3 (10.7%) | 2 (3.8%) | 5 (7.8%) | 0.64 |
| Paid sick leave (yes) | 4 (2.7%) | 2 (6.5%) | 1 (2.0%) | 1 (1.5%) | 0.33 |
| Pain intensity (0–10) | 7.5±1.8 | 6.1±1.9 | 7.2±1.5 | 8.3±1.2 | <.001 |
| Global perceived effect (−5 to +5) | −1.6±3.0 | −0.4±2.7 | −1.2±3.1 | −2.4±2.8 | <.001 |
| Disability (0–24) | 13.5±5.8 | 6.8±3.7 | 13.1±4.7 | 17.1±4.3 | <.001 |
Categorical variables are expressed as number (%) and compared by chi-square. Continuous variables are expressed as mean±SD and compared by ANOVA. Bold values indicate statistically significant difference.
Differences between SBST subgroups.
| Variables | Low versus medium | Low versus high | Medium versus high |
|---|---|---|---|
| Duration of symptoms (months) | −35.8 (−85.8, 14.1) | −66.7 (−118.3, −14.4) | −30.5 (−73.1, 12.0) |
| Medication use (0–1)* | −0.3 (−0.6, −0.03) | −0.4 (−0.6, −0.1) | −0.1 (−0.3, −0.1) |
| Pain intensity (0–10) | −1.1 (−1.9, −0.3) | −2.2 (−3.0, −1.4) | −1.1 (−1.8, −0.6) |
| Disability (0–24) | −6.2 (−8.5, −3.9) | −10.2 (−12.4, −8.0) | −4.0 (−5.9, −2.1) |
| Global perceived effect (−5 to +5) | 0.8 (−0.8, 2.3) | 2.0 (0.5, 3.5) | 1.3 (−0.01, 2.5) |
Data are mean difference (95% confidence intervals) between SBST subgroups at baseline. Bold values indicate significant between-group differences.
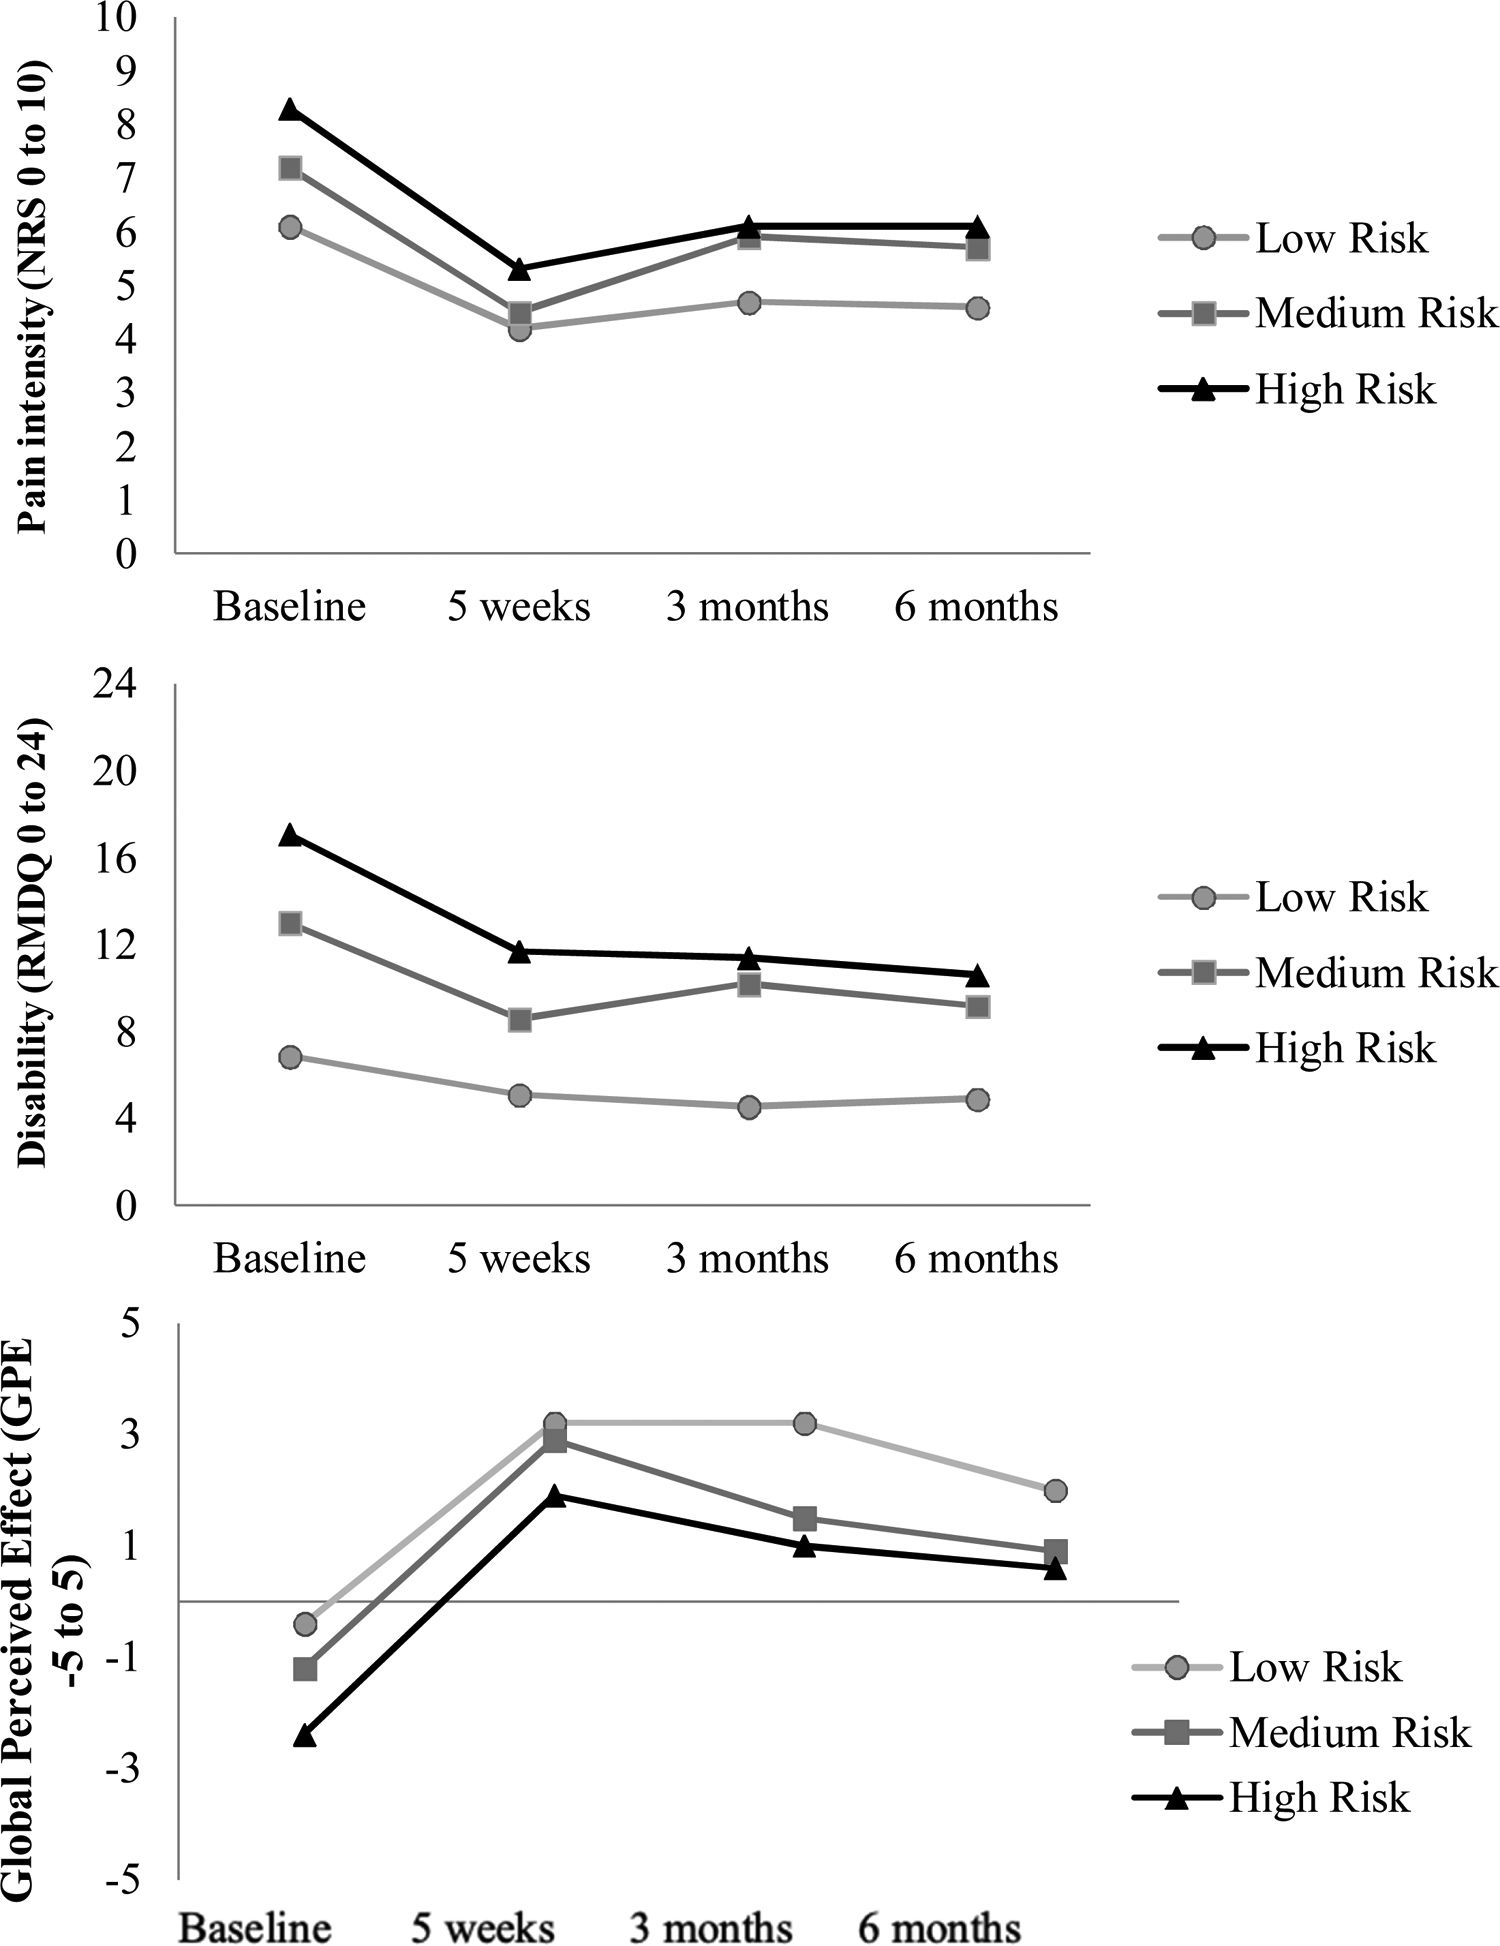
Descriptive data on clinical outcomes throughout the study, the second objective of the study, are provided in Fig. 1. Pain intensity, disability, and global perceived effect levels were consistently higher (i.e., worse) in patients classified in the high-risk subgroup compared to those in the low or medium risk subgroups for all time points. Similarly, the scores for those in the medium-risk subgroup were higher than those in the low-risk subgroup.

Description of pain intensity, disability, and global perceived effect for each time point over 6 months stratified by SBST subgroups. Negative values for global perceived effect means clinical worsening; lower values for pain intensity and disability mean lower pain and disability, respectively. Abbreviations: SBST, STarT Back Screening Tool; RMDQ, Roland Morris Disability Questionnaire; NRS, numerical rating scale.
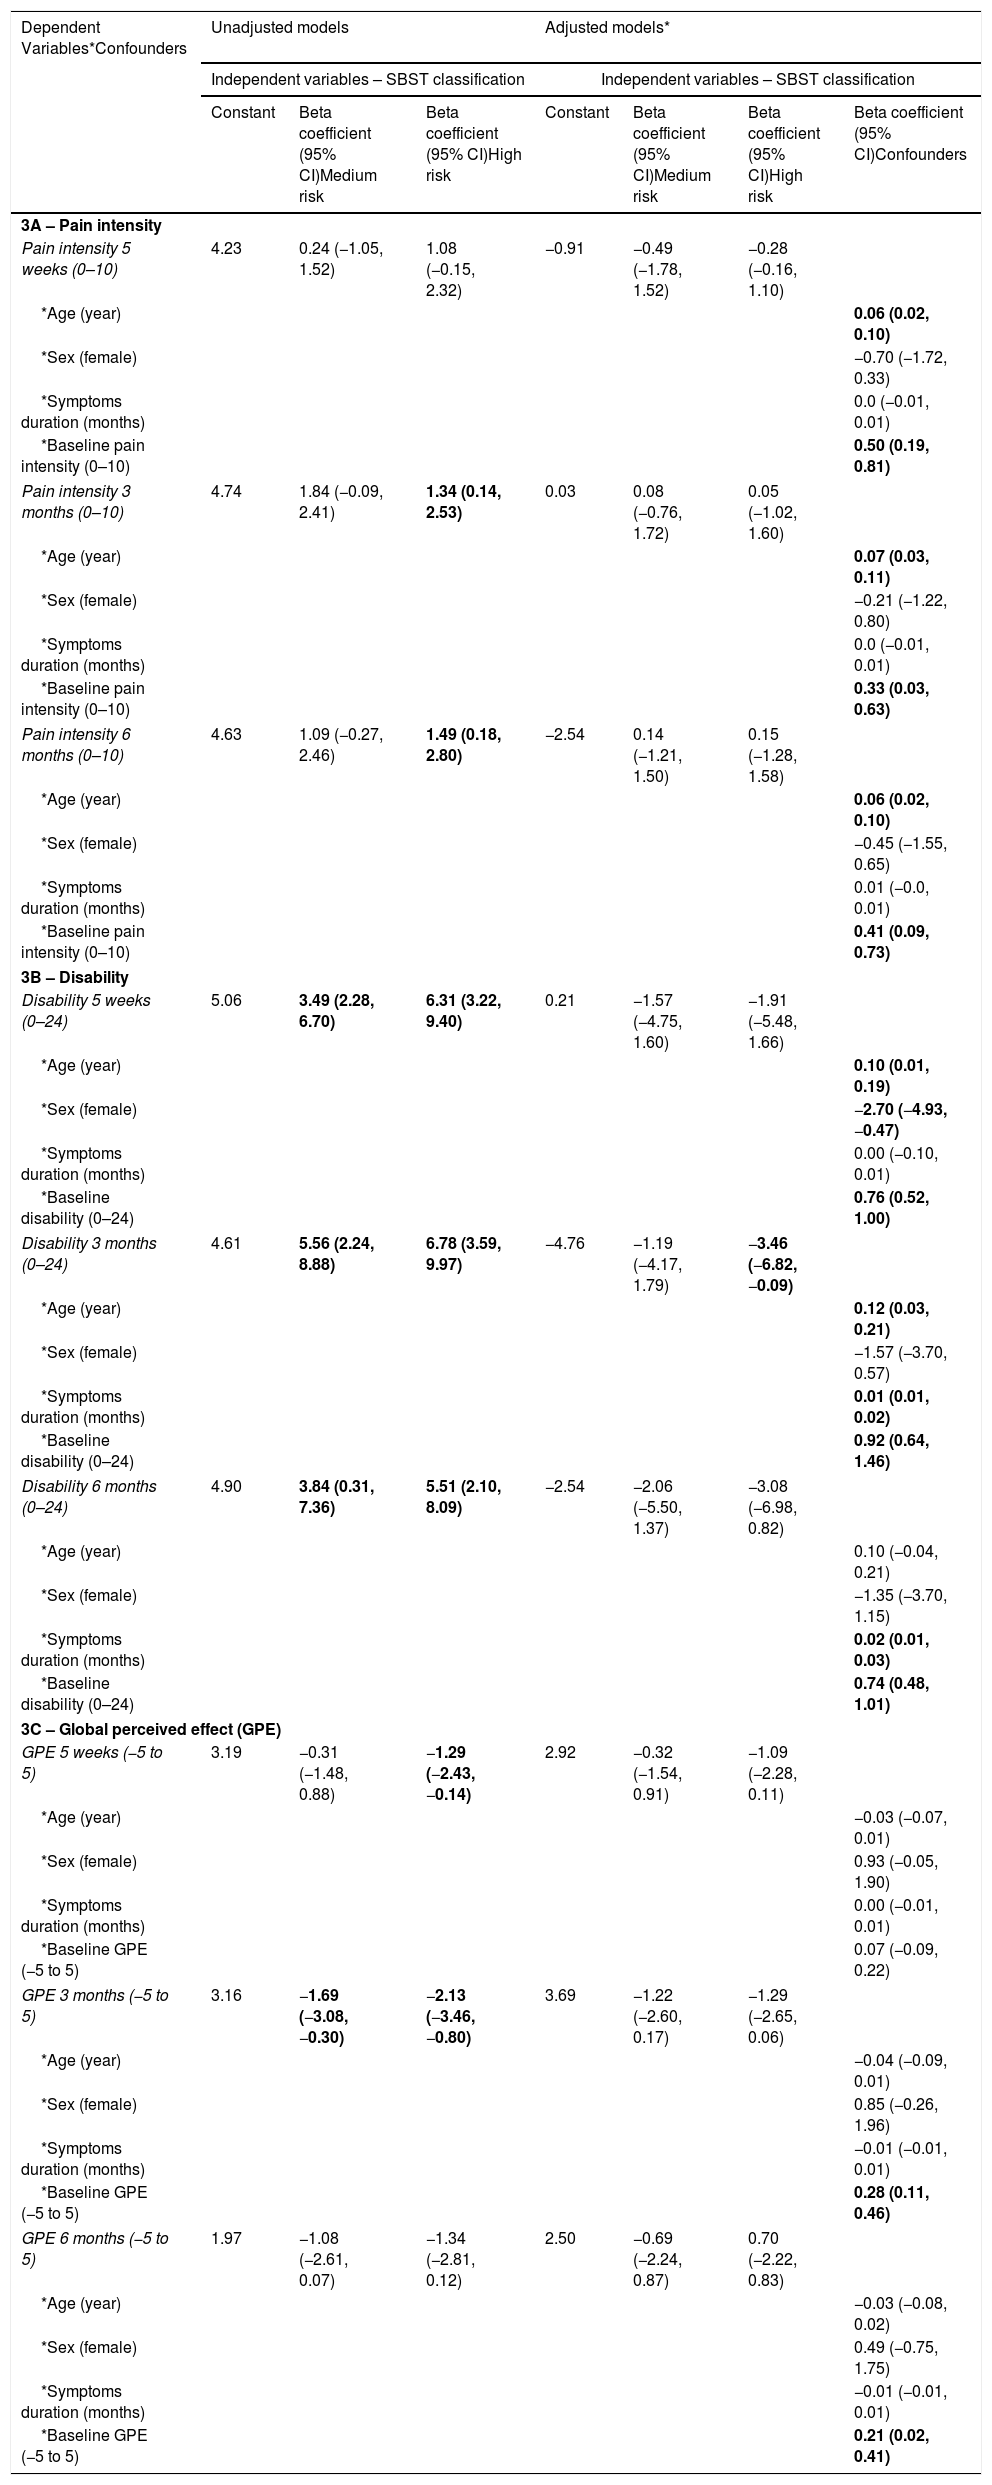
Table 3 provides the results of the unadjusted and adjusted analyses of linear regression for the predictive ability of the SBST for each outcome measure at each time point. The SBST, when using unadjusted models, predicted the prognosis of patients classified as high risk (compared with low-risk subgroup) for pain intensity, disability, and global perceived effect at 5 weeks and at 3 and 6 months with the exception for pain intensity at 5 weeks and global perceived effect at 6 months. The SBST (unadjusted models) also predicted the prognosis of patients classified as medium risk (compared with low-risk subgroup) for disability at all-time points and for global perceived effect at 3 months. In contrast, when models were adjusted for possible confounders, the SBST was only able to predict the prognosis of disability at 3 months (Beta coefficient=−3.46 points; 95% CI=−6.82 to −0.09; p=0.04) for patients classified as high risk (compared to low risk).
Unadjusted and adjusted regression models to predict pain intensity – 3A, disability – 3B, and global perceived effect – 3C.
| Dependent Variables*Confounders | Unadjusted models | Adjusted models* | |||||
|---|---|---|---|---|---|---|---|
| Independent variables – SBST classification | Independent variables – SBST classification | ||||||
| Constant | Beta coefficient (95% CI)Medium risk | Beta coefficient (95% CI)High risk | Constant | Beta coefficient (95% CI)Medium risk | Beta coefficient (95% CI)High risk | Beta coefficient (95% CI)Confounders | |
| 3A – Pain intensity | |||||||
| Pain intensity 5 weeks (0–10) | 4.23 | 0.24 (−1.05, 1.52) | 1.08 (−0.15, 2.32) | −0.91 | −0.49 (−1.78, 1.52) | −0.28 (−0.16, 1.10) | |
| *Age (year) | 0.06 (0.02, 0.10) | ||||||
| *Sex (female) | −0.70 (−1.72, 0.33) | ||||||
| *Symptoms duration (months) | 0.0 (−0.01, 0.01) | ||||||
| *Baseline pain intensity (0–10) | 0.50 (0.19, 0.81) | ||||||
| Pain intensity 3 months (0–10) | 4.74 | 1.84 (−0.09, 2.41) | 1.34 (0.14, 2.53) | 0.03 | 0.08 (−0.76, 1.72) | 0.05 (−1.02, 1.60) | |
| *Age (year) | 0.07 (0.03, 0.11) | ||||||
| *Sex (female) | −0.21 (−1.22, 0.80) | ||||||
| *Symptoms duration (months) | 0.0 (−0.01, 0.01) | ||||||
| *Baseline pain intensity (0–10) | 0.33 (0.03, 0.63) | ||||||
| Pain intensity 6 months (0–10) | 4.63 | 1.09 (−0.27, 2.46) | 1.49 (0.18, 2.80) | −2.54 | 0.14 (−1.21, 1.50) | 0.15 (−1.28, 1.58) | |
| *Age (year) | 0.06 (0.02, 0.10) | ||||||
| *Sex (female) | −0.45 (−1.55, 0.65) | ||||||
| *Symptoms duration (months) | 0.01 (−0.0, 0.01) | ||||||
| *Baseline pain intensity (0–10) | 0.41 (0.09, 0.73) | ||||||
| 3B – Disability | |||||||
| Disability 5 weeks (0–24) | 5.06 | 3.49 (2.28, 6.70) | 6.31 (3.22, 9.40) | 0.21 | −1.57 (−4.75, 1.60) | −1.91 (−5.48, 1.66) | |
| *Age (year) | 0.10 (0.01, 0.19) | ||||||
| *Sex (female) | −2.70 (−4.93, −0.47) | ||||||
| *Symptoms duration (months) | 0.00 (−0.10, 0.01) | ||||||
| *Baseline disability (0–24) | 0.76 (0.52, 1.00) | ||||||
| Disability 3 months (0–24) | 4.61 | 5.56 (2.24, 8.88) | 6.78 (3.59, 9.97) | −4.76 | −1.19 (−4.17, 1.79) | −3.46 (−6.82, −0.09) | |
| *Age (year) | 0.12 (0.03, 0.21) | ||||||
| *Sex (female) | −1.57 (−3.70, 0.57) | ||||||
| *Symptoms duration (months) | 0.01 (0.01, 0.02) | ||||||
| *Baseline disability (0–24) | 0.92 (0.64, 1.46) | ||||||
| Disability 6 months (0–24) | 4.90 | 3.84 (0.31, 7.36) | 5.51 (2.10, 8.09) | −2.54 | −2.06 (−5.50, 1.37) | −3.08 (−6.98, 0.82) | |
| *Age (year) | 0.10 (−0.04, 0.21) | ||||||
| *Sex (female) | −1.35 (−3.70, 1.15) | ||||||
| *Symptoms duration (months) | 0.02 (0.01, 0.03) | ||||||
| *Baseline disability (0–24) | 0.74 (0.48, 1.01) | ||||||
| 3C – Global perceived effect (GPE) | |||||||
| GPE 5 weeks (−5 to 5) | 3.19 | −0.31 (−1.48, 0.88) | −1.29 (−2.43, −0.14) | 2.92 | −0.32 (−1.54, 0.91) | −1.09 (−2.28, 0.11) | |
| *Age (year) | −0.03 (−0.07, 0.01) | ||||||
| *Sex (female) | 0.93 (−0.05, 1.90) | ||||||
| *Symptoms duration (months) | 0.00 (−0.01, 0.01) | ||||||
| *Baseline GPE (−5 to 5) | 0.07 (−0.09, 0.22) | ||||||
| GPE 3 months (−5 to 5) | 3.16 | −1.69 (−3.08, −0.30) | −2.13 (−3.46, −0.80) | 3.69 | −1.22 (−2.60, 0.17) | −1.29 (−2.65, 0.06) | |
| *Age (year) | −0.04 (−0.09, 0.01) | ||||||
| *Sex (female) | 0.85 (−0.26, 1.96) | ||||||
| *Symptoms duration (months) | −0.01 (−0.01, 0.01) | ||||||
| *Baseline GPE (−5 to 5) | 0.28 (0.11, 0.46) | ||||||
| GPE 6 months (−5 to 5) | 1.97 | −1.08 (−2.61, 0.07) | −1.34 (−2.81, 0.12) | 2.50 | −0.69 (−2.24, 0.87) | 0.70 (−2.22, 0.83) | |
| *Age (year) | −0.03 (−0.08, 0.02) | ||||||
| *Sex (female) | 0.49 (−0.75, 1.75) | ||||||
| *Symptoms duration (months) | −0.01 (−0.01, 0.01) | ||||||
| *Baseline GPE (−5 to 5) | 0.21 (0.02, 0.41) | ||||||
SBST, STarT Back Screening Tool; CI, confidence interval; GPE, global perceived effect.
The low risk of the SBST was used as a reference category in all models. *Adjusted variable as a possible confounder in model.
Bold values indicate statistically significant estimates.
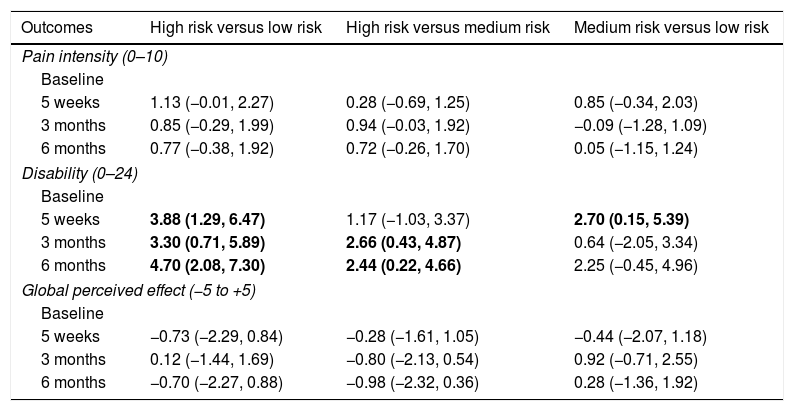
Data for differences in improvements between sub-groups on the SBST (the last objective of this study) are provided in Table 4. There was no statistically significant difference in improvement for pain intensity and global perceived effect across subgroups. But, patients classified as high risk had a greater improvement in disability when compared to patients classified as low and medium risk (with the exception of the 5-week comparison between high and medium risk subgroups). Finally, the medium risk subgroup had greater improvement in disability when compared to low risk subgroup at the 5-week assessment.
Differences in improvement from baseline to 3 follow-up time points between sub-groups based on the SBST.
| Outcomes | High risk versus low risk | High risk versus medium risk | Medium risk versus low risk |
|---|---|---|---|
| Pain intensity (0–10) | |||
| Baseline | |||
| 5 weeks | 1.13 (−0.01, 2.27) | 0.28 (−0.69, 1.25) | 0.85 (−0.34, 2.03) |
| 3 months | 0.85 (−0.29, 1.99) | 0.94 (−0.03, 1.92) | −0.09 (−1.28, 1.09) |
| 6 months | 0.77 (−0.38, 1.92) | 0.72 (−0.26, 1.70) | 0.05 (−1.15, 1.24) |
| Disability (0–24) | |||
| Baseline | |||
| 5 weeks | 3.88 (1.29, 6.47) | 1.17 (−1.03, 3.37) | 2.70 (0.15, 5.39) |
| 3 months | 3.30 (0.71, 5.89) | 2.66 (0.43, 4.87) | 0.64 (−2.05, 3.34) |
| 6 months | 4.70 (2.08, 7.30) | 2.44 (0.22, 4.66) | 2.25 (−0.45, 4.96) |
| Global perceived effect (−5 to +5) | |||
| Baseline | |||
| 5 weeks | −0.73 (−2.29, 0.84) | −0.28 (−1.61, 1.05) | −0.44 (−2.07, 1.18) |
| 3 months | 0.12 (−1.44, 1.69) | −0.80 (−2.13, 0.54) | 0.92 (−0.71, 2.55) |
| 6 months | −0.70 (−2.27, 0.88) | −0.98 (−2.32, 0.36) | 0.28 (−1.36, 1.92) |
SBST, STarT Back Screening Tool.
Data are mean between group differences and 95% confidence intervals. Bold values indicate significant between-group differences.
Patients with chronic LBP were stratified according to the SBST to explore the purposes of this study. These patients were individually treated with exercises and manual therapy and were assessed over a period of six months. We found that patients classified as low risk with the SBST had a shorter duration of symptoms and use less medication. Pain intensity, disability, and global perceived effect were higher in patients at high-risk, followed by those at medium risk, and finally those at low risk over the 6-month duration of the study. The SBST was able to predict short and medium-term disability using unadjusted predictive analyses, but when these analyses were adjusted for potential confounders the SBST predictive capacity decreased. Patients at high risk presented greater improvements in disability compared to those in the medium and low risk subgroups when they received the same treatment. It should be noted that some of these differences were below the minimal clinical important difference.26
The interventions provided to the participants of this study (exercise and manual therapy) were very similar for all 3 groups and these interventions are based upon current LBP guidelines for patients with chronic LBP.27,28 In addition, all patients were assessed at the same time intervals and there was less than a 2% loss of follow-up at all time-points. Given these methodological strengths, the present study differs from previous studies in which the sample was mixed, and the treatment sessions were not standardized.6,14 On the other hand, the temporal definition of chronic pain used in this study could be limited, with the knowledge that chronic pain is extremely complex and should involve a full biopsychosocial framework.29 However, we followed the criteria used in the latest LBP Lancet series16,30,31 that provides all recommendations based upon symptom duration.27,32 We can highlight that this is a secondary analysis of an existing randomized controlled trial17,18 and the sample size calculation was not performed for this cohort study. These features can also be considered as a limitation for this study.
The risk stratification using SBST at baseline showed that the majority of patients from our dataset were classified as high risk.8 This finding is quite unique compared with previous studies in primary care,2,5,11 emergency,33,34 and physical therapy departments6,9,14 that found that most patients were classified as low or medium risk at baseline. This might be because our patients were recruited to participate in a clinical trial instead of recruiting people from the community. Another possible explanation is that it may be a specific characteristic of the Brazilian population. A recent study involving 600 patients with acute low back pain seeking care at emergency departments in Brazil found that almost half of the patients (49%) were classified as high risk measured by the SBST.35 In general, the SBST was able to distinguish subgroups of patients from specific characteristics, such as the duration of symptoms and the use of medication. It is well known that a longer duration of symptoms predicts a worse prognosis in patients with LBP,13,36 however the use of medication still seems inconclusive as being an unfavorable prognostic factor for LBP and should be better studied according to the frequency and classification of these drugs. All other demographic characteristics investigated in our study showed no statistically significant difference regarding the SBST subgroups. A study conducted in the United States37 found no statistical difference between the SBST subgroups for all demographic characteristics investigated.37 Our study showed that the SBST could stratify distinct subgroups of patients based on pain intensity, disability, and global perceived effect over 6 months. These findings are consistent with those of previous studies that patients at high-risk consistently present higher severity of symptoms compared to patients with medium and low risk for all outcomes at baseline, independent of the clinical setting.2,12,13,37
We built different prediction models to evaluate the SBST predictive ability. We conducted the same predictive analyses adjusting for age, sex, duration of symptoms, and outcome measures at baseline as well as unadjusted models. These adjusted analyses were conducted to identify if the SBST adds predictability over other baseline characteristics that are commonly measured during any physical therapy assessment. Our results have shown that when the prediction analysis was unadjusted, the SBST was able to predict disability at 5 weeks, 3 months, and 6 months. This finding was not surprising as there is some evidence that the SBST when used in isolation, was able to predict disability in the long term.7,38 However, after adjustments, the SBST was able to predict disability only at the 3-month assessment and only for the high-risk subgroup, relative to the low risk. These results were also somehow expected as the best predictor of a clinical outcome is the score on the same outcome measured at baseline25 and have influenced the model. In addition, our study also indicated that age contributed to the prediction of clinical outcomes at both short and medium terms. The duration of symptoms and sex, in contrast, were identified as poor confounders in terms of prediction of clinical outcomes.1
The clinical implications of our findings show that clinicians should use the SBST classification, as well as age and clinical outcome measures for a more precise prediction of prognosis when assessing patients with back pain. However, it seems that the SBST does not add predictive value to basic baseline characteristics. The SBST in isolation can predict disability in both short and medium terms. On the other hand, age and clinical outcomes at baseline are able to predict disability and pain intensity at short and medium terms. A recent systematic review identified that screening tools are poor as predictors, especially in secondary care.39
Although we are aware that the best design for evaluating clinical improvement between groups would be a randomized controlled trial; this study aimed to identify the observed effects for each SBST subgroup from the same intervention received (physical therapy based on exercise and manual therapy). However, it is important to understand how outcomes may have been similar or different if patients were treated differently based on baseline SBST risk status. We identified that although the patients classified as high risk presented higher levels of symptoms at all time points, the high risk presented the highest clinical improvement rate for disability, compared to the medium and low risk subgroups. This result was unexpected because patients classified as high risk should preferably have received a psychosocial components during treatment. But, as our study does not have a comparison group, it was not possible to control for other common confounders such as placebo effects, regression to the mean, recall bias, and natural history. Therefore, caution should be exercised in interpreting these results. Future studies in low and middle income countries, should compare the effect of “standard” physical therapy practice with the effect of physical therapy tailored based on SBST classification.2
The recent Lancet series on LBP concluded that most, if not all, research in LBP across the globe have been performed in high income countries.16,30,31 There are a large number of social determinants that distinguish people who live in high-income countries compared to people who live in middle or low-income countries.16,30,31 Moreover, the Brazilian public health system is quite different than the British or American health systems, for example.40 Therefore, it is plausible that the usefulness of the SBST varies across countries.
ConclusionThe clinical outcomes were different between SBST subgroups over 6 months. The SBST was able to predict disability in both short and medium terms using unadjusted analyses. In terms of pain intensity and global perceived effect, the results were inconsistent. The SBST does not add predictive value to basic baseline characteristics as age, sex, duration of symptoms, and scores on other initial outcome measures. Patients classified as high risk were those who experienced the best outcomes after receiving exercises and manual therapy.
Conflict of interestNone declared.
We wish to thank Fundação de Amparo a Pesquisa do Estado de São Paulo (FAPESP) #Grant: 2013/02075-8 and 2016/18575-8 and Coordenação de Aperfeiçoamento de Pessoal de Nível Superior (CAPES) and Conselho Nacional de Desenvolvimento Científico e Tecnológico (CNPQ) for funding this study.
The following are the supplementary data to this article:


