


Infrared thermography (IRT) is an easy-to-use, noninvasive and pain-free tool that can be used to evaluate function of the pelvic floor (PF) muscles.
ObjectiveTo analyze vaginal manometry, temperature, and percentage of colors achieved through IRT of the PF muscles at rest and during maximum voluntary contraction. The relationship between PF muscles strength and IRT temperature was also assessed.
MethodsTwo-hundred and thirty-one women (mean ± SD age: 58.4±5.9 years) participated in this study. IRT recorded the minimum, average, and maximum temperatures, and the colors of the PF area at rest and during maximum voluntary contraction. The pressure applied during the three maximum voluntary PF contractions was evaluated through vaginal manometry.
ResultsThe women had a PF average temperature of 36.4 ± 0.8°C. There were no differences in the IRT temperatures between rest and during PF muscles contraction. The percentages of white, red, orange, yellow, green, cyan, and blue colors were different at rest and during contraction. Warm colors became more visible in the center of the image during the PF muscles maximum voluntary contraction. There was a positive correlation between the PF average temperature and PF manometry (r=0.7; p=0.001).
ConclusionThe IRT was not able to detect differences in the temperature of the PF area between at rest and during contraction. However, a strong correlation between PF temperature and vaginal manometry was found.
Pelvic floor (PF) dysfunction causes structural and functional changes and is associated with malfunctions and injuries of the pelvic floor muscles (PFM). The most frequent PF dysfunctions in women are urinary incontinence,1 fecal incontinence,2 and sexual problems.3 These dysfunctions have been associated with age, pregnancy, childbirth injuries, obesity, genetic factors, and lack of physical activity.1,2
Evaluation of the PFM functions has an essential role in the diagnosis and treatment of PF dysfunctions.4 Digital palpation, manometry, electromyography, ultrasound, and magnetic resonance imaging are commonly used to assess PFM in clinical practice.5
Infrared thermography (IRT) is an imaging method used to assist in the diagnosis of selected neurological and musculoskeletal conditions, and in the early detection of conditions such as periprosthetic joint infections,6 breast cancer,7 musculoskeletal dysfunctions,8 and injuries.9 IRT measures the infrared radiation emitted by a surface and transforms the radiation intensity into temperature values. This technique has been demonstrated to have high sensitivity and specificity for clinical diagnoses of some conditions related to cancer and muscular impairments.10,11
IRT has been used to explore temperature alterations in some systems of the human body.12 Several PF problems have been associated with vascular alterations, such as those involved in sexual and some climacteric dysfunctions.13 Possibly, IRT may be able to detect malfunctioning of the PF in the very early stages, even before the onset of symptoms. One advantage over other techniques is that it can be used during periods that are not possible to perform intravaginal evaluations and is potentially more comfortable and better accepted by women. Similar to other studies that have associated tissue temperatures with muscular performance14,15 an evaluation of the PF by IRT may detect temperature patterns that might be associated with muscular dysfunction. In addition, IRT may be a relatively low-cost additional resource to assess PFM.
This study aimed to analyze vaginal manometry, temperature, and the percentages of various colors through IRT of the PF area in both the resting state and during maximum voluntary contraction. The relationship between PFM strength and the temperature of the PF area was also assessed.
MethodsStudy designThis cross-sectional study followed the Strengthening the Reporting of Observational Studies in Epidemiology (STROBE) Statement recommendations.16 It was approved by the Research Ethics Committee from Universidade Federal do Rio Grande do Norte, Natal, RN, Brazil (number 2.328.269) and was conducted in accordance with the principles of the Helsinki Declaration. All participants signed the Informed Consent before participating in the study.
Participants and settingParticipants were recruited from February 2018 to February 2019 at the Gynecology and Climacteric outpatient clinics of the Januário Cicco Maternity School (Natal/RN/Brazil). The women were included if they met the following criteria: (1) age between 45 and 70 years; (2) nonpregnant; (3) no urinary/vaginal infection; (4) without vasomotor disease or gynecological bleeding; (5) no gynecological surgery or childbirth in the last six months; and (6) no neurological disorders that could compromise the IRT assessment. Those who used vasomotor drugs, did not present any ability to contract the PFM (as detected by manual palpation), presented with pelvic organ prolapse (stage three or four according to the Baden-Walker scale),17 reported pain/discomfort during a vaginal probe introduction, or had a PFM contraction associated with activation of the abdominal, gluteal, and hip adductor muscles were excluded from the study.
To assess the PFM contraction, all women were in supine, with bent knees and flexed and abducted hips. They were asked to perform three voluntary PFM contraction attempts. An examiner with five years of experience in women's health physical therapy performed all the evaluations. The verbal command given by the examiner to the participants was to contract the PFM by squeezing it with maximum force as if they were holding their urine.
Variables and measurementsInitially, data related to age, marital status, parity, types of delivery, menstrual cycle, and body mass index were collected. Next, PF temperature and vaginal manometry were assessed in this order.
Thermography was measured using a Flir® thermographic camera, model one (FLIR Systems, Inc., Wilsonville, OR, USA) that was attached to an iPhone 6S (Apple, Inc., Cupertino, CA, USA). The device weighs 30 g and contains two cameras, a LeptonTM thermal sensor (160 × 120 pixels) and a visible VGA camera (640 × 480 pixels). The two images obtained from these cameras were merged using the Multi-Spectral Dynamic Imaging (MSX) technology, resulting in one thermal image with a resolution of 640 × 480 pixels. The FLIR One camera has a temperature capability ranging from −20°C to 120°C and can detect temperature differences as small as 0.1°C. The Flir® software was used to show the minimum, average, and maximum temperature.
Thermography was used to record the PFM at rest and during a single maximum voluntary contraction with a camera positioned perpendicular to the perineum region, which is the central point of a rectangular image 5 cm wide and 10 cm long. The images were analyzed using a rainbow chart.
Some factors were controlled to achieve surface thermography:18 room temperature between 18°C and 25°C, without lighting, with upward ventilation, 60% humidity as evaluated by a digital thermo-hygrometer. The distance between the camera and perineum region was 20 cm, and the patient acclimatization time to the setting before taking an image was 10 min.19 Those volunteers who had hair in the image collection region were shaved after agreeing to this procedure. The researcher used a razor blade and took care to not injure the skin. The evaluation always occurred between 8:00 AM and 11:00 AM, was conducted by the same trained evaluator (a women's health physical therapist with five years of experience in performing PFM assessments and IRT) and lasted for about 10 min.
The TermoCrivo® software package was used to illustrate the ratio of warm and cold colors based on the HSV model (hue, saturation, and value). Recent studies showed good correlation between thermography and Doppler ultrasound in different diseases and body areas.20-22 In this study, the colors were classified as warm if they displayed white, red, orange, or yellow and as cold if they showed green, cyan, blue, violet, or magenta.23 For the color analysis using the software, the pixel count of each color was used, resulting in the acquisition of the percentage of white, red, orange, yellow, blue, cyan, green, violet, and magenta areas in the image. The total amount of pixels in each image was 307,200. The sum of the frequency of all colors reached 100%.
Lastly, the vaginal manometer Peritron® Model 9300V (Cardio Design, Australia) was used to measure the pressure produced by PFM contraction. All participants remained in the supine position and digital palpation was initially performed to confirm their ability to voluntarily contract the PFM. The vaginal probe was covered with a nonlubricated latex condom and then lubricated using a gel before introduction in the vagina. Next, the probe was introduced gently, without causing pain, approximately 3.5 cm into the vaginal cavity with the device turned off. A verbal command for a muscle contraction was given to hold the urine and squeeze the vagina with maximal force. The participants performed three maximum voluntary contractions, with a 30-s rest between the muscle contractions.24 The average of the three maximum voluntary contractions were used for the analysis.25 The pressure values were categorized as very weak for pressure values ranging from 7.5 to 14.5 cmH2O; weak for pressure values from 14.6 to 26.5 cmH2O; moderate for pressure values varying from 26.6 to 41.5 cmH2O; good for pressure values from 41.6 to 60.5 cmH2O; and strong for pressure values at or above 60.6 cmH2O.26
Data analysesData were analyzed by the Statistical Package for Social Sciences Software (SPSS) 20.0 for Windows. Continuous data are presented as mean ± standard deviation, after being tested for normality with the Kolmogorov-Smirnov test. Categorical variables are presented as counts and percentages. Paired Student's t-tests were used to compare the thermographic analyses between rest and during the contractions. Pearson's correlation was used to analyze the thermographic and vaginal manometry data. A value of p < 0.05 was set as statistical significance.
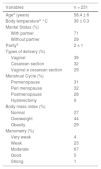
ResultsTwo-hundred and fifty-nine women was screened for eligibility. Nineteen individuals did not perform an effective PFM contraction, and nine felt discomfort during the probe introduction. Two-hundred and thirty-one women completed the study. Table 1 provides the sociodemographic and gynecology-obstetric information of the participants.
Sociodemographic, clinical, and gynecology-obstetric descriptive data.
| Variables | n = 231 |
|---|---|
| Agea (years) | 58.4 ± 6 |
| Body temperaturea °C | 36 ± 0.3 |
| Marital Status (%) | |
| With partner | 71 |
| Without partner | 29 |
| Paritya | 2 ± 1 |
| Types of delivery (%) | |
| Vaginal | 39 |
| Cesarean section | 32 |
| Vaginal e cesarean section | 29 |
| Menstrual Cycle (%) | |
| Premenopause | 31 |
| Peri menopause | 32 |
| Postmenopause | 28 |
| Hysterectomy | 9 |
| Body mass index (%) | |
| Normal | 27 |
| Overweight | 44 |
| Obesity | 29 |
| Manometry (%) | |
| Very weak | 4 |
| Weak | 23 |
| Moderate | 67 |
| Good | 5 |
| Strong | 1 |
Considering the thermographic characteristics at rest and during maximum voluntary contraction, the color images showed a greater percentage of white and red colors (classified as warm) during contraction (Fig. 1). Minimum, average, and maximal temperatures of the PFM were not different when comparing at rest and during contraction (Table 2). The percentages of white, red, orange, yellow, green, cyan, and blue colors were different between rest and during contraction (Table 2). There was a positive and strong correlation between PFM pressure and PF average temperature (Table 3).

Thermographic characteristics of the pelvic floor region at rest and during pelvic floor muscle contraction.
Results in percentage (mean ± standard deviation); °C: degree Celsius.
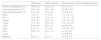
Correlation between PFM pressure and average temperature of the PF area.
| n | Manometry (cmH2O) | PF temperature (°C) | Correlation | p value | |
|---|---|---|---|---|---|
| Very weak | 9 | 9.5 ± 2.7 | 34.9 ± 0.7 | 0.7 | 0.001* |
| Weak | 53 | 19.3 ± 2.8 | 35.6 ± 0.8 | ||
| Moderate | 154 | 34.5 ± 3.2 | 36.7 ± 0.5 | ||
| Good | 12 | 53.7 ± 5.6 | 37.5 ± 0.1 | ||
| Strong | 3 | 63.2 ± 1.4 | 37.6 ± 0.0 |
Results in mean ± standard deviation; n, number of participants; manometry, PFM pressure recorded by the manometer; ºC, PF average temperature in degree Celsius; PFM, pelvic floor muscles; PF, pelvic floor.
This study shows novel data about assessment of the PFM by using IRT. This method was able to identify color differences between the PFM at rest and during PFM maximal voluntary contraction. A positive and strong correlation between PF temperature and PFM squeeze pressure was also found, and indicates that the higher the temperature the greater the PFM squeeze pressure. In fact, during muscle contraction, energy generated is dissipated and conducted to the skin through blood flow.27,28
In this study, warm and cold colors during the evaluation of the PF by thermography had different patterns. For example, colors considered colder filled approximately 56% of the image at rest. Conversely, during muscle contraction, warmer colors filled nearly 51% of the image. This may occur because phasic fibers in the PF are located more centrally and superficially. These fibers are the first to be triggered during muscle contraction and their main feature is to quickly generate a large amount of force,29,30 which means that muscle anatomic location and its physiology are variables that can affect thermographic results. It is important to mention that there are no studies that performed a qualitative investigation between temperature and muscle function. Research on muscle temperature mainly concerns the association of issues and environment or muscle temperature on fatigue and strength.31
Although there was a difference among the colors’ distributions, no differences were found in the temperature values (minimum, average, and maximum) between PFM at rest and during contraction. This finding is probably related to the fact that PFM contractions performed in this study were not a physical exercise protocol. Therefore, it is possible that in the absence of strength training the force generated was insufficient to generate a local temperature change.29 Some studies in this area used muscle load to evaluate fatigue.32 It means that the more the force exerted during tests, the greater the changes in the temperature pattern. So, the physiologic understanding of these studies cannot be associated with researches that assessed only three voluntary muscle contractions.33,34
Our results showed a strong correlation between PFM pressure and the PF temperature during maximum voluntary contraction. Formenti et al.35 reported an increase in skin temperature during anaerobic exercise and a decrease after the exercise, associating these differences to muscular power. It is important to emphasize that skin temperature measured by the IRT depends on several factors, such as the environment, heat dissipation,36,37 and the previous level of strength.38 In this study, as the environment and heat dissipation were controlled, the levels of strength might have been the main aspect associated with this strong correlation.
We aimed to understand the IRT pattern of the PFM at rest and during muscular contraction. The literature shows that the use of thermography helps to understand the physiological mechanisms that occur during exercise.39 Vasoconstriction of the skin is expected early in exercise due to an increase of blood flow to active muscles during contraction. However, during resistance exercise, central temperature regulatory mechanisms promote cutaneous vasodilation, so heat dissipation occurs through the skin. This mechanism is called thermoregulation, which removes excessive body heat, allowing the individual to maintain exercise longer.39,40 For these reasons, we believe that thermography can be used as another resource for PFM evaluation, with potential of adjusting the intensity of the training protocols, in addition to evaluating their effectiveness.
We consider thermography to be a potential tool for PFM analysis, due to the possibility of its use in cases in which intracavitary evaluation is limited or not possible, for example, postpartum in the presence of physiological lochia or pain. Moreover, when detecting temperature alterations by using IRT, the health sciences have considered this imaging exam to be a diagnostic tool to reduce the exposure of individuals to ionizing radiation.41 However, comparisons of IRT to other diagnostic exams that use radiation to assess the PF have not been documented yet. The FLIR ONE is recommended because it is feasible, mobile, and provides fast measurements in clinical burn practice; nonetheless, its routine use in evaluating the PF requires additional research.38
Finally, it is important to mention that a sample size calculation was not performed in this study and only 45- to 70-year-old women were included, thus limiting the external validity of the results. However, IRT as presented in this study is relevant due to its wide clinical applicability.
ConclusionIRT was able to identify differences in colors at rest and during PFM maximum voluntary contraction. However, there was no difference in overall PF temperature. White, red, orange, or yellow colors became more visible in the center of the image during contraction. Also, there was a strong correlation between vaginal manometry and the temperature of the PF area.
This study was financed in part by the Coordenação de Aperfeiçoamento de Pessoal de Nível Superior - Brazil (CAPES) - Finance Code 001.


