
Physical activity in natural environments, such as trail running, is a way to nurture physical and mental health. However, running has an inherent risk of musculoskeletal injuries.
ObjectivesTo investigate the prevalence of running-related injuries (RRI) and cramps, and to describe the personal and training characteristics of Brazilian trail runners.
MethodsA total of 1068 trail runners were included in this observational cross-sectional study. The participants had at least six months of trail running experience. The data were collected between April 2019 and February 2020 through an online and self-reported survey.
ResultsThe point prevalence of RRIs was 39.2 % (95 % credible interval [CrI]: 36.3, 42.1). The body region with the highest point prevalence was the knee. The 12-month period prevalence of RRIs was 69.2 % (95 %CrI: 66.4, 72.0). The body region with the highest 12-month period prevalence was the lower leg. 1- and 12-month period prevalence of cramps was 19.5 % (95 %CrI: 17.1, 21.9) and 36.0 % (95 %CrI: 33.0, 38.8), respectively. Triceps surae was the muscle most affected by cramps.
ConclusionsTwo in 5 (40 %) trail runners reported being injured at the time of data collection, and about 2 of 3 reported previous RRIs in the last 12 months. The most prevalent injured body regions were the knee and the lower leg. One in 5 trail runners reported cramps in the last month, increasing to 36 % in the last 12 months. Knowing better the characteristics of the population and the burden of health conditions may inform better decisions regarding implementation actions toward trail running practice.
Since the mid-1990s, trail running has been attracting practitioners and is recognised as an athletics modality by World Athletics.1 The International Trail Running Association (ITRA) defines trail running as “a run in a natural environment (mountain, desert, forest) with a minimum of paved roads (must not exceed 20 % of the total route)”.2 The distances and the unevenness (the difference in altitude between the start and the finish line) vary substantially within the sport.3 In the United States, the number of trail runners grew from approximately 4.8 million in 2009 to 9.1 million in 2017.4 The Brazilian Athletics Confederation (CBAt) officially regulated trail running in 2017.5
Associating physical activity and the natural environment, such as trail running, has been reported as a way to maintain physical and mental health.6 Trail running is practiced in natural environments which involves variations in terrain. Therefore, the trail runner deals all the time with biomechanical adaptations during ascents and descents and irregular surfaces.3,7 Thus, the practice of trail running has an inherent risk of developing injuries.
Some studies have shown the prevalence of running-related injuries (RRI) in trail runners.8–10 For instance, the mean 2-week period prevalence of RRIs in Dutch trail runners was 22.4 % (95 % confidence interval [CI]: 20.9, 24.0).11 The point prevalence of RRIs in trail runners was 1.3 % in a study conducted in South Africa.12 Researchers analysed data from five seasons (between 2015 and 2019) of 20–42 km trail running races and reported 1.6 RRIs per 1000 h of running.13 Previous history of RRIs and/or cramps is associated with an increased risk of developing such health conditions during trail running events, which could lead to withdrawing of the trail runner from the race.2
Knowledge about the injuries affecting sports and society helps in the development of risk control and prevention strategies. For example, a group of researchers measured the burden of RRIs, including the prevalence (i.e., 22.4 % [95 % CI: 20.9, 24.0]), in Dutch trail runners.11 The knowledge gathered from this study served as a basis for the recommendation and rationale for the development of a specific RRI prevention programme tailored to this populations.14,15
The objectives of this study in Brazilian trail runners were: (1) to investigate the point prevalence of RRIs; (2) to describe the most common injured body regions; (3) to investigate the period prevalence of cramps; (4) to describe the most common body regions affected by cramps; (5) to describe the personal and training characteristics; and (6) to investigate the history of previous RRIs.
MethodsParticipants and sample sizeThe sample was composed of Brazilian trail runners, aged 18 or over, and with at least six months of trail running experience. Calls for participation in the study was disseminated through social media (i.e., Facebook, Instagram, Twitter, and WhatsApp) with messages explaining the aims of the study, and with the link to access the online questionnaire. The recruitment was also done in trail running events (for all levels of trail runners), through the distribution of flyers containing a ‘quick response’ (QR) code and the link to the online questionnaire. The QR code and the link to the questionnaire directed the participant to the online informed consent. Individuals who did not agree to participate in the study were not included in the study.
The a priori sample size estimation was based on previous studies that investigated the prevalence of RRIs in Dutch trail runners.11 With a point prevalence reference value of 0.22 (22 %), with a margin of error of 0.03 (3 %), probability of type 1 error (α) of 0.05, probability of type 2 error (β) of 0.2 (ie, power of 0.8 or 80 %), a sample of at least 733 participants was suggested for the primary outcome of this study, that is, determining the point prevalence of RRIs.11
Study design and data collectionThis was an observational cross-sectional study conducted between April 2019 and February 2020 in Brazil. This study was approved by the Research Ethics Committee of Universidade Cidade de São Paulo (UNICID), Brazil (protocol CAAE: 00,455,018.0.0000.5377). Data collection was performed through an online questionnaire built on the Typeform® platform.
The questionnaire was built based on previous studies,11,16 it was entirely self-reported, and it was composed of four parts. Part 1 queried information about personal data, such as age, sex, body mass, height, and educational level. Part 2 was composed of questions regarding training characteristics, such as number of training sessions per week, average weekly mileage, average time per kilometer, and practice of other sports. Part 3 was composed of questions regarding current presence of trail RRIs to determine the point prevalence of injuries at the time of data collection (i.e., at the very moment when the participant was answering the online questionnaire), the affected body regions that were self-reported through options derived from a previous study,14 and consequences of RRIs injuries, such as training time loss and medical attention. We also asked about the occurrence of cramps in the last month to determine the 1-month period prevalence of cramps and the body regions affected by cramps in an open-ended question. Part 4 was composed of questions regarding the previous history of trail RRIs to determine the period prevalence in the last 12 months, the body region of such injuries, and the training time loss and/or medical attention related to previous RRIs. We also asked about the occurrence of cramps in the last 12 months to determine the 12-month period prevalence of cramps and the body regions affected by cramps in an open-ended question.
Definition of trail running-related injuriesWhen considering previous definitions of RRIs reported in the literature, and to facilitate comparisons among studies, the following definitions were used in this study: (A) based on a study of Dutch trail runners, RRI was defined as “any disturbance of the musculoskeletal system that the runner attributes to the practice of running (training or competition)”11; (B) the time loss definition was based on missing or reducing training for three consecutive training sessions or not training at all for one week; and (C) the medical attention definition was based on seeking consultation with medical professionals, physical therapists, or other health professionals.11,17
Data analysisThe data of this study were analysed and summarised with descriptive statistics. Continuous data with evidence of belonging to a Gaussian distribution were described using mean and standard deviation (SD). Continuous non-parametric and discrete data were described using the median and 25 % to 75 % interquartile range (IQR). The dichotomous and categorical data were summarised with proportions and frequency distributions (n), and they were normalised and reported in percentages ( %). Bayesian inference was performed to provide evidence of the population distribution (i.e., posterior distribution) of the outcomes based on the data collected. The posterior distributions were summarised with means and 95 % Bayesian highest posterior density credible intervals (CrI).18 All analyses were performed in R version 4.0.5.19
A Gaussian model with unknown variance was implemented for continuous data with evidence of belonging to a Gaussian distribution.20 A Gaussian non-informative prior with mean=0 and variance=1e6 hyperparameters was used for means, and an inverse-Gamma with shape=1 and scale=1 hyperparameters was used for variance.21 Gibbs sampling were applied to obtained the marginal posterior distributions for mean and variance components of the Gaussian models with unknown variances, and the results were summarised using five chains and 20,000 iterations after disregarding the initial 5000 iterations for each chain (i.e., 100,000 samples).22
A Gamma–Gamma model was implemented for continuous non-parametric and discrete data using a non-informative prior with hyperparameters α=1/3 and β=1/1e6.23 A Beta-Binomial model was implemented for dichotomous and categorical data using a non-informative prior with hyperparameters α=1/3 and β=1/3.24 For the Gamma–Gamma and the Beta–Binomial models, the posterior distributions were summarised by sampling 100,000 samples directly from the posterior distributions.
ResultsA total of 2491 people accessed the online questionnaire with 1219 people (48.9 %) submitting responses. Only 2 people (0.2 %) did not consent to participate and, therefore, were not presented with the full questionnaire (i.e., parts 1 to 4). Forty-five people (3.7 %) were not eligible, because of less than six months of trail running experience. A total of 104 responses (8.9 %) were removed because they were duplicates.
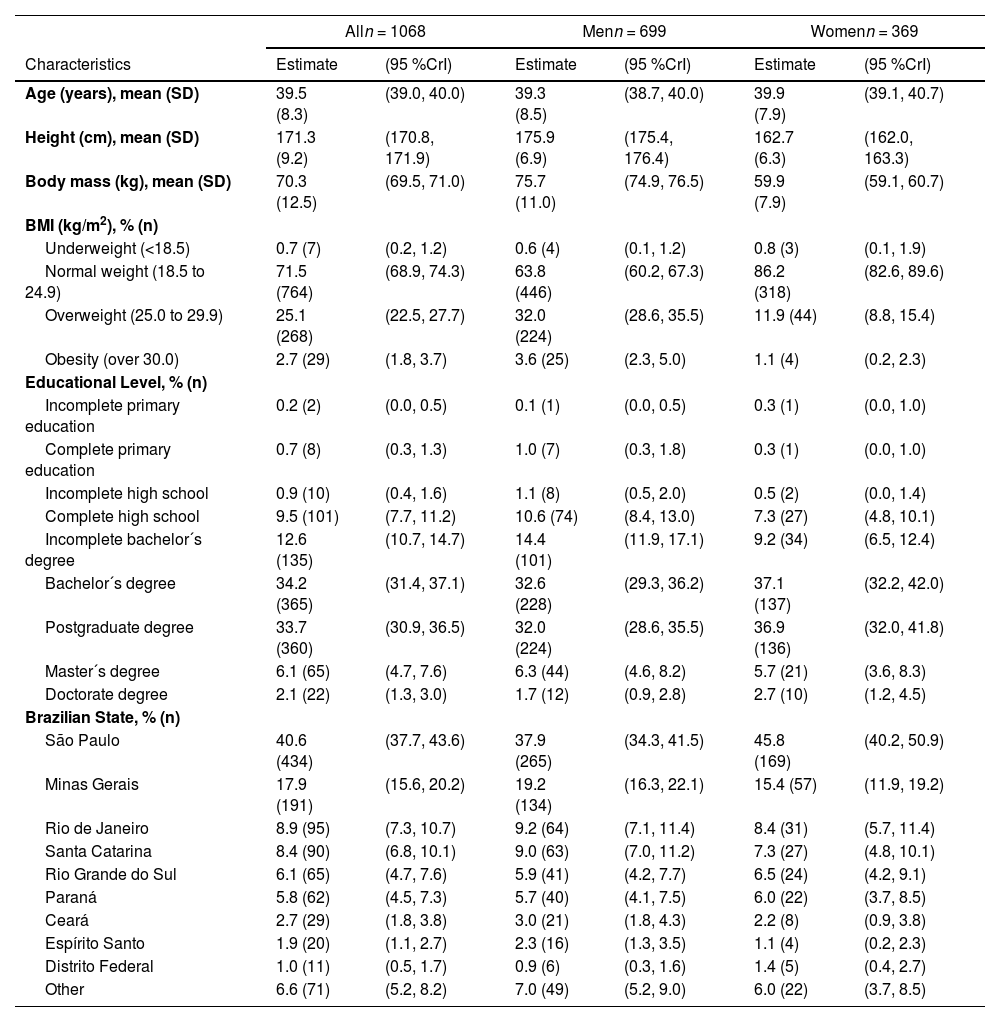
In total, 1068 Brazilian trail runners were included in this study. The average time to complete the online questionnaire was 14:41 min (IQR: 8:31, 14:44). Table 1 describes the personal characteristics of the participants. The mean age of the participants was 39.5 (95 %CrI: 39.0, 40.0). A total of 34.6 % (95 %CrI: 31.7, 37.4; n = 369) were women and 65.4 % (95 %CrI: 62.6, 68.3; n = 699) were men. Most of the trail runners presented a normal body mass index (BMI) (i.e., 18.5≤BMI≤24.9: 71.5 %; 95 %CrI: 68.9, 74.3; n = 764). A total of 76.0 % (95 %CrI: 73.4, 78.5; n = 812) had a higher education degree.
Personal characteristics of Brazilian trail runners.
bBMI, body mass index; CrI, Bayesian credible interval; SD, standard deviation.
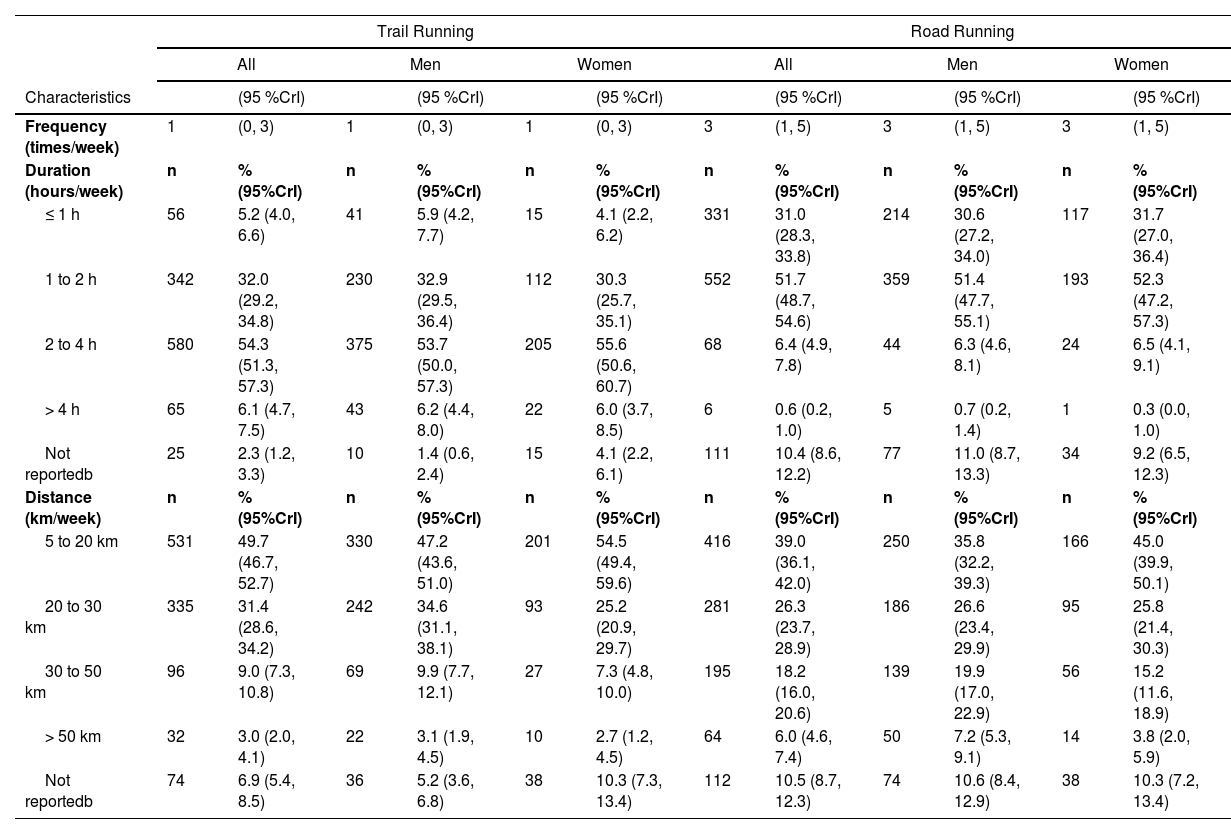
Before starting to run on trails, 85.1 % (95 %CrI: 83.0, 87.2; n = 909) of the participants reported to running on roads. On average, Brazilian trail runners reported to run 1 time per week on trails (95 %CrI 0, 3); 54.3 % (95 %CrI: 51.3, 57.3; n = 580) of them reported to run between 2 and 4 h per week on trails; and 49.7 % (95 %CrI: 46.7, 52.7; n = 531) reported to run between 5 and 20 km per week on trails (Table 2).
Running exposure of Brazilian trail runners.
CrI, Bayesian credible interval.
bSome trail runners preferred not to report.
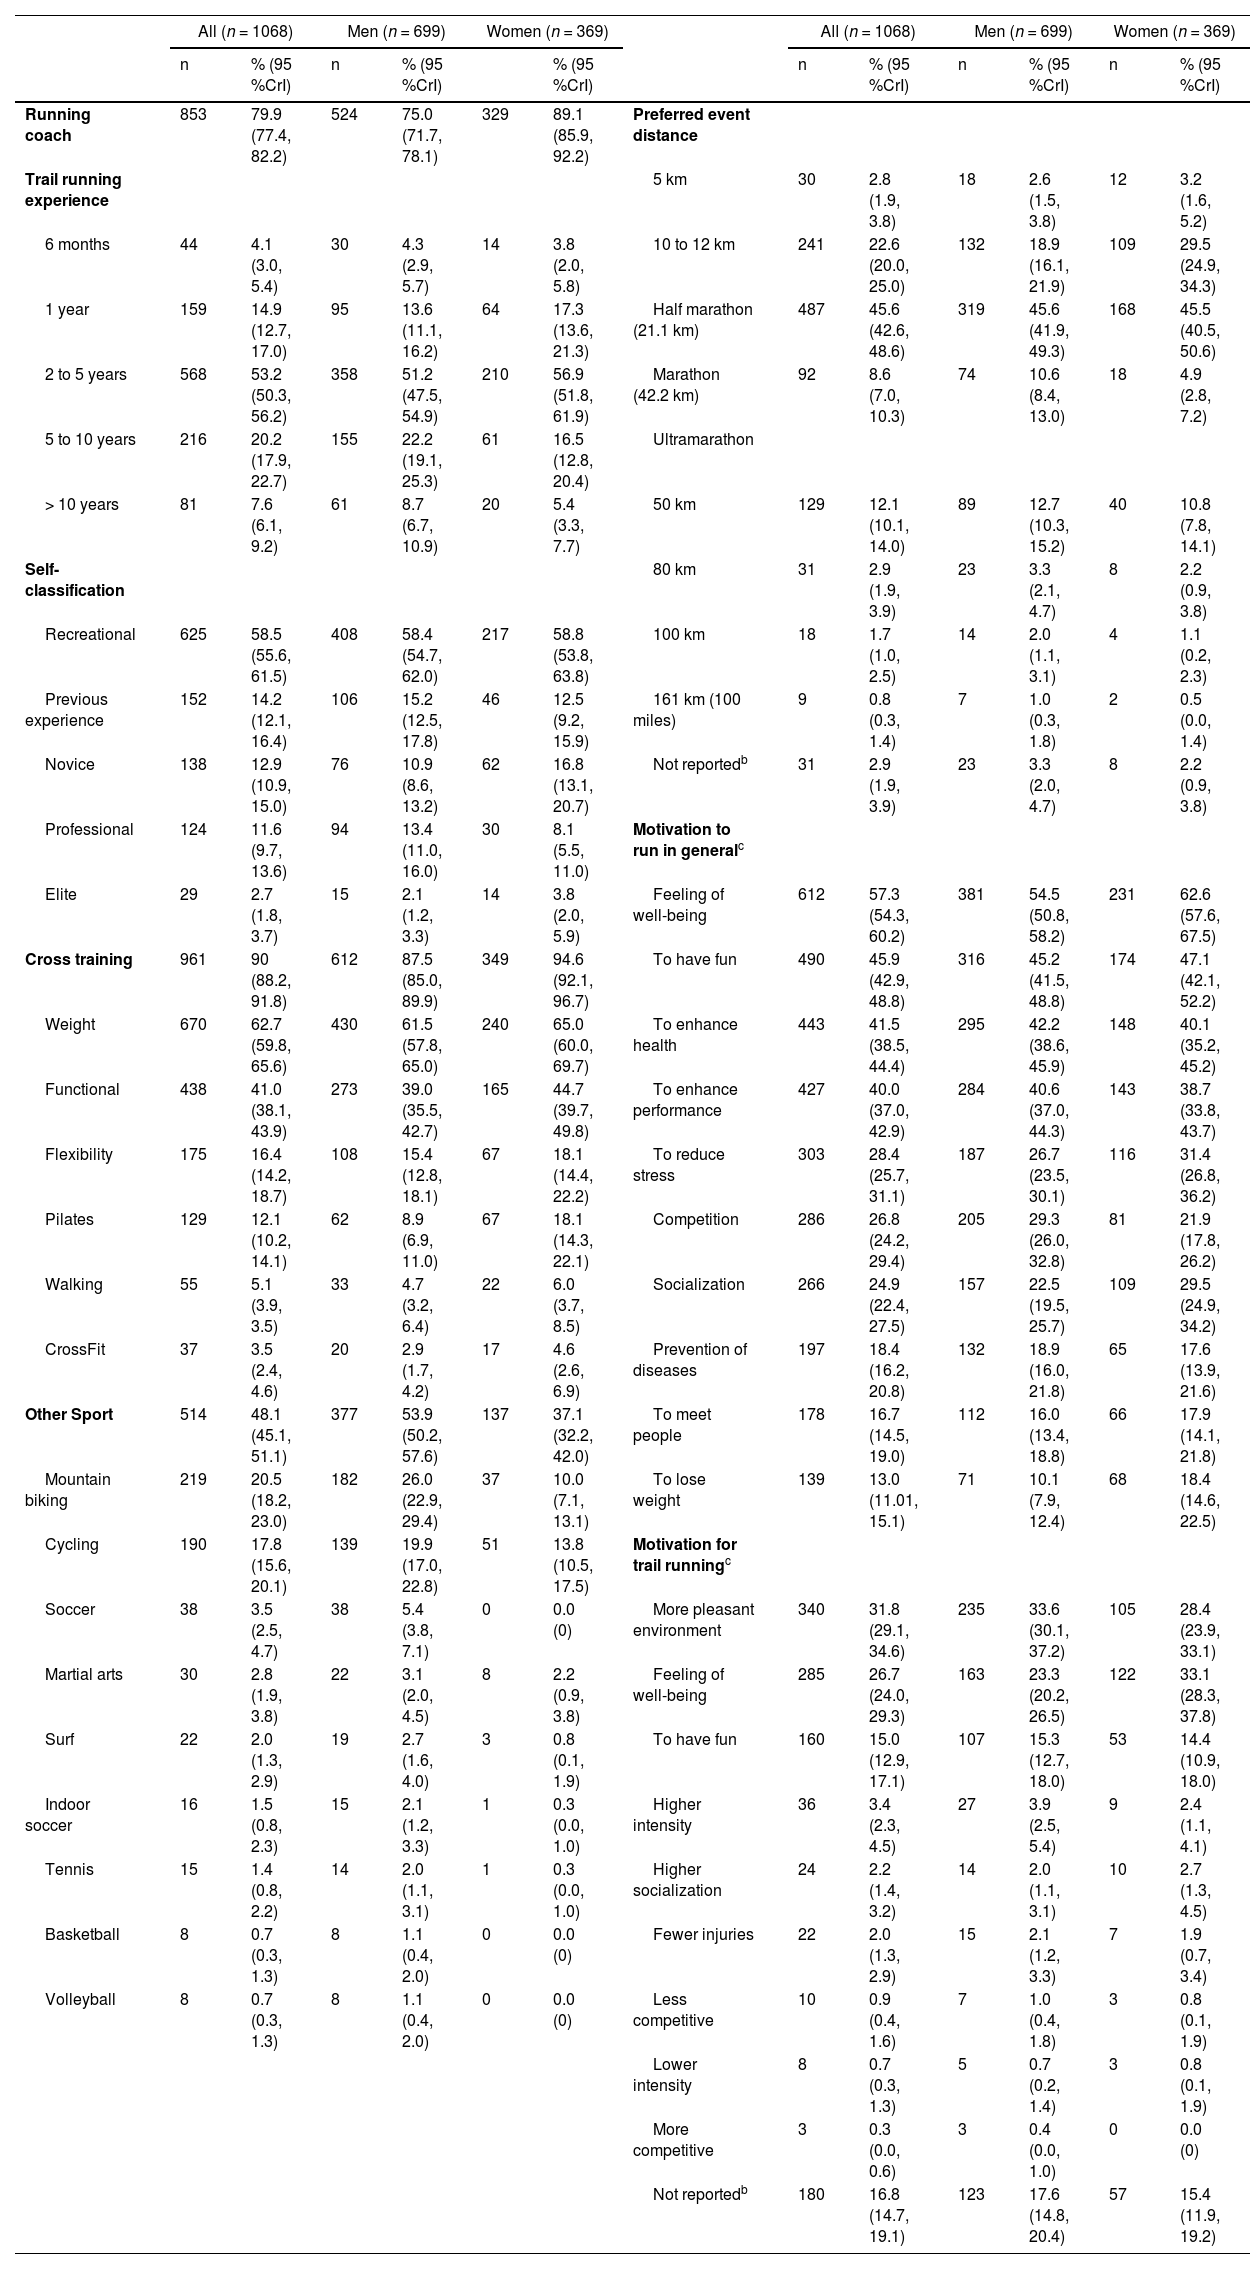
Most of the participants reported trail running experience between 2 and 5 years (53.2 %; 95 %CrI: 50.3, 56.2; n = 568), and the preferred distance related to participating in running events was the half marathon (45.6 %; 95 %CrI: 42.6, 48.6; n = 487) (Table 3). A total of 58.5 % (95 %CrI: 55.6, 61.5; n = 625) of the participants classified themselves as being recreational runners (Table 3). The main motivations to run in general (on and off trails) reported by the participants were: ‘feeling of well-being’; ‘to have fun’; ‘to enhance health’; and ‘to enhance performance’ (Table 3).
Trail running characteristics of Brazilian trail runners.
| All (n = 1068) | Men (n = 699) | Women (n = 369) | All (n = 1068) | Men (n = 699) | Women (n = 369) | ||||||||
|---|---|---|---|---|---|---|---|---|---|---|---|---|---|
| n | % (95 %CrI) | n | % (95 %CrI) | % (95 %CrI) | n | % (95 %CrI) | n | % (95 %CrI) | n | % (95 %CrI) | |||
| Running coach | 853 | 79.9 (77.4, 82.2) | 524 | 75.0 (71.7, 78.1) | 329 | 89.1 (85.9, 92.2) | Preferred event distance | ||||||
| Trail running experience | 5 km | 30 | 2.8 (1.9, 3.8) | 18 | 2.6 (1.5, 3.8) | 12 | 3.2 (1.6, 5.2) | ||||||
| 6 months | 44 | 4.1 (3.0, 5.4) | 30 | 4.3 (2.9, 5.7) | 14 | 3.8 (2.0, 5.8) | 10 to 12 km | 241 | 22.6 (20.0, 25.0) | 132 | 18.9 (16.1, 21.9) | 109 | 29.5 (24.9, 34.3) |
| 1 year | 159 | 14.9 (12.7, 17.0) | 95 | 13.6 (11.1, 16.2) | 64 | 17.3 (13.6, 21.3) | Half marathon (21.1 km) | 487 | 45.6 (42.6, 48.6) | 319 | 45.6 (41.9, 49.3) | 168 | 45.5 (40.5, 50.6) |
| 2 to 5 years | 568 | 53.2 (50.3, 56.2) | 358 | 51.2 (47.5, 54.9) | 210 | 56.9 (51.8, 61.9) | Marathon (42.2 km) | 92 | 8.6 (7.0, 10.3) | 74 | 10.6 (8.4, 13.0) | 18 | 4.9 (2.8, 7.2) |
| 5 to 10 years | 216 | 20.2 (17.9, 22.7) | 155 | 22.2 (19.1, 25.3) | 61 | 16.5 (12.8, 20.4) | Ultramarathon | ||||||
| > 10 years | 81 | 7.6 (6.1, 9.2) | 61 | 8.7 (6.7, 10.9) | 20 | 5.4 (3.3, 7.7) | 50 km | 129 | 12.1 (10.1, 14.0) | 89 | 12.7 (10.3, 15.2) | 40 | 10.8 (7.8, 14.1) |
| Self-classification | 80 km | 31 | 2.9 (1.9, 3.9) | 23 | 3.3 (2.1, 4.7) | 8 | 2.2 (0.9, 3.8) | ||||||
| Recreational | 625 | 58.5 (55.6, 61.5) | 408 | 58.4 (54.7, 62.0) | 217 | 58.8 (53.8, 63.8) | 100 km | 18 | 1.7 (1.0, 2.5) | 14 | 2.0 (1.1, 3.1) | 4 | 1.1 (0.2, 2.3) |
| Previous experience | 152 | 14.2 (12.1, 16.4) | 106 | 15.2 (12.5, 17.8) | 46 | 12.5 (9.2, 15.9) | 161 km (100 miles) | 9 | 0.8 (0.3, 1.4) | 7 | 1.0 (0.3, 1.8) | 2 | 0.5 (0.0, 1.4) |
| Novice | 138 | 12.9 (10.9, 15.0) | 76 | 10.9 (8.6, 13.2) | 62 | 16.8 (13.1, 20.7) | Not reportedb | 31 | 2.9 (1.9, 3.9) | 23 | 3.3 (2.0, 4.7) | 8 | 2.2 (0.9, 3.8) |
| Professional | 124 | 11.6 (9.7, 13.6) | 94 | 13.4 (11.0, 16.0) | 30 | 8.1 (5.5, 11.0) | Motivation to run in generalc | ||||||
| Elite | 29 | 2.7 (1.8, 3.7) | 15 | 2.1 (1.2, 3.3) | 14 | 3.8 (2.0, 5.9) | Feeling of well-being | 612 | 57.3 (54.3, 60.2) | 381 | 54.5 (50.8, 58.2) | 231 | 62.6 (57.6, 67.5) |
| Cross training | 961 | 90 (88.2, 91.8) | 612 | 87.5 (85.0, 89.9) | 349 | 94.6 (92.1, 96.7) | To have fun | 490 | 45.9 (42.9, 48.8) | 316 | 45.2 (41.5, 48.8) | 174 | 47.1 (42.1, 52.2) |
| Weight | 670 | 62.7 (59.8, 65.6) | 430 | 61.5 (57.8, 65.0) | 240 | 65.0 (60.0, 69.7) | To enhance health | 443 | 41.5 (38.5, 44.4) | 295 | 42.2 (38.6, 45.9) | 148 | 40.1 (35.2, 45.2) |
| Functional | 438 | 41.0 (38.1, 43.9) | 273 | 39.0 (35.5, 42.7) | 165 | 44.7 (39.7, 49.8) | To enhance performance | 427 | 40.0 (37.0, 42.9) | 284 | 40.6 (37.0, 44.3) | 143 | 38.7 (33.8, 43.7) |
| Flexibility | 175 | 16.4 (14.2, 18.7) | 108 | 15.4 (12.8, 18.1) | 67 | 18.1 (14.4, 22.2) | To reduce stress | 303 | 28.4 (25.7, 31.1) | 187 | 26.7 (23.5, 30.1) | 116 | 31.4 (26.8, 36.2) |
| Pilates | 129 | 12.1 (10.2, 14.1) | 62 | 8.9 (6.9, 11.0) | 67 | 18.1 (14.3, 22.1) | Competition | 286 | 26.8 (24.2, 29.4) | 205 | 29.3 (26.0, 32.8) | 81 | 21.9 (17.8, 26.2) |
| Walking | 55 | 5.1 (3.9, 3.5) | 33 | 4.7 (3.2, 6.4) | 22 | 6.0 (3.7, 8.5) | Socialization | 266 | 24.9 (22.4, 27.5) | 157 | 22.5 (19.5, 25.7) | 109 | 29.5 (24.9, 34.2) |
| CrossFit | 37 | 3.5 (2.4, 4.6) | 20 | 2.9 (1.7, 4.2) | 17 | 4.6 (2.6, 6.9) | Prevention of diseases | 197 | 18.4 (16.2, 20.8) | 132 | 18.9 (16.0, 21.8) | 65 | 17.6 (13.9, 21.6) |
| Other Sport | 514 | 48.1 (45.1, 51.1) | 377 | 53.9 (50.2, 57.6) | 137 | 37.1 (32.2, 42.0) | To meet people | 178 | 16.7 (14.5, 19.0) | 112 | 16.0 (13.4, 18.8) | 66 | 17.9 (14.1, 21.8) |
| Mountain biking | 219 | 20.5 (18.2, 23.0) | 182 | 26.0 (22.9, 29.4) | 37 | 10.0 (7.1, 13.1) | To lose weight | 139 | 13.0 (11.01, 15.1) | 71 | 10.1 (7.9, 12.4) | 68 | 18.4 (14.6, 22.5) |
| Cycling | 190 | 17.8 (15.6, 20.1) | 139 | 19.9 (17.0, 22.8) | 51 | 13.8 (10.5, 17.5) | Motivation for trail runningc | ||||||
| Soccer | 38 | 3.5 (2.5, 4.7) | 38 | 5.4 (3.8, 7.1) | 0 | 0.0 (0) | More pleasant environment | 340 | 31.8 (29.1, 34.6) | 235 | 33.6 (30.1, 37.2) | 105 | 28.4 (23.9, 33.1) |
| Martial arts | 30 | 2.8 (1.9, 3.8) | 22 | 3.1 (2.0, 4.5) | 8 | 2.2 (0.9, 3.8) | Feeling of well-being | 285 | 26.7 (24.0, 29.3) | 163 | 23.3 (20.2, 26.5) | 122 | 33.1 (28.3, 37.8) |
| Surf | 22 | 2.0 (1.3, 2.9) | 19 | 2.7 (1.6, 4.0) | 3 | 0.8 (0.1, 1.9) | To have fun | 160 | 15.0 (12.9, 17.1) | 107 | 15.3 (12.7, 18.0) | 53 | 14.4 (10.9, 18.0) |
| Indoor soccer | 16 | 1.5 (0.8, 2.3) | 15 | 2.1 (1.2, 3.3) | 1 | 0.3 (0.0, 1.0) | Higher intensity | 36 | 3.4 (2.3, 4.5) | 27 | 3.9 (2.5, 5.4) | 9 | 2.4 (1.1, 4.1) |
| Tennis | 15 | 1.4 (0.8, 2.2) | 14 | 2.0 (1.1, 3.1) | 1 | 0.3 (0.0, 1.0) | Higher socialization | 24 | 2.2 (1.4, 3.2) | 14 | 2.0 (1.1, 3.1) | 10 | 2.7 (1.3, 4.5) |
| Basketball | 8 | 0.7 (0.3, 1.3) | 8 | 1.1 (0.4, 2.0) | 0 | 0.0 (0) | Fewer injuries | 22 | 2.0 (1.3, 2.9) | 15 | 2.1 (1.2, 3.3) | 7 | 1.9 (0.7, 3.4) |
| Volleyball | 8 | 0.7 (0.3, 1.3) | 8 | 1.1 (0.4, 2.0) | 0 | 0.0 (0) | Less competitive | 10 | 0.9 (0.4, 1.6) | 7 | 1.0 (0.4, 1.8) | 3 | 0.8 (0.1, 1.9) |
| Lower intensity | 8 | 0.7 (0.3, 1.3) | 5 | 0.7 (0.2, 1.4) | 3 | 0.8 (0.1, 1.9) | |||||||
| More competitive | 3 | 0.3 (0.0, 0.6) | 3 | 0.4 (0.0, 1.0) | 0 | 0.0 (0) | |||||||
| Not reportedb | 180 | 16.8 (14.7, 19.1) | 123 | 17.6 (14.8, 20.4) | 57 | 15.4 (11.9, 19.2) | |||||||
CrI, Bayesian credible interval.
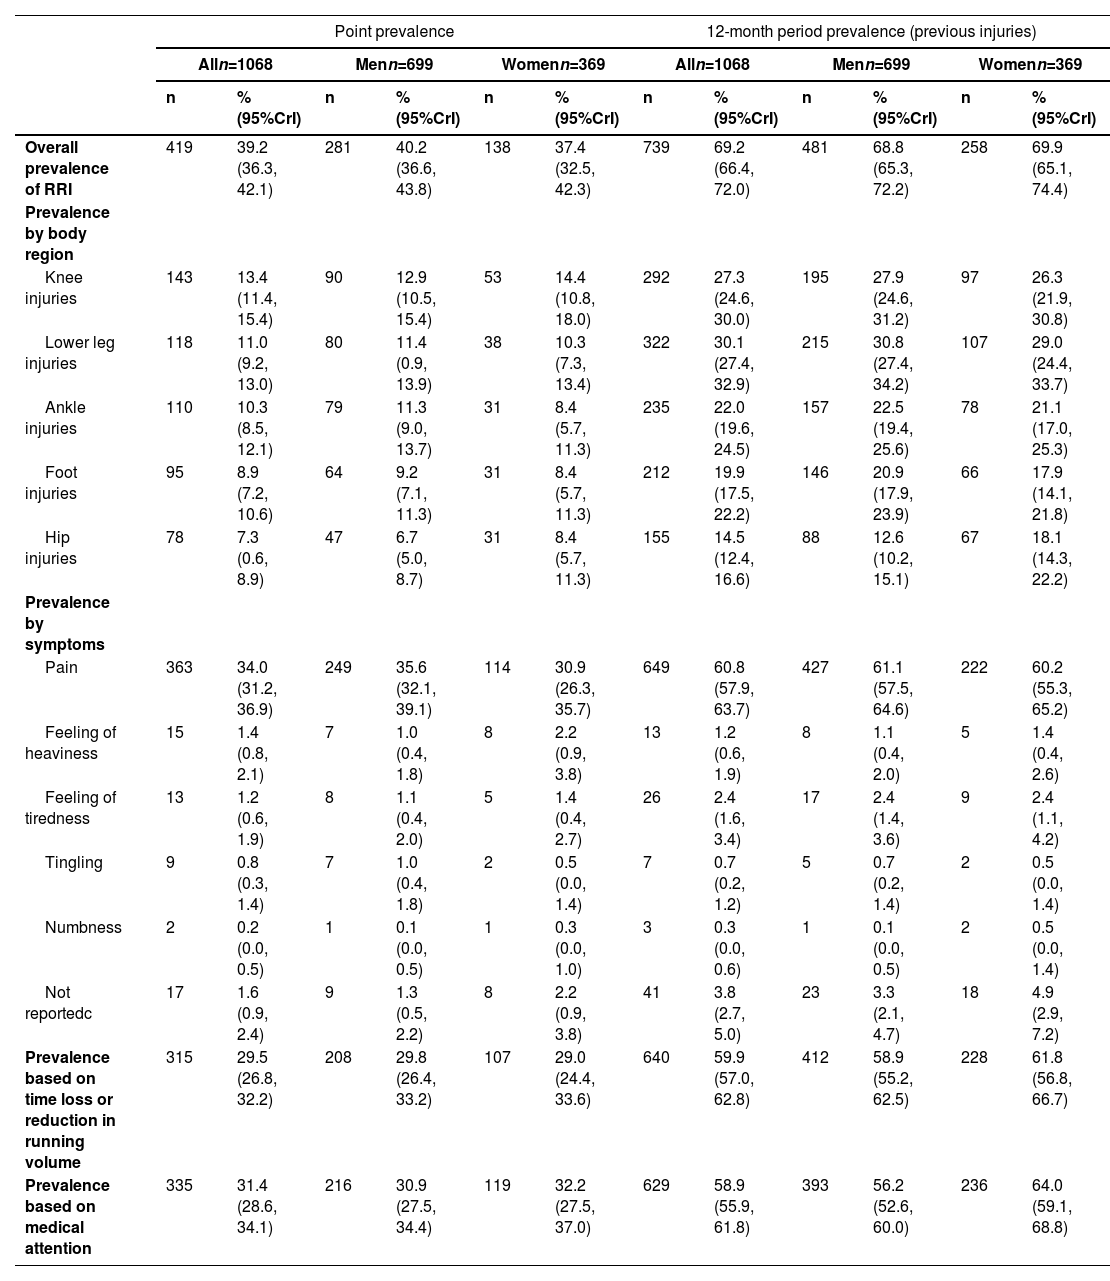
A total of 544 RRIs were reported by 419 injured trail runners. The point prevalence of RRIs was 39.2 % (95 %CrI: 36.3, 42.1; n = 419) (Table 4). About 75.2 % (95 %CrI: 71.1, 79.3; n = 315) of the injured trail runners reported training time loss or a reduction in training volume, while 80.0 % (95 %CrI: 76.0, 83.6; n = 335) required medical attention due to RRIs (Supplementary Online Material Table S1). Regarding the characteristics of the symptoms related to the current RRIs, pain (n = 363) was the main symptom, with a prevalence of 34.0 % (95 %CrI: 31.2, 36.9) and representing 86.6 % (95 %CrI: 83.2, 89.7) of the symptoms reported by injured trail runners (Supplementary Online Material Table S1).
RRI characteristics in Brazilian trail runners.
CrI, Bayesian credible interval; RRI, running-related injury.
cSome trail runners preferred not to report.
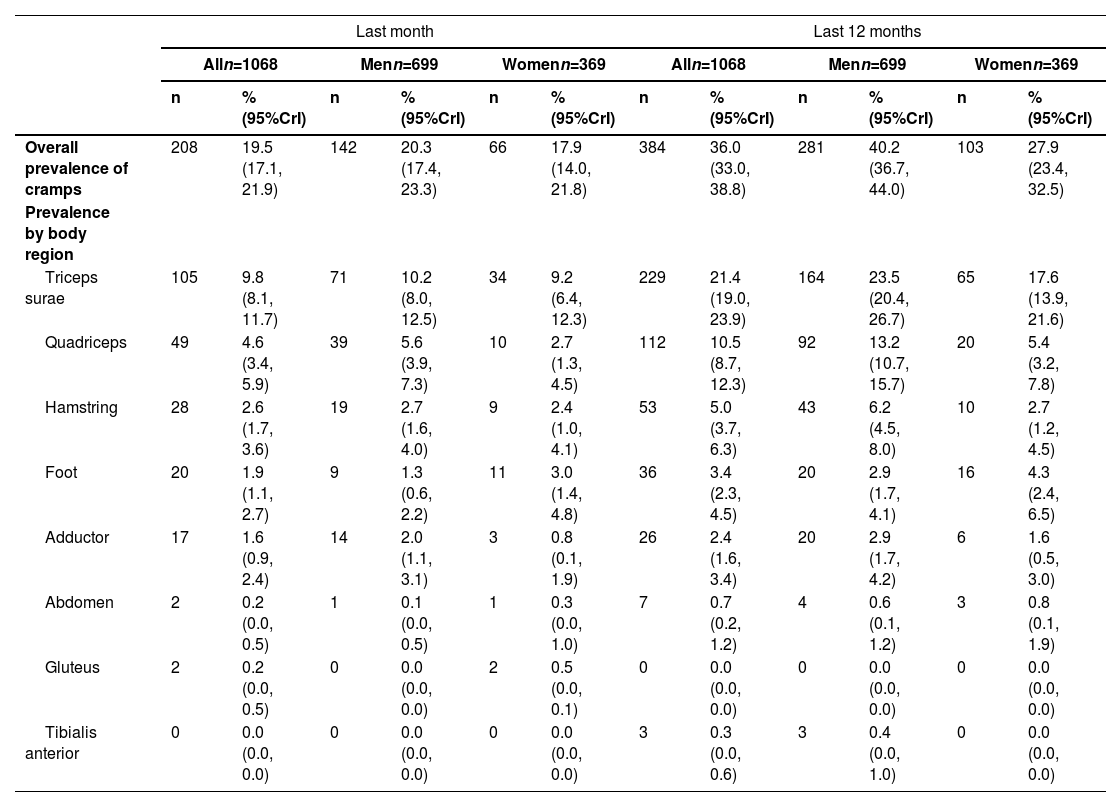
The prevalence of cramps in the last month was 19.5 % (95 %CrI: 17.1, 21.9; n = 208) and the prevalence of previous cramps (last 12 months) was 36.0 % (95 %CrI: 33.0, 38.8; n = 384) (Table 5). The locations of cramps in the last month and in the last 12 months can be found in Table 5 (prevalences) and Supplementary Online Material Table S2 (distribution in injured trail runners).
Prevalence and location of cramps.
CrI, Bayesian credible interval.
Most Brazilian trail runners were men (65.4 %; 95 %CrI: 62.6, 68.3; n = 699) and had trail running experience between 2 and 5 years (53.2 %, 95 %CrI: 50.3, 56.2; n = 568). Regarding exposure to trail running, participants reported running on average 1 time per week on trails (95 %CrI: 0, 3), 2 to 4 h/week (54.3 %; 95 %CrI: 51.3, 57.3; n = 580), and 5 to 20 km/week (49.7 %; 95 %CrI: 46.7, 52.7; n = 531). The overall point prevalence of injuries related to trail running was 39.2 % (95 %CrI: 36.3, 42.2; n = 419), with the knee being the most affected site with a point prevalence of 13.4 % (95 %CrI: 11.4, 15.4; n = 143).
The results of our study showed a point prevalence of trail RRIs of 39.2 % (95 %CrI: 36.3, 42.2). The estimate found in our study was higher than the findings of a prospective study in Dutch trail runners (22.4 %, 95 %CI: 20.9, 24.0).11 A possible explanation for this discrepancy is that the studies had a different design; while our study had a cross-sectional design, the Dutch study had a prospective longitudinal repeated-measurements design. Also, the point prevalence of trail RRIs in South Africa was 1.3 %.12 In this South African study, runners answered the questionnaire two weeks before competitions, and according to the authors, this may explain the low point prevalence, because runners could be prevented from running the race if they reported health problems.12 The prevalence of trail RRIs ranged from 1.3 % to 90 % in a systematic review.9 This large variation may be a consequence of studies using different designs and definitions of injury, according to the authors.9
Regarding the anatomical region affected by RRIs, similar findings were reported in road running, with the knee being the most frequently affected site.25 Trail running factors related to knee overload may partly explain these findings, such as uphill, downhill, uneven terrain, and change directions. In addition, during ultra-trail races (common type of competition in trail running), runners experience high levels of fatigue, as demonstrated in previous studies.26 Fatigue can result in kinematics changes of the knee, contributing to joint overload.27 In a systematic review on the epidemiology of injuries and diseases among trail runners, the foot was the most affected site of injuries.2 This systematic review also presented data on dermatological lesions and gastrointestinal symptoms, common in trail running events.2 The authors speculated that, perhaps, the foot was the most affected site of injuries because there were many blisters and skin lesions on the feet and, then, this finding may have been overestimated.2 Our study focused only on the point prevalence of musculoskeletal injuries of the lower limb during training exposure, which might explain the discrepancy compared to the aforementioned review.
Brazilian trail runners reported cramps in the last month (having the time of data collection as reference) mainly in the triceps surae and quadriceps. Cramps are common medical conditions during ultramarathon trail races.28 Athletes who experience excessive fatigue or cramps during races should seek medical attention for evaluation, avoiding the risk of musculoskeletal injuries.28 Therefore, monitoring cramps in trail runners seems to be a fundamental aspect to compose the evaluation and the surveillance of the health, training, and performance of trail runners.
A nationwide study in Brazil with runners in general (i.e., not specifically trail or road runners) showed a higher proportion of male runners (71.4 %) compared to female runners (28.6 %), corroborating our results.29 The authors of the nationwide study hypothesised that perhaps Brazilian women have a preference for other exercises than running, because the proportion of female exercisers, excluding runners, was actually reverse (i.e., higher proportion of female non-runner-exercisers [56.2 %] compared to male non-runner-exercisers [43.8 %]).29 The proportion of women found in our study (34.5 %) was higher compared to a systematic review on trail running injury risk factors (15.8 %).2 In our study, women reported that trail running promotes a greater sense of well-being and has a more pleasant environment when compared to road running.
Brazilian trail runners trained, on average, 3 times/week on road tracks (paved surfaces). This corroborates our a priori hypothesis that trail runners do not train only on trails, as reported by Hespanhol Junior et al.11 However, a cross-sectional study investigating injuries in the 2019 Skyrun race reported that trail tracks was the most often training surface (76.5 % on trails followed by 55.8 % on tarred/paved surfaces).12 The difference in these findings can be explained by the difficulty of access to trails by Brazilian runners who, usually, live in metropolitan areas. In addition, culturally in Brazil training on flat and paved terrains is adopted by most running coaches, and it is part of the preparation to run on trails.
Strengths and limitations of the studyTo our knowledge, this was the first study to describe demographic, training, and RRIs in trail runners in Brazil. The study presented a significant sample size considering that the total population of trail runners in Brazil is smaller than the population of runners in general, which is estimated at 2.5 % of the Brazilian population (i.e., ≈5,300,000).29 Considering that around 5 % of the general population of runners may be trail runners, the sample of this study (n = 1068) would represent around 0.4 % of the trail runner population in Brazil (i.e., ≈265,000).
A limitation of this study was the self-reported nature of the data collected, which may have increased the risk of bias related to the accuracy of the data. For example, the participants may have had difficulties in reporting the body region and the type of injury. Some data were collected asking retrospective questions (e.g., previous injuries), which may have increased the risk of recall bias.
PerspectivesThis study may be used in practice and in science as a source of information regarding the characteristics of trail running practice in Brazil. This information may serve as a baseline for hypotheses generation and for supporting informed decision-making regarding trail running. Specifically for research, this study may support, stimulate, and justify the conduct of prospective studies with regards to monitoring health and practice characteristics over time, and their relationship with the benefits and drawbacks of trail running (e.g., the development of trail RRIs). Specifically for practice, this study may help physical therapists, other health professionals, coaches, and managers to understand the profile of trail runners in Brazil, informing better decisions and the implementation of actions related to trail running practice (e.g., training and competitions), and managing injuries related to this practice.
ConclusionsThe point prevalence of RRIs in Brazilian trail runners was about 40 %. Almost 70 % of runners reported previous RRIs in the last 12 months. The last month period prevalence of cramps was about 20 %, while the 12-month period prevalence was 36 %. The triceps surae was the muscle most affected by cramps, representing more than 50 % and almost 60 % in the last month and in the last 12 months, respectively.
TransparencyThe authors affirm that the manuscript is an honest, accurate, and transparent account of the study being reported. No important aspects of the study have been omitted. Any discrepancies from the study as planned have been explained.
Data sharing statementData are available upon reasonable request to LH (corresponding author). De-identified participant data might be available after the consent of all authors and the privacy policy of the Research Ethics Committee of the Universidade Cidade de São Paulo (UNICID).
Luiz Hespanhol received a Young Investigator Grant from the Sao Paulo Research Foundation (FAPESP), grant 2016/09220–1, and a Research Productivity Fellowship (PQ) from the National Council for Scientific and Technological Development – Brazil (CNPq), process 310943/2023–0.


