


Para athletes experience high prevalence, incidence, and burden of health problems related to sport.
ObjectivesTo assess the prevalence, incidence, severity, and burden of injuries and illnesses in Para athletes throughout one year and to compare the prevalence of these health conditions across four sports.
MethodsData were collected from January to December 2022 at two Brazilian Paralympic Reference Centers. Para athletes from swimming, athletics, powerlifting, and taekwondo were included. The OSTRCH2 Questionnaire was used to record injuries and illnesses weekly for one year. Injury and illness prevalence, incidence, severity scores, and burden were calculated. A one-way ANOVA compared the prevalence of health problems among the four sports.
ResultsIn total, 102 Para athletes participated in this study (77 males, 25 females). Six hundred and twelve health problems (453 injuries and 159 illnesses) were reported. The prevalence of injuries was 31.8 % (95 % CI: 28.2, 35.3), and the prevalence of illnesses was 7.9 % (95 % CI: 7.0, 8.9). Taekwondo had the highest prevalence of injuries (44.9 %). The mean incidence rate of sudden-onset injuries was 9.9 per 1000 athlete hours, with taekwondo also exhibiting the highest rates. Injuries to the shoulder complex, followed by the ankle and knee, had the greatest burdens. Powerlifting exhibited the highest burden of injuries.
ConclusionDuring the one year season, Para athletes experienced high injury rates and burdens, with severe impacts observed especially in taekwondo and powerlifting. Para athletics had a high prevalence of illnesses. These findings emphasize the need to develop injury prevention strategies tailored to the specific characteristics of each sport.
Longitudinal studies show that Para athletes experience high rates of injury and illness, partly due to pre-existing medical conditions and the demands of high-performance sports.1–5 Most longitudinal studies1,2,4,5 have been conducted in high-income countries with well-established social support systems. In contrast, emerging economies with high levels of inequality, such as Brazil, lack adequate sports, infrastructure, and health support.6,7 A systematic review8 demonstrated that resource limitations and limited access to quality medical services contribute to the high rates of health problems among Para athletes. Therefore, national epidemiological data are crucial to inform effective prevention strategies tailored to the unique challenges of emerging economies with limited resources.
Injuries and illnesses significantly impact Para athletes, affecting not just sports participation but also daily activities, such as mobility and self-care.1,2,9 These burdens are often measured by time loss, with estimates ranging from 21 to 131 days lost per 1000 h of exposure.3,4 However, even without time loss, health problems can impact performance by reducing the volume or intensity of training and competitions.3,4 The Oslo Sports Trauma Research Center Questionnaire on Health Problems (OSTRCH2)10 provides a more comprehensive assessment of these impacts, capturing burdens beyond time loss.11,12 Given that Para athletes often contend with pre-existing impairments, additional challenges from sport-related injuries and illnesses can further increase their burden,13 potentially affecting sporting performance, particularly in emerging economies such as Brazil.
Health problems and epidemiological rates vary significantly among Paralympic sports. A pilot longitudinal study suggested that swimming had a higher injury incidence than athletics and powerlifting.3 However, during the Tokyo 2020 Paralympic Games,14 athletics and taekwondo were among the 10 sports with the highest injury rates, while swimming and powerlifting had the lowest. Moreover, swimming showed a high illness incidence, primarily affecting the respiratory and gastrointestinal systems.15 Recognising these variations can support tailored preventive strategies for each sport. This study investigated the prevalence, incidence, severity, and burden of injuries and illness for one consecutive year in para swimming, para athletics, para taekwondo, and para powerlifting athletes. In addition, we assessed whether there were differences in the prevalence of health problems across the four sports. Notably, this study is among the largest longitudinal follow-ups conducted with Para athletes, providing valuable insights into injury and illness patterns in this population.
MethodsStudy designWe conducted this prospective cohort study over one sport season, typically lasting 50 weeks (January 2022 – December 2022) in Brazil. This longitudinal study was conducted at the Paralympic Reference Centers in Belo Horizonte and São Paulo. The study followed Strengthening the Reporting of Observational Studies in Epidemiology (STROBE) guideline and was approved by the Ethical Research Committee of the Universidade Federal de Minas Gerais (number 27,518,619.4.0000.5149).
Recruitment and participantsThe sample was selected for convenience, and all Para athletes from both Paralympic Centers voluntarily agreed to participate in the study. While convenience sampling was necessary due to the limited population of elite Para athletes, the sample size in this study represents a considerable expansion compared to the previous pilot study,3 which included a smaller and less diverse cohort. Para athletes from Para swimming, athletics, powerlifting, and taekwondo of both sexes, without age restriction, who participated in at least one regional, national, or international competition in the last six months were included in this study. Before the beginning of the study, an oral presentation about the purpose of the study was conducted to encourage athletes with visual and intellectual impairments to participate. All athletes signed an informed consent form, and legal guardians provided consent for underage athletes.
Main outcome measurementsPrevalence, incidence, and severity of injuries and illnesses were registered for one continuous year during the sports season using the OSTRCH2.10,16 The OSTRCH2 was distributed electronically to all Para athletes every Monday using the Typeform platform, starting in the first week of preseason. A link to access the questionnaire was distributed to the Para athletes by text message weekly. Reminders were sent to non-responders after three days.17 After five days without a response, the main researcher contacted the Para athletes by phone or administered the questionnaire in person. A smartphone voice assistance app was used for visually impaired athletes, and the physical therapy team administered the questionnaire verbally to those with intellectual impairments. Based on the para athletes’ answers, extra information was recorded, such as the type of health problems, injury location, illness symptoms, and time loss from sport. As the OSTRCH2 allows Para athletes to report multiple health problems within the same week, each injury and illness was recorded independently. Time loss days due to health problems were classified based on the primary reported condition, ensuring that no days were counted more than once. In addition, Para athletes also reported training exposure in hours every week.
Definition of health problem, injury, and illnessFollowing the recommendations of Derman et al.,12 the present study addressed a broader concept of health problems for Para athletes. Health problems resulting directly or indirectly from participation in daily activities, such as using assistive devices for locomotion (e.g., crutches and wheelchairs) or common illnesses in Para athletes with spinal cord injuries (e.g., pressure ulcers), were also considered.12 These conditions can affect a Para athlete's health, regardless of the consequences on sports participation or performance or whether the Para athlete sought medical attention.12 Health problems were categorised as substantial if they resulted in moderate or severe reductions in training volume, performance, or complete inability to participate in Para sports.10 Moderate or severe reductions were defined as responses of 3, 4, or 5 to questions 2 or 3 of the OSTRCH2 (where 3 indicates moderate reduction, 4 severe reduction, and 5 complete inability to participate).10
Injury was defined as ‘tissue damage or other derangements of normal physical function due to participation in sports or daily activities, resulting from a rapid or repetitive transfer of kinetic energy’.11 For this study, injuries were classified based on onset (sudden or gradual onset), and no distinction was made between new, ongoing, or recurring injuries, as such classification would require additional methodological considerations beyond the scope of our analysis. In this classification, a sudden onset injury results from a single, clearly acute mechanism (e.g., fall or collision). In contrast, a gradual onset injury is caused by a repetitive mechanism without a single identifiable event responsible for the injury.12 Illness was defined as a ‘complaint or disorder experienced by the Para athlete, unrelated to injury, that involved other body systems (e.g. physical and/or mental well-being)'.12 To assure data quality, the main researcher contacted Para athletes within five days if they registered ambiguous responses.
In case of injury or illness reported by a Para athlete, the sports healthcare team was contacted to monitor and properly assess the health problem. The main researcher, a member of the interdisciplinary research group of the Brazilian Paralympic Center with experience in the application of the OSTRCH2 application, also directly contacted the athletes when they reported a health problem. This ensured accurate classification of the type, nature, and onset mode of each reported health problem.
For burden assessment, we employed two methods to report the data. Bahr et al.18 argued that focusing solely on time loss, while disregarding severity, provides an incomplete understanding as time loss reflects only severe injuries.11,12 In other words, it does not effectively measure injuries that allow Para athletes to continue participating in the sport but still impact their training volume and performance.11,12 Therefore, we initially presented burden as the total number of days lost per 1000 h of exposure (i.e., time loss burden). Additionally, to capture the overall burden of health problems, we developed a risk matrix that incorporates both severity and prevalence (i.e., severity burden). All definitions and outcome measures are provided in Supplementary material 1.
Data analysisEach week, we calculated the prevalence of injuries (sudden or gradual onset) and illnesses by dividing the number of Para athletes who reported any health problem by the number of questionnaire respondents in that same week.10 In addition, the prevalence of health problems and substantial ones was calculated for each outcome. At the end of the study, the average weekly prevalence and the corresponding 95 % confidence interval (95 % CI) were calculated over the entire follow-up period.10
Incidence rate and the corresponding 95 % CI were calculated for sudden onset injuries as the number of new cases divided by the time at risk in hours for each health problem. The result was multiplied by 1000 to obtain the rate per 1000 h of sports participation.19,20 The severity score was calculated weekly for each health problem and each time it was reported.19,21 Average weekly severity score was calculated by dividing the cumulative severity score by the number of weeks the problem was reported.21 A cumulative severity score was calculated for injuries (sudden or gradual onset) and illnesses by summing the severity score for each health problem reported weekly.21 A risk matrix graph was plotted for all sports and each specific sport to illustrate the burden of all, sudden and gradual onset injuries, with average cumulative severity scores on the y-axis and the average weekly prevalence of injuries on the x-axis.18 We calculated a thousand bootstrapped average due to the non-normal distribution of cumulative severity scores.
Analyses were performed in SPSS version 29.0 (IBM, Windows, USA). Descriptive data were expressed using each sport's means and 95 % CI. Data normality was assessed using the Shapiro-Wilk test. Given the non-normal distribution of some variables, the Kruskal-Wallis test was used to compare the prevalence of injuries and illnesses across different sports. Weekly prevalence was used as the sample measure to ensure comparability among sports. Tukey’s post hoc tests were used to identify pairwise differences between sports. The alpha level was established at 0.05.
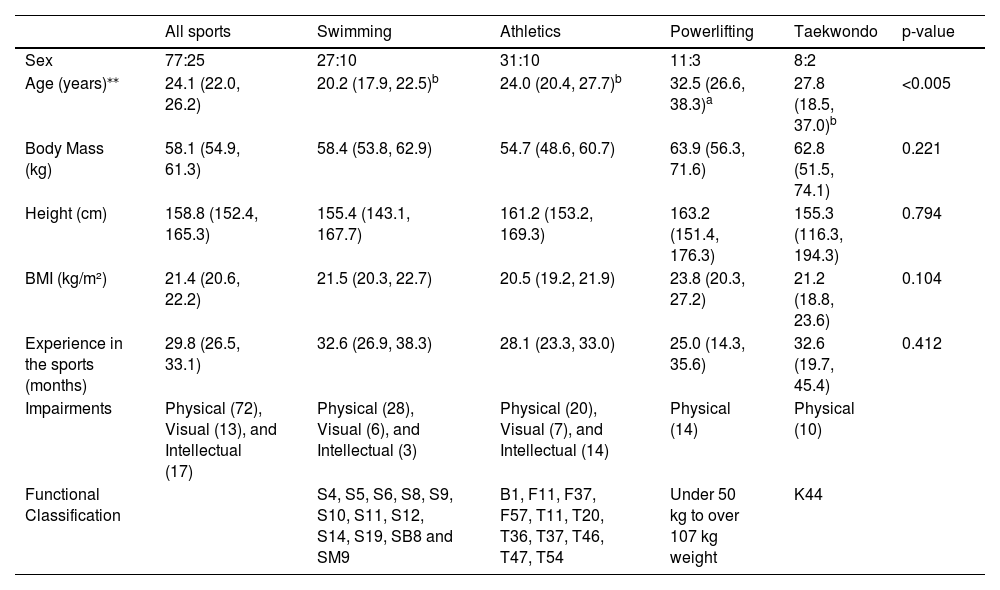
ResultsParticipantsA total of 102 Para athletes (77 males and 25 females) participated in this study, with no dropouts. Table 1 presents their demographic characteristics and functional classifications.
Demographics characteristics (mean [95 % CI]) and the results of the comparisons between sports. Sexes are reported as male:female frequency.
Fisher’s Exact test for sex distribution across sports: p = 0.801.
kg, kilogram; cm, centimetre; BMI, body mass index. Data followed by different letters indicate significant differences in age among sports (p < 0.05).
*The number in parenthesis indicates the number of Para athletes with that specific type of impairment.
**The effect size indicated a moderate effect of sport type on age (η2 = 0.136).
The overall response rate to the weekly questionnaires was approximately 92 %, reflecting occasional missed reports but maintaining a robust dataset for analysis. Para athletes self-reported a total of 612 health problems. Eighty tree percent of Para athletes reported three or more health problems, 9 % reported one or two health problems, and 8 % did not report health problems during the one year duration of this study. Of all the reported health problems, 453 were injuries (215 sudden and 238 gradual onset), and 159 were illnesses. Fig. 1 presents the prevalence of health problems for each sport during the 50 week follow-up period. The relationship between time loss, injuries, and illnesses was analyzed, and the results are presented in Supplementary file 2. In addition, the number of health problems, all injuries, sudden and gradual onset injuries, and illnesses for each sport is provided in Supplementary material 3.
Weekly prevalence of health problems and sports comparisons
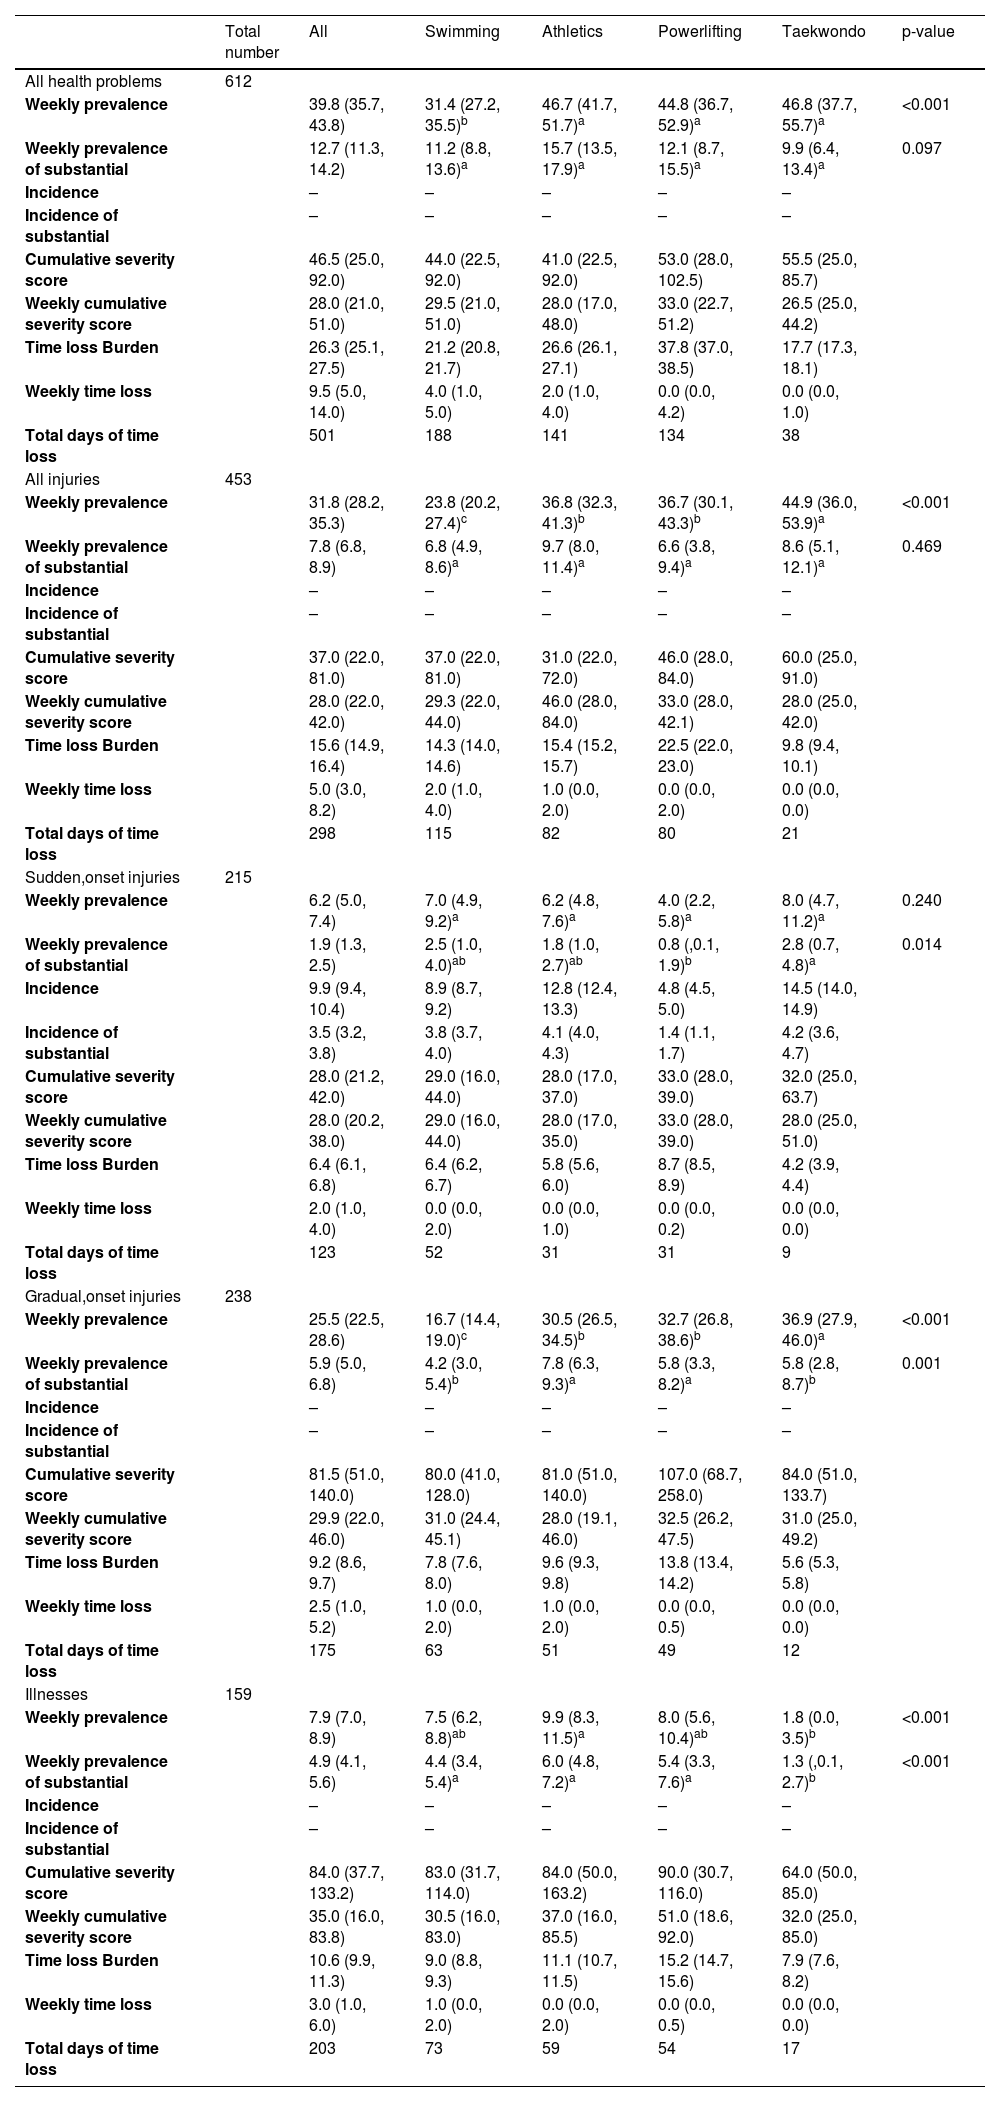
During each week of the follow-up period, 39.8 % (95 %CI: 35.7, 43.8) of the Para athletes reported having at least one health problem and 12.7 % (95 %CI: 11.3, 14.2) reported at least one substantial health problem. The prevalence of health problems and the results of the comparisons between sports are presented in Table 2. There were significant differences between sports in the prevalence of health problems (p = 0.014); η2=0.067 (medium effect), with taekwondo showing a higher prevalence of health problems than swimming (p < 0.001). Regarding injuries (p < 0.001); η2=0.107 (medium effect), swimming presented lower injury prevalence than athletics (p = 0.019), taekwondo (p < 0.001) and powerlifting (p = 0.019). For illnesses (p < 0.001); η2=0.187 (large effect), taekwondo presented a lower prevalence than athletics (p = 0.043).
Absolute numbers, mean weekly prevalence ( %), incidence rates, cumulative and weekly cumulative severity score, weekly time loss (days) and time loss burden of all and substantial health problems, injuries (sudden and gradual onset) and illnesses for each sport. The results of the ANOVAs comparing the prevalence between sports are presented in the last column (p-value).
Prevalence data are mean values in percentage with the 95 % confidence interval in parentheses. Data followed different letters indicate significant differences among sports in the prevalence of each health problem (p < 0.05).
Incidence data are presented per 1000 athlete hours with the 95 % confidence interval in parentheses.
Cumulative, weekly cumulative severity scores, and weekly time loss (days) are median and interquartile range 25 and 75 % in parentheses.
Time loss Burden data are days lost per 1000 athlete hours with the 95 % confidence interval in parentheses.
The effect sizes for the comparisons for gradual onset injuries were η2=0.121 (medium effect), and for sudden onset injuries were η2=0.034 (small effect).
Injury location and illnesses symptomsThe anatomical areas most frequently affected by injuries in Para athletes were shoulder complex (n = 97 injuries; 21.4 %), followed by ankle (n = 84; 18.5 %), knee (n = 46; 10.2 %), and thigh (n = 38; 8.4 %). For illnesses, a nasal congestion, runny nose, and sneezing (n = 23 symptoms; 14.5 %) were the most common symptoms. In addition, 20 cases were diagnosed as COVID-19, with a prevalence of 12.6 %. The prevalence of injury location and illness symptoms for each sport is provided in Supplementary material 4.
Incidence of sudden onset injuries and burden of health problemsThe incidence of sudden onset injuries was 9.9 injuries per 1000 athlete hours (95 %CI: 9.4, 10.4). The incidence of sudden onset injuries for each sport is provided in Table 2. Of the 612 health problems reported, 143 injuries (23.4 %) and 90 illnesses (14.7 %) resulted in a time loss from training or competition of ≥1 day. In total, 298 days were lost due to injuries and 203 days due to illnesses during the follow-up period. An additional 313 injuries (51.1 %) and 66 illnesses (10.8 %) did not result in time loss.
Fig. 2 presents the risk matrices for all sports. Injuries to the shoulder complex, followed by the ankle and knee, had the greatest severity burdens (Fig. 2A). Sudden onset injuries at the shoulder and ankle (Fig. 2B), as well as gradual onset injuries to the shoulder, followed by the knee and ankle (Fig. 2C), had the greatest burden.
, sudden onset, (2B) and gradual onset (2C) injuries in the 102 Para athletes. Different burden levels indicated by color gradient from green to red.")
Fig. 3 presents the risk matrices for each sport. In swimming, shoulder injuries had the greatest burden (Fig. 3A), while in athletics (Fig. 3B) and taekwondo (Fig. 3C), ankle injuries had the highest burden. In powerlifting, injuries to the neck and wrist, followed by the shoulder complex, imposed the greatest burden (Fig. 3D).
, athletics (3B), taekwondo (3C), and powerlifting (3D). Different burden levels indicated by color gradient from green to red.")
Table 2 presents the severity scores and time loss for each type of health problem and sport. Taekwondo had the highest cumulative severity score for injuries, while athletics had the highest weekly severity score. Powerlifting, however, exhibited the highest burden.
DiscussionThis study is one of the largest longitudinal follow-ups investigating health problems in Para athletes, providing valuable insights into their occurrence and burden. During the one-year follow-up period, Para athletes showed a high prevalence of health problems. Injuries to the shoulder and knee led to the highest burden among all recorded health problems.
High prevalence of injuries, especially in taekwondoThroughout the sports season, Para athletes exhibited a high injury prevalence, with para swimming showing lower prevalence of injuries compared to the other sports. This aligns with previous findings from a longitudinal pilot study3 and the Rio 2016 Summer Paralympic Games,15 where swimming also demonstrated the lowest injury prevalence. This is likely due to swimming’s low impact nature, performed in water, with no lifting like in powerlifting,22 and no direct contact like in taekwondo.14
In this first longitudinal study on health problems in Para taekwondo, Para taekwondo athletes exhibited a higher injury prevalence than powerlifting athletes. Consistent with these findings, taekwondo had one of the highest injury rates at the Tokyo 2022 Paralympic Games, whereas powerlifting had one of the lowest.14 The physical demands of taekwondo, including explosive contacts, kicks, and rapid strikes, likely contribute to the high prevalence rate.14 The most frequently injured areas were the ankle (40.9 %), knee (28.2 %), and feet/fingers (20.1 %). The greater explosive demands on the lower limbs, particularly in athletes with unilateral arm amputation, help to explain these patterns.
Respiratory illnesses are the most common in athleticsPara athletics athletes exhibited a prevalence of illnesses nearly five times higher than that observed in para taekwondo. Most Para athletes in athletics had neurological impairments, which have been associated with higher illness prevalence in previous studies.2.23 These illnesses can severely impact sporting performance and training quality.23 Therefore, it is crucial for sports teams to quickly recognise the primary symptoms to enable a proactive and immediate response in managing athletes’ health.
Respiratory symptoms were the most common in athletics, with a prevalence of 18.8 % for symptoms like nasal congestion, runny nose, and sneezing, followed by COVID-19 at 12.5 %. This prevalence is likely influenced by close contact during training, in locker rooms, and shared equipment.24 Similarly, at the Tokyo 2020 Paralympic Games, both athletics and swimming were among the top 10 sports with the highest incidence of illnesses, with respiratory symptoms being the most prevalent in both.25 This aligns with previous literature suggesting that swimmers may have an increased susceptibility to respiratory illnesses due to prolonged exposure to chlorinated environments and humid conditions, which can contribute to airway irritation and inflammation. Therefore, athletes must promptly notify the sports team of any respiratory symptoms to ensure prompt preventive and curative measures.
High incidence of sudden onset injuriesWith an incidence rate of sudden onset injuries of 9.9 injuries per 1000 athlete hours, the present study observed a higher rate than previous longitudinal Paralympic studies.2,3,5 Pinheiro et al.3 found a slightly lower incidence in a pilot study with athletes from one of our Brazilian Paralympic Reference Centers, reporting 7.1 injuries per 1000 athlete hours. The higher rate in our study may be attributed to the inclusion of taekwondo, which exhibited the highest incidence among the included sports. Previous studies showed a much lower incidence of 0.5 injury per 1000 exposure hours5 and 2.8 injuries per 1000 athletes days.2 First, in a study,5 only concussion was investigated. Variations in follow-up duration, number of Para athletes, age groups, sex proportions, competitive level, types of impairments, sport types, and socioeconomic level could explain this disparity. Future longitudinal studies should explore the impact of these factors on sudden onset injury incidence to create targeted preventive measures aimed at reducing the high rates of sudden onset injuries found in this study.
Injuries with the greatest burdenInjuries to the shoulder complex had the greatest burden, especially in swimming. This is particularly problematic for athletes who are wheelchair-dependent. A shoulder complex injury not only affects training performance but also significantly impacts essential daily activities, such as wheelchair maneuvering.3,23,26 We used the cumulative and weekly severity scores in addition to the time loss variables because time loss alone might underestimate the true burden of gradual onset injuries.12,18,27 In fact, although powerlifting showed the highest burden of injuries (i.e. days lost per 1000 h of exposure), athletics had the highest weekly severity score. This finding may be explained by para athletics athletes training and competing despite the presence of substantial gradual onset injuries, but with impaired performance, intensity, and/or volume.18
Strengths and limitationsThe main strengths of this study are its large sample size, the 50 week longitudinal follow-up, and the inclusion of four different sports, including taekwondo. In addition, the OSTRCH2 questionnaire was used to monitor the participants' health problems, and the International Olympic Committee11 recommends using this questionnaire for parasports as it avoids underreporting gradual onset injuries through severity scores. The pilot study3 provided initial insights that informed the design and scope of the present analysis, particularly in refining data collection methods and risk assessment models. Although a formal hypothesis-testing approach was not explicitly derived from the pilot study, its findings guided key methodological decisions. Additionally, given the inherent constraints in Para Sport research, the current sample size was determined to be sufficiently robust to detect meaningful differences in injury epidemiology. However, we acknowledge that the ability to detect smaller effect sizes may still be limited, and this should be considered when interpreting the findings.
A limitation of this study is the lack of comparison between competition and training periods regarding the severity and burden of health problems. Additionally, this study lacks documentation on the subsequent and sudden onset injuries with repetitive mechanisms. The inability to distinguish between subsequent and sudden onset injuries with repetitive mechanisms of previous conditions may have introduced bias in the reported injury incidence and prevalence. This limitation may have resulted in an overestimation if recurrent injuries were counted as new cases, or an underestimation if athletes underreported injuries they perceived as continuations of prior conditions. This issue may be particularly relevant in sports with repetitive or high-impact demands. However, the continuous weekly monitoring approach helped ensure a comprehensive assessment of all health problems over time. To improve the classification of injury mechanisms, future studies should integrate imaging tests, which can help differentiate between acute structural damage and gradual onset conditions, particularly in Para athletes exposed to repetitive stress. For example, MRI and ultrasound can detect early tissue changes that may contribute to injury development. Additionally, questionnaires remain essential for capturing subjective aspects of injury burden, such as pain perception, functional limitations, and symptoms that may not be detectable through imaging alone. The combination of these tools would provide a more comprehensive understanding of injury patterns in Para athletes. While ongoing monitoring remains valuable for tracking health problems in this population, future research should progress towards targeted intervention strategies to mitigate injury risk and improve athlete well-being.
ConclusionThis one year prospective cohort study investigated the prevalence, incidence, severity, and burden of health problems in Para athletes across four sports. A high prevalence of health problems was observed in all sports. Injuries to the shoulder complex, followed by the ankle and knee, had the greatest burdens. Taekwondo had the highest prevalence of injuries, while athletics had the highest prevalence of illnesses. Health teams working with Para athletes should be aware of the high injury rates and the body regions frequently affected in specific sports, particularly the burden of those injuries in taekwondo.
None
The authors thank the support given by Coordenação de Aperfeiçoamento de Pessoal de Nível Superior (CAPES), code 001, Conselho Nacional de Desenvolvimento Científico e Tecnológico (CNPq) – protocol number 310772/2023-0, 403939/2023-2, 444769/2023-4 and 405140/2021-5, Secretaria Especial do Esporte do Ministério da Cidadania (Governo Federal, Brazil, protocol number 58000.008978/2018-37 and 71000.056251/2020-49), Comitê Paralímpico Brasileiro (CPB), Centro de Treinamento Esportivo (CTE/UFMG), and Fundação de Amparo a Pesquisa do Estado de Minas Gerais (FAPEMIG) – protocol number APQ-00414-24.


