


The non-invasive assessment of maximal respiratory pressures (MRP) reflects the strength of the respiratory muscles.
ObjectiveTo evaluate the studies which have established normative values for MRP in healthy children and adolescents and to synthesize these values through a meta-analysis.
MethodsThe searches were conducted until October 2023 in the following databases: ScienceDirect, MEDLINE, CINAHL, SciELO, and Web of Science. Articles that determined normative values and/or reference equations for maximal inspiratory pressure (MIP) and maximal expiratory pressure (MEP) in children and adolescents published in English, Portuguese, or Spanish regardless of the year of publication were included. Two reviewers selected titles and abstracts, in case of conflict, a third reviewer was consulted. Articles that presented sufficient data were included to conduct the meta-analysis.
ResultsInitially, 252 studies were identified, 28 studies were included in the systematic review and 19 in the meta-analysis. The sample consisted of 5798 individuals, and the MIP and MEP values were stratified by sex and age groups of 4–11 and 12–19 years. Values from females 4–11 years were: 65.8 cmH2O for MIP and 72.8 cmH2O for MEP, and for males, 75.4 cmH2O for MIP and 84.0 cmH2O for MEP. In the 12–19 age group, values for females were 82.1 cmH2O for MIP and 90.0 cmH2O for MEP, and for males, they were 95.0 cmH2O for MIP and 105.7 cmH2O for MEP.
ConclusionsThis meta-analysis suggests normative values for MIP and MEP in children and adolescents based on 19 studies.
Respiratory muscles play an important role in pulmonary ventilation, and their impairment is responsible for worsening gas exchange and oxygen transport to tissues.1,2 The non-invasive assessment of maximal respiratory pressures (MRP), maximal inspiratory pressures (MIP), and maximal expiratory pressures (MEP) reflect the strength of the respiratory muscles and contribute to the diagnosis and prognosis of some health conditions.3,4 Additionally, it provides useful information for discontinuing mechanical ventilation in the pre and postoperative periods and evaluating the effects of pulmonary rehabilitation programs.5,6
The MRP evaluation varies because it is a test that depends on the individual's understanding and collaboration. To standardize measurements, the American Thoracic Society (ATS)1 and the European Respiratory Society (ERS)1 have published measurement guidelines. The main recommendations are based on the lung volume to start and the number of MRP maneuvers to minimize the measurement variability. Another important point refers to the normative values for MIP and MEP.7 It is known that anthropometric characteristics, as well as sex and age, influence the results.8-13 Studies have shown an increase in MIP and MEP values in children and adolescents as age advances, with the increase in body mass and height.9,10,14,15 For this reason, a wide variety of normative values and reference equations are available for use in clinical practice and research.8-10,14-38,40
Considering that normative values are important for decision-making both in the evaluation and in proposing interventions,19,21 this study will provide healthcare professionals with a critical analysis of the studies that determined these values for MRP in children and adolescents. Additionally, the meta-analysis will provide a better estimation of the normative values by combining the sample size of the individual studies, increasing the external validity and the generalizability of the results.
Therefore, this study aimed to describe and evaluate the studies which have established the normative values for MRP in healthy children and adolescents and to synthesize these values through a meta-analysis.
MethodsProtocol and enrollmentThe PRISMA recommendation was followed for this study, available at http://prisma-statement.org/. This systematic review was registered with the International Prospective Registry of Systematic Reviews (PROSPERO), registration number: CRD42018082050.
Search strategyElectronic searches were conducted until October 2023, regardless of the year of publication, in the following databases: ScienceDirect, Medical Literature Analysis and Retrieval System Online- MEDLINE (via PubMed), Cumulative Index to Nursing, and Allied Health Literature - CINAHL, Scientific Electronic Library Online – SciELO, and Web of Science. The search strategy was performed with the terms "respiratory muscles" combined with "maximal respiratory pressure" or "maximal inspiratory pressure" or "maximal expiratory pressure" and "reference values" or "reference equations" or "normal values" and "child" or "adolescent." These terms were adapted according to the requirements of the different databases. To illustrate for the SciELO database the following search strategy was used: (respiratory muscles) AND (maximal respiratory pressure) OR (maximal inspiratory pressure) OR (maximal expiratory pressure) AND (reference values) OR (reference equations) OR (normal values) AND (child) OR (adolescent). In addition, through the EndNote software (www.endnote.com), the database studies were grouped, and all duplicates were removed. A manual search was performed from the reference list of all included articles, adding relevant studies.
Eligibility criteriaInclusion criteria consisted of original studies that determined normative values and/or reference equations for MIP and/or MEP in healthy children and/or adolescents; regardless of the year of publication; published in English, Portuguese, or Spanish. Studies involving obese individuals or athletes, as well as theses and dissertations, or studies presenting the same sample, were excluded.
Study selectionTwo independent reviewers (NP and OR) selected titles and abstracts to identify possible relevant studies. The full-text of the selected studies were analyzed to determine whether they met the inclusion criteria. A third reviewer (DV) was asked to resolve disagreement between the two reviewers. Each selected study was independently reviewed using a data extraction form.
Data extractionData were extracted using a standardized form that included the following sections (1) study characteristics (author, journal, year, number, volume, location, authors contact, title, and purpose); (2) participant characteristics (number, age, sex, height, weight, body mass index (BMI), lung function, level of physical activity, and ethnicity); (3) technical aspects (type of mouthpiece, air leak orifice size, pressure recorded, type of manometer, initial lung volume to perform the test, nose clip, the duration of maneuver maintenance, interval time between MIP tests, interval time between MEP tests, interval time between MIP and MEP tests, number of attempts, prior training, interruption criteria, verbal instructions and demonstrations, and equipment calibration). For the meta-analysis, the studies were stratified into two groups: 4–11 years and 12–19 years.
Quality assessment of studiesThe methodological quality of each study was assessed by relevant items from QUADA-2 scale (Quality Assessment of Diagnostic Accuracy Studies), which is an evidence-based quality assessment tool used in systematic reviews of diagnostic accuracy. QUADAS-2 verifies the risk of bias through four domains: patient selection, index test, reference standard, and flow and time, also verifying the applicability with the same domains, except flow and time. The tool consists of questions to guide the classification and must be answered with "yes," "no," or "unclear". If there is a "no" answer, it is considered a high risk of bias. If all the answers are "yes”, then low risk. Finally, the risk of bias is considered "high," "low," or "unclear," and there is no need to use numbers to score. The same steps are used to classify applicability.39 For this systematic review, the reference standard domain was not considered.39
Synthesis and analysisCharacteristics of the participants, equipment, and maneuver, as well as pulmonary function values, study quality, normative values, and reference equations were synthesized in tables. Moreover, pooled estimates of MIP and MEP, according to age group and sex, were obtained using random effect models to account for the heterogeneity across the individual effects of the studies and generated values of mean [95% confidence interval (95% CI)]. Heterogeneity between studies was investigated using I2 statistics and the chi-squared test. The Comprehensive Meta-Analysis software (BioStat, Englewood, New Jersey, USA) and SPSS IBM version 19 were used for data analysis.
ResultsStudy selectionAs shown in Fig. 1, 252 studies were identified through a database search and a manual search of reference lists. Duplicate studies were excluded, and 246 titles and abstracts were analyzed. There were 203 exclusions by eligibility criteria, resulting in 43 full-text studies. Finally, 15 studies were excluded because the purpose of the study was not to determine normal values and/or reference equations for healthy children and adolescents, or they included obese individuals or athletes, or they presented the same data of previous studies. Therefore, 28 studies were included in this systematic review, and 19 in the meta-analysis.
Characteristics of participants
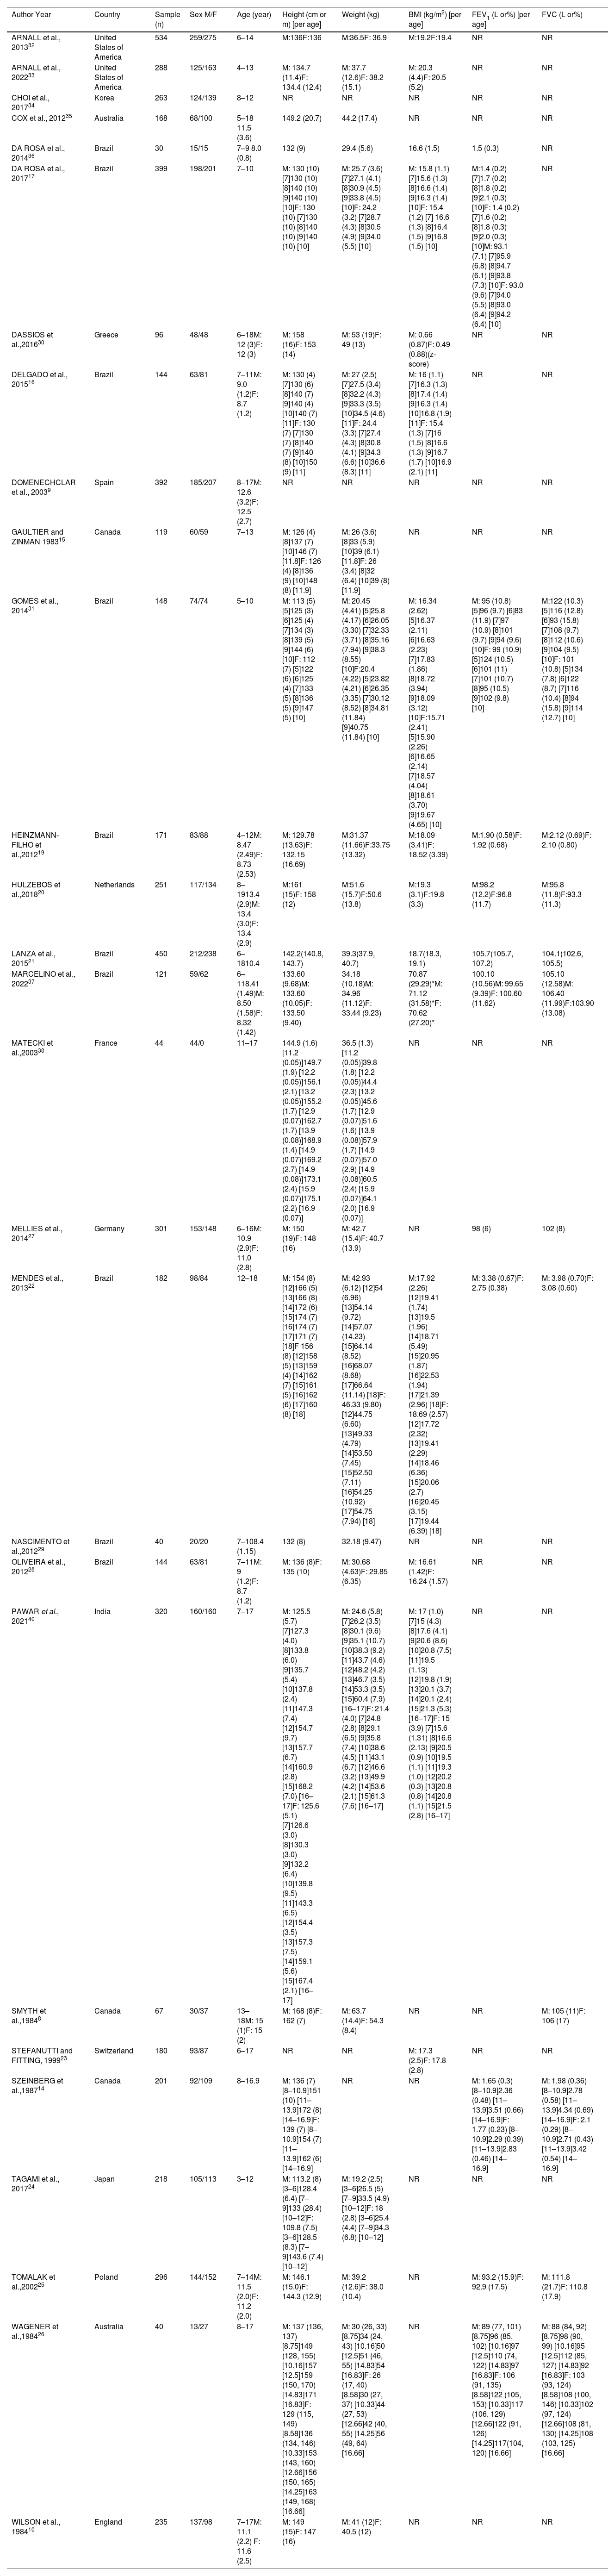
Table 1 shows the characteristics of the participants. The total sample consisted of 5798 individuals, 52% were female. The age range was from 4 to 19 years old. The studies were performed in the United States,32,33 Korea,34 Japan,24 Netherlands,20 Switzerland,23 England,10 Germany,27 Spain,9 Greece,30 Poland,25 France,38 Australia,26,35 Canada,8,14,15 India,40 and Brazil.16,17,19,21,22,28,29,31,36,37 Only 15 studies provided BMI values,16,17,19-23,28,30-33,36,37,40 of these, the sample was classified as underweight or eutrophic. Thirteen studies reported spirometry variables, 10 of which presented forced expiratory volume in one second (FEV1) and forced vital capacity (FVC).14,19-22,25,26,27,31,37 The studies by Da Rosa et al.17,36 showed only FEV1, and Smyth et al.8 presented only FVC data.
Characteristics of studies included.
| Author Year | Country | Sample (n) | Sex M/F | Age (year) | Height (cm or m) [per age] | Weight (kg) | BMI (kg/m2) [per age] | FEV1 (L or%) [per age] | FVC (L or%) |
|---|---|---|---|---|---|---|---|---|---|
| ARNALL et al., 201332 | United States of America | 534 | 259/275 | 6–14 | M:136F:136 | M:36.5F: 36.9 | M:19.2F:19.4 | NR | NR |
| ARNALL et al., 202233 | United States of America | 288 | 125/163 | 4–13 | M: 134.7 (11.4)F: 134.4 (12.4) | M: 37.7 (12.6)F: 38.2 (15.1) | M: 20.3 (4.4)F: 20.5 (5.2) | NR | NR |
| CHOI et al., 201734 | Korea | 263 | 124/139 | 8–12 | NR | NR | NR | NR | NR |
| COX et al., 201235 | Australia | 168 | 68/100 | 5–18 11.5 (3.6) | 149.2 (20.7) | 44.2 (17.4) | NR | NR | NR |
| DA ROSA et al., 201436 | Brazil | 30 | 15/15 | 7–9 8.0 (0.8) | 132 (9) | 29.4 (5.6) | 16.6 (1.5) | 1.5 (0.3) | NR |
| DA ROSA et al., 201717 | Brazil | 399 | 198/201 | 7–10 | M: 130 (10) [7]130 (10) [8]140 (10) [9]140 (10) [10]F: 130 (10) [7]130 (10) [8]140 (10) [9]140 (10) [10] | M: 25.7 (3.6) [7]27.1 (4.1) [8]30.9 (4.5) [9]33.8 (4.5) [10]F: 24.2 (3.2) [7]28.7 (4.3) [8]30.5 (4.9) [9]34.0 (5.5) [10] | M: 15.8 (1.1) [7]15.6 (1.3) [8]16.6 (1.4) [9]16.3 (1.4) [10]F: 15.4 (1.2) [7] 16.6 (1.3) [8]16.4 (1.5) [9]16.8 (1.5) [10] | M:1.4 (0.2) [7]1.7 (0.2) [8]1.8 (0.2) [9]2.1 (0.3) [10]F: 1.4 (0.2) [7]1.6 (0.2) [8]1.8 (0.3) [9]2.0 (0.3) [10]M: 93.1 (7.1) [7]95.9 (6.8) [8]94.7 (6.1) [9]93.8 (7.3) [10]F: 93.0 (9.6) [7]94.0 (5.5) [8]93.0 (6.4) [9]94.2 (6.4) [10] | NR |
| DASSIOS et al.,201630 | Greece | 96 | 48/48 | 6–18M: 12 (3)F: 12 (3) | M: 158 (16)F: 153 (14) | M: 53 (19)F: 49 (13) | M: 0.66 (0.87)F: 0.49 (0.88)(z-score) | NR | NR |
| DELGADO et al., 201516 | Brazil | 144 | 63/81 | 7–11M: 9.0 (1.2)F: 8.7 (1.2) | M: 130 (4) [7]130 (6) [8]140 (7) [9]140 (4) [10]140 (7) [11]F: 130 (7) [7]130 (7) [8]140 (7) [9]140 (8) [10]150 (9) [11] | M: 27 (2.5) [7]27.5 (3.4) [8]32.2 (4.3) [9]33.3 (3.5) [10]34.5 (4.6) [11]F: 24.4 (3.3) [7]27.4 (4.3) [8]30.8 (4.1) [9]34.3 (6.6) [10]36.6 (8.3) [11] | M: 16 (1.1) [7]16.3 (1.3) [8]17.4 (1.4) [9]16.3 (1.4) [10]16.8 (1.9) [11]F: 15.4 (1.3) [7]16 (1.5) [8]16.6 (1.3) [9]16.7 (1.7) [10]16.9 (2.1) [11] | NR | NR |
| DOMENECHCLAR et al., 20039 | Spain | 392 | 185/207 | 8–17M: 12.6 (3.2)F: 12.5 (2.7) | NR | NR | NR | NR | NR |
| GAULTIER and ZINMAN 198315 | Canada | 119 | 60/59 | 7–13 | M: 126 (4) [8]137 (7) [10]146 (7) [11.8]F: 126 (4) [8]136 (9) [10]148 (8) [11.9] | M: 26 (3.6) [8]33 (5.9) [10]39 (6.1) [11.8]F: 26 (3.4) [8]32 (6.4) [10]39 (8) [11.9] | NR | NR | NR |
| GOMES et al., 201431 | Brazil | 148 | 74/74 | 5–10 | M: 113 (5) [5]125 (3) [6]125 (4) [7]134 (3) [8]139 (5) [9]144 (6) [10]F: 112 (7) [5]122 (6) [6]125 (4) [7]133 (5) [8]136 (5) [9]147 (5) [10] | M: 20.45 (4.41) [5]25.8 (4.17) [6]26.05 (3.30) [7]32.33 (3.71) [8]35.16 (7.94) [9]38.3 (8.55) [10]F:20.4 (4.22) [5]23.82 (4.21) [6]26.35 (3.35) [7]30.12 (8.52) [8]34.81 (11.84) [9]40.75 (11.84) [10] | M: 16.34 (2.62) [5]16.37 (2.11) [6]16.63 (2.23) [7]17.83 (1.86) [8]18.72 (3.94) [9]18.09 (3.12) [10]F:15.71 (2.41) [5]15.90 (2.26) [6]16.65 (2.14) [7]18.57 (4.04) [8]18.61 (3.70) [9]19.67 (4.65) [10] | M: 95 (10.8) [5]96 (9.7) [6]83 (11.9) [7]97 (10.9) [8]101 (9.7) [9]94 (9.6) [10]F: 99 (10.9) [5]124 (10.5) [6]101 (11) [7]101 (10.7) [8]95 (10.5) [9]102 (9.8) [10] | M:122 (10.3) [5]116 (12.8) [6]93 (15.8) [7]108 (9.7) [8]112 (10.6) [9]104 (9.5) [10]F: 101 (10.8) [5]134 (7.8) [6]122 (8.7) [7]116 (10.4) [8]94 (15.8) [9]114 (12.7) [10] |
| HEINZMANN-FILHO et al.,201219 | Brazil | 171 | 83/88 | 4–12M: 8.47 (2.49)F: 8.73 (2.53) | M: 129.78 (13.63)F: 132.15 (16.69) | M:31.37 (11.66)F:33.75 (13.32) | M:18.09 (3.41)F: 18.52 (3.39) | M:1.90 (0.58)F: 1.92 (0.68) | M:2.12 (0.69)F: 2.10 (0.80) |
| HULZEBOS et al.,201820 | Netherlands | 251 | 117/134 | 8–1913.4 (2.9)M: 13.4 (3.0)F: 13.4 (2.9) | M:161 (15)F: 158 (12) | M:51.6 (15.7)F:50.6 (13.8) | M:19.3 (3.1)F:19.8 (3.3) | M:98.2 (12.2)F:96.8 (11.7) | M:95.8 (11.8)F:93.3 (11.3) |
| LANZA et al., 201521 | Brazil | 450 | 212/238 | 6–1810.4 | 142.2(140.8, 143.7) | 39.3(37.9, 40.7) | 18.7(18.3, 19.1) | 105.7(105.7, 107.2) | 104.1(102.6, 105.5) |
| MARCELINO et al., 202237 | Brazil | 121 | 59/62 | 6–118.41 (1.49)M: 8.50 (1.58)F: 8.32 (1.42) | 133.60 (9.68)M: 133.60 (10.05)F: 133.50 (9.40) | 34.18 (10.18)M: 34.96 (11.12)F: 33.44 (9.23) | 70.87 (29.29)*M: 71.12 (31.58)*F: 70.62 (27.20)* | 100.10 (10.56)M: 99.65 (9.39)F: 100.60 (11.62) | 105.10 (12.58)M: 106.40 (11.99)F:103.90 (13.08) |
| MATECKI et al.,200338 | France | 44 | 44/0 | 11–17 | 144.9 (1.6) [11.2 (0.05)]149.7 (1.9) [12.2 (0.05)]156.1 (2.1) [13.2 (0.05)]155.2 (1.7) [12.9 (0.07)]162.7 (1.7) [13.9 (0.08)]168.9 (1.4) [14.9 (0.07)]169.2 (2.7) [14.9 (0.08)]173.1 (2.4) [15.9 (0.07)]175.1 (2.2) [16.9 (0.07)] | 36.5 (1.3) [11.2 (0.05)]39.8 (1.8) [12.2 (0.05)]44.4 (2.3) [13.2 (0.05)]45.6 (1.7) [12.9 (0.07)]51.6 (1.6) [13.9 (0.08)]57.9 (1.7) [14.9 (0.07)]57.0 (2.9) [14.9 (0.08)]60.5 (2.4) [15.9 (0.07)]64.1 (2.0) [16.9 (0.07)] | NR | NR | NR |
| MELLIES et al., 201427 | Germany | 301 | 153/148 | 6–16M: 10.9 (2.9)F: 11.0 (2.8) | M: 150 (19)F: 148 (16) | M: 42.7 (15.4)F: 40.7 (13.9) | NR | 98 (6) | 102 (8) |
| MENDES et al., 201322 | Brazil | 182 | 98/84 | 12–18 | M: 154 (8) [12]166 (5) [13]166 (8) [14]172 (6) [15]174 (7) [16]174 (7) [17]171 (7) [18]F 156 (8) [12]158 (5) [13]159 (4) [14]162 (7) [15]161 (5) [16]162 (6) [17]160 (8) [18] | M: 42.93 (6.12) [12]54 (6.96) [13]54.14 (9.72) [14]57.07 (14.23) [15]64.14 (8.52) [16]68.07 (8.68) [17]66.64 (11.14) [18]F: 46.33 (9.80) [12]44.75 (6.60) [13]49.33 (4.79) [14]53.50 (7.45) [15]52.50 (7.11) [16]54.25 (10.92) [17]54.75 (7.94) [18] | M:17.92 (2.26) [12]19.41 (1.74) [13]19.5 (1.96) [14]18.71 (5.49) [15]20.95 (1.87) [16]22.53 (1.94) [17]21.39 (2.96) [18]F: 18.69 (2.57) [12]17.72 (2.32) [13]19.41 (2.29) [14]18.46 (6.36) [15]20.06 (2.7) [16]20.45 (3.15) [17]19.44 (6.39) [18] | M: 3.38 (0.67)F: 2.75 (0.38) | M: 3.98 (0.70)F: 3.08 (0.60) |
| NASCIMENTO et al.,201229 | Brazil | 40 | 20/20 | 7–108.4 (1.15) | 132 (8) | 32.18 (9.47) | NR | NR | NR |
| OLIVEIRA et al., 201228 | Brazil | 144 | 63/81 | 7–11M: 9 (1.2)F: 8.7 (1.2) | M: 136 (8)F: 135 (10) | M: 30.68 (4.63)F: 29.85 (6.35) | M: 16.61 (1.42)F: 16.24 (1.57) | NR | NR |
| PAWAR et al., 202140 | India | 320 | 160/160 | 7–17 | M: 125.5 (5.7) [7]127.3 (4.0) [8]133.8 (6.0) [9]135.7 (5.4) [10]137.8 (2.4) [11]147.3 (7.4) [12]154.7 (9.7) [13]157.7 (6.7) [14]160.9 (2.8) [15]168.2 (7.0) [16–17]F: 125.6 (5.1) [7]126.6 (3.0) [8]130.3 (3.0) [9]132.2 (6.4) [10]139.8 (9.5) [11]143.3 (6.5) [12]154.4 (3.5) [13]157.3 (7.5) [14]159.1 (5.6) [15]167.4 (2.1) [16–17] | M: 24.6 (5.8) [7]26.2 (3.5) [8]30.1 (9.6) [9]35.1 (10.7) [10]38.3 (9.2) [11]43.7 (4.6) [12]48.2 (4.2) [13]46.7 (3.5) [14]53.3 (3.5) [15]60.4 (7.9) [16–17]F: 21.4 (4.0) [7]24.8 (2.8) [8]29.1 (6.5) [9]35.8 (7.4) [10]38.6 (4.5) [11]43.1 (6.7) [12]46.6 (3.2) [13]49.9 (4.2) [14]53.6 (2.1) [15]61.3 (7.6) [16–17] | M: 17 (1.0) [7]15 (4.3) [8]17.6 (4.1) [9]20.6 (8.6) [10]20.8 (7.5) [11]19.5 (1.13) [12]19.8 (1.9) [13]20.1 (3.7) [14]20.1 (2.4) [15]21.3 (5.3) [16–17]F: 15 (3.9) [7]15.6 (1.31) [8]16.6 (2.13) [9]20.5 (0.9) [10]19.5 (1.1) [11]19.3 (1.0) [12]20.2 (0.3) [13]20.8 (0.8) [14]20.8 (1.1) [15]21.5 (2.8) [16–17] | NR | NR |
| SMYTH et al.,19848 | Canada | 67 | 30/37 | 13–18M: 15 (1)F: 15 (2) | M: 168 (8)F: 162 (7) | M: 63.7 (14.4)F: 54.3 (8.4) | NR | NR | M: 105 (11)F: 106 (17) |
| STEFANUTTI and FITTING, 199923 | Switzerland | 180 | 93/87 | 6–17 | NR | NR | M: 17.3 (2.5)F: 17.8 (2.8) | NR | NR |
| SZEINBERG et al.,198714 | Canada | 201 | 92/109 | 8–16.9 | M: 136 (7) [8–10.9]151 (10) [11–13.9]172 (8) [14–16.9]F: 139 (7) [8–10.9]154 (7) [11–13.9]162 (6) [14–16.9] | NR | NR | M: 1.65 (0.3) [8–10.9]2.36 (0.48) [11–13.9]3.51 (0.66) [14–16.9]F: 1.77 (0.23) [8–10.9]2.29 (0.39) [11–13.9]2.83 (0.46) [14–16.9] | M: 1.98 (0.36) [8–10.9]2.78 (0.58) [11–13.9]4.34 (0.69) [14–16.9]F: 2.1 (0.29) [8–10.9]2.71 (0.43) [11–13.9]3.42 (0.54) [14–16.9] |
| TAGAMI et al., 201724 | Japan | 218 | 105/113 | 3–12 | M: 113.2 (8) [3–6]128.4 (6.4) [7–9]133 (28.4) [10–12]F: 109.8 (7.5) [3–6]128.5 (8.3) [7–9]143.6 (7.4) [10–12] | M: 19.2 (2.5) [3–6]26.5 (5) [7–9]33.5 (4.9) [10–12]F: 18 (2.8) [3–6]25.4 (4.4) [7–9]34.3 (6.8) [10–12] | NR | NR | NR |
| TOMALAK et al.,200225 | Poland | 296 | 144/152 | 7–14M: 11.5 (2.0)F: 11.2 (2.0) | M: 146.1 (15.0)F: 144.3 (12.9) | M: 39.2 (12.6)F: 38.0 (10.4) | NR | M: 93.2 (15.9)F: 92.9 (17.5) | M: 111.8 (21.7)F: 110.8 (17.9) |
| WAGENER et al.,198426 | Australia | 40 | 13/27 | 8–17 | M: 137 (136, 137) [8.75]149 (128, 155) [10.16]157 [12.5]159 (150, 170) [14.83]171 [16.83]F: 129 (115, 149) [8.58]136 (134, 146) [10.33]153 (143, 160) [12.66]156 (150, 165) [14.25]163 (149, 168) [16.66] | M: 30 (26, 33) [8.75]34 (24, 43) [10.16]50 [12.5]51 (46, 55) [14.83]54 [16.83]F: 26 (17, 40) [8.58]30 (27, 37) [10.33]44 (27, 53) [12.66]42 (40, 55) [14.25]56 (49, 64) [16.66] | NR | M: 89 (77, 101) [8.75]96 (85, 102) [10.16]97 [12.5]110 (74, 122) [14.83]97 [16.83]F: 106 (91, 135) [8.58]122 (105, 153) [10.33]117 (106, 129) [12.66]122 (91, 126) [14.25]117(104, 120) [16.66] | M: 88 (84, 92) [8.75]98 (90, 99) [10.16]95 [12.5]112 (85, 127) [14.83]92 [16.83]F: 103 (93, 124) [8.58]108 (100, 146) [10.33]102 (97, 124) [12.66]108 (81, 130) [14.25]108 (103, 125) [16.66] |
| WILSON et al., 198410 | England | 235 | 137/98 | 7–17M: 11.1 (2.2) F: 11.6 (2.5) | M: 149 (15)F: 147 (16) | M: 41 (12)F: 40.5 (12) | NR | NR | NR |
ªData presented by mean (standard deviation) or median (25th, 75th); [], age; (), range; NR, not reported; n, sample size; BMI, body mass index; FEV1, forced expiratory volume in the first second; FVC, forced vital capacity; *BMI percentile.
The characteristics of the equipment used in the studies to measure MIP and MEP and their specifications are shown in the supplementary material (S1 and S2). A rigid, flat, and plastic mouthpiece was used to perform the tests in five studies,10,21,22,28,29 while nine studies did not describe this item.15,20,24,27,31,32,34-36,38 Seventeen studies described the width of the air leakage orifice,8,9,14,16,17,19,22,25,26,28-30,32,33,36,37,38 which ranged from 0.5 to 2 mm, one study reported the length (3.1 cm),8 and another reported only the presence of the orifice, but did not specify the dimension.21 A nose clip was used in 19 studies,9,14-17,19-23,26,28,29,31,33,36,37,38,40 in two studies the authors chose not to use it,10,24 and seven studies did not report if a nose clip was used.8,25,27,30,32,34,35 Twenty-three studies chose to record the plateau pressure of the maneuvers,8-10,14-17,19,21-23,25,26,29-38,40 while one recorded the plateau and the peak pressures.28
The sustained maneuver time was reported by 19 studies,8-10,14,16,17,19,21-23,25,26,29-31,36-38,40 which ranged from one to three seconds. For initial volume, the residual volume (RV) and the total lung capacity (TLC) were chosen for the MIP and MEP maneuvers in 21 studies.8-10,14,16,17,19-22,25,26,28-30,32,33,35,36,37,40 Before performing the tests, participants were verbally instructed on how to perform the maneuver in 20 studies8,9,16,17,19,21-26,28,29,31-34,36,37,40 and in 14 studies a demonstration of the test was also performed.9,16,17,19,21,22,24,25,31-33,36,37,40 The number of maneuver attempts ranged from one to nine times, with most studies using between three9,10,17,19,20,25,27,29,31-33,35-37,40 and seven17,29,36 attempts.
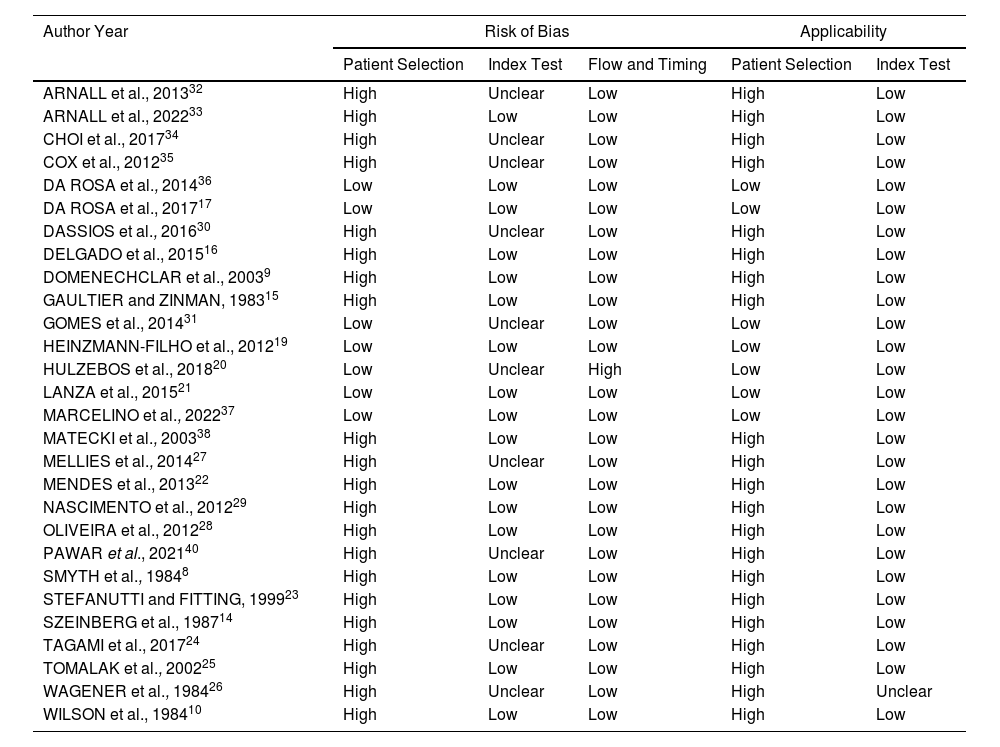
Quality of studiesThe methodological quality of the studies was analyzed using QUADAS-2 (Table 2). For the risk of bias in Patient selection, 21 studies had a high risk of bias8-10,14-16,22-30,32-35,38,40 for not reporting information on spirometry and/or BMI. In the domain of the Index test, 10 studies were considered unclear,20,24,26,27,30-32,34,35,40 because they did not provide enough information to be accurately assessed, resulting in concern about the risk of bias. Only one study20 had a high risk of bias in the Flow and time domain due to the different numbers of participants for each test. Regarding the domain of Applicability, 21 studies were considered at high risk of bias in the Patient selection,8-10,14-16,22-30,32-35,38,40 and only one study was considered unclear in the index test,26 bringing a concern with the risk of bias. The following studies were considered as low risk of bias in all domains: Da Rosa et al.,36 Da Rosa et al.,17 Heinzmann-Filho et al.,19 Lanza et al.,21 Marcelino et al.37
Quality of studies (QUADAS-2).
| Author Year | Risk of Bias | Applicability | |||
|---|---|---|---|---|---|
| Patient Selection | Index Test | Flow and Timing | Patient Selection | Index Test | |
| ARNALL et al., 201332 | High | Unclear | Low | High | Low |
| ARNALL et al., 202233 | High | Low | Low | High | Low |
| CHOI et al., 201734 | High | Unclear | Low | High | Low |
| COX et al., 201235 | High | Unclear | Low | High | Low |
| DA ROSA et al., 201436 | Low | Low | Low | Low | Low |
| DA ROSA et al., 201717 | Low | Low | Low | Low | Low |
| DASSIOS et al., 201630 | High | Unclear | Low | High | Low |
| DELGADO et al., 201516 | High | Low | Low | High | Low |
| DOMENECHCLAR et al., 20039 | High | Low | Low | High | Low |
| GAULTIER and ZINMAN, 198315 | High | Low | Low | High | Low |
| GOMES et al., 201431 | Low | Unclear | Low | Low | Low |
| HEINZMANN-FILHO et al., 201219 | Low | Low | Low | Low | Low |
| HULZEBOS et al., 201820 | Low | Unclear | High | Low | Low |
| LANZA et al., 201521 | Low | Low | Low | Low | Low |
| MARCELINO et al., 202237 | Low | Low | Low | Low | Low |
| MATECKI et al., 200338 | High | Low | Low | High | Low |
| MELLIES et al., 201427 | High | Unclear | Low | High | Low |
| MENDES et al., 201322 | High | Low | Low | High | Low |
| NASCIMENTO et al., 201229 | High | Low | Low | High | Low |
| OLIVEIRA et al., 201228 | High | Low | Low | High | Low |
| PAWAR et al., 202140 | High | Unclear | Low | High | Low |
| SMYTH et al., 19848 | High | Low | Low | High | Low |
| STEFANUTTI and FITTING, 199923 | High | Low | Low | High | Low |
| SZEINBERG et al., 198714 | High | Low | Low | High | Low |
| TAGAMI et al., 201724 | High | Unclear | Low | High | Low |
| TOMALAK et al., 200225 | High | Low | Low | High | Low |
| WAGENER et al., 198426 | High | Unclear | Low | High | Unclear |
| WILSON et al., 198410 | High | Low | Low | High | Low |
Figures 2 and 3 provide the MIP and MEP values analyzed separately by sex and the following age groups: 4–11 and 12–19 years old. Nineteen studies8,15-17,19-22,24,27-31,33-35,37,40 were included in the meta-analysis. The other nine9,10,14,23,25,26,32,36,38 studies were not included due to lack of data in the original articles, repeated data, or inability to contact the main authors. The mean MIP for female participants aged 4 to 11 years was 65.8 [95% CI (59.3, 72.3)] cmH2O and the MEP was 72.8 [95% CI (64.9, 80.8)] cmH2O. The mean MIP for male participants aged 4 to 11 years was 75.4 [95% CI (67.0, 83.9)] cmH2O and the MEP was 84.0 [95% CI (73.6, 94.3)] cmH2O. In the age group from 12 to 19 years, the MIP for the females was 82.1 [95% CI (73.0, 91.2)] cmH2O and the MEP was 90.0 [95% CI (78.8, 101.2)] cmH2O. For males aged 12 to 19 years, the mean MIP was 95.0 [95% CI (86.1, 104.0)] cmH2O and the MEP was 105.7 [95% CI (90.9, 120.5)] cmH2O. Additional information about the normal values of MIP and MEP can be found in supplementary material Tables S3, S4, and S5.


The coefficient of determination (R2) values of the 15 studies that presented reference equations of MIP and MEP ranged from 6.8% to 63%9,10,15,17,19,21,22,24,25,27,31-33,37,40: Arnall et al.32 from 8% to 26%; Arnall et al.33 from 15% to 33%; Da Rosa et al.17 from 13.9% to 21.6%; Gomes et al.31 from 25% to 63%; Domenech-Clar et al.9 from 21% to 51%; Gaultier and Zinman15 from 10% to 33%; Heinzmann-Filho et al.19 from 41% to 59%; Lanza et al.21 from 27% to 34%; Mendes et al.22 was 27%; Tagami et al.24 from 13% to 21%; Tomalak et al.25 from 9.1% to 28%; Wilson et al.10 from 10.8% to 35.6%; and Marcelino et al.37 from 6.8% to 18.9%. The studies from Mellies et al.27 and Pawar et al.40 did not present the R2 values.
The studies by Lanza et al.,21 Mendes et al.,22 and Pawar et al.40 formulated a unique equation in which dichotomous data were used to differentiate between sexes, while other studies9,10,15,17,19,24,25,27,31-33 formulated one equation for females and another for males. In contrast, Marcelino et al.37 proposed an equation for MIP in which dichotomous data were used to differentiate sexes, and for MEP, they provided one equation for females and another for males. The studies by Arnall et al.,32 Arnall et al.,33 and Marcelino et al.37 reported the lower limit of normal for MIP and MEP. In the study by Tomalak et al.,25 specific equations were developed for the sitting and standing position tests. All details are described in the supplementary material (S5).
DiscussionThis systematic review with meta-analysis presented normative values and reference equations used worldwide for MIP and MEP in healthy children and adolescents. Moreover, normative values based on these measures were proposed by the meta-analysis, which included 5798 participants from 15 countries.
All studies in this review defined individuals as healthy, without respiratory dysfunction that could interfere with the MRP test, thus providing normative values. However, only a few studies8,14,17,19,20-22,25-27,31,36,37 performed spirometry to ensure that there was no impairment of lung function.
It is observed that the initial volume of maneuvers is a variable that influences the MRP values,1 and most studies8-10,14,16,17,19-22,25,26,28-30,32,33,35,36,37,40 obtained MIP and MEP data from RV and TLC, respectively. Previous studies performed MRP tests based on functional residual capacity (FRC) and tidal volume (TV). It is noteworthy that, when in the RV volume, the elastic recoil pressure is of the order of 30cmH2O, which results in an increase of up to 30% in the MIP value, the same occurring when in the TLC volume for MEP, with an increase of 40cmH2O.1 Thus, the MRP must always be performed from the same volume.
Only half of the studies16,17,19-23,28,30-33,36,37,40 described the sample's BMI values, which were classified as underweight and normal weight. Although the BMI is not very accurate in the pediatric population due to growth spurts and the wide variation in height and weight measured according to age,40 only the study by Heinzmann-Filho et al.19 used the reference values for the diagnosis of the nutritional status of the BMI curves for age, recommended by the World Health Organization. The uncertainty of being healthy concerning pulmonary function and the lack of BMI regular references may represent a risk of bias for studies, knowing that there is a positive relationship between these variables and MRP values.9,10,15,37
There were a variety of types of mouthpieces used in the studies included in the review. Previous studies have investigated the influence of different interfaces on the ability to generate MRP. Gibson41 did a study comparing a tube with a flanged mouthpiece, concluding that the tube mouthpiece produces higher MIP and MEP values. But, the flanged one was more comfortable and better adaptable to the individual. Onaga et al.42 compared a circular mouthpiece with a rectangular mouthpiece. The results showed that the more anatomical shape of the rectangular mouthpiece resulted in higher values only in the MEP test. Montemezzo et al.43 compared a flat plastic with a silicone rubber mouthpiece, and there was no statistically significant difference between the MRP values. However, all these studies were conducted with the adult population. In this review, the most used mouthpiece was the rigid, flat, plastic mouthpiece.10,21,22,28,29 The recommendation of the ATS/ERS scientific societies indicates that, although the flanged mouthpiece produces lower MRP values due to greater air leakage, it is the preferred device. Furthermore, this type of mouthpiece is recommended for the population with neuromuscular weakness.1 On the other hand, the rubber tube mouthpiece may be preferable for research.11
The assessment of the quality of studies using QUADAS-2 presented some difficulties as the description of the MRP tests was incomplete in several studies.20,24,26,27,30-32,34,35,40 The lack of information draws attention to the need for standardization of the tests. Moreover, there is no way of knowing whether what was not actually described was not performed or just not reported. This compromises an accurate risk of bias assessment so that the study can be classified with uncertainty. In addition, a high risk of bias was considered in the Patient selection for studies that did not report BMI8-10,14,15,24-27,29,34,35,38 or pulmonary function values,9,10,15,16,23,24,28-30,32–35,38,40 as they are two variables of influence for the MRP tests. Only 28% of the studies presented information on these two variables.17,19-22,31,36,37
Not all studies9,10,14,23,25,26,32,36,38 of the systematic review were included in the meta-analysis, but were properly presented for all. Among the nineteen studies,8,15-17,19-22,24,27-31,33-35,37,40 it was possible to identify that the boys had higher MIP and MEP values than girls, regardless of age group. In addition, the values increased with increasing age, emphasizing the importance of distinguishing normal values for children and adolescents through age group classifications. It is also noted that the MEP values, both for girls and boys, were higher than the MIP values for all ages. Additionally, large 95% CI values were observed for MIP and MEP, mainly for the 12 to 19 age group. These results are expected, considering inter-subject variability, dependent on age, sex, and anthropometric characteristics, in addition to methodological differences between studies, contribute to these wide CI values for MRP.40 Thus, this variability needs to be considered when using the meta-analysis normative values during the interpretation of the results obtained in the evaluation of MIP and MEP.
Regarding the reference equations for MIP and MEP, most studies9,10,15,17,19,21,22,24,25,27,31-33,37,40 described the R2, the highest value was 63%, and the lowest was 6.8%. The greater the R2, the greater the adjustment of the dependent variable of the sample and the explanatory power. Only three studies17,19,22 reported the standard error of the estimate, and as expected, this measure decreased as the sample increased. The standard error reflects a greater accuracy of the estimate for sample size.
The limitation of this study was the methodological assessment of the quality of the studies using the QUADAS-2 tool, which was considered very subjective. To minimize this problem, a checklist consisting of items from each study was created for standardization. A method that does not prevent misclassifications but minimizes them. However, it is the tool available in the literature for this purpose, recently used in studies with the same purpose.44,45 Another limitation of this systematic review was the absence of pulmonary function (FEV1 and FVC) and BMI data, which would allow for additional analyses. Although the authors of the studies were contacted, there was little success in obtaining this information.
This review has two major points regarding its applicability: 1) the presentation through the systematic review of normative values and reference equations for MIP and MEP according to age groups and sex, as well as the specificities and methodological quality of each study; and 2) a meta-analysis of the normative values of 19 studies, providing 95% CI for MIP and MEP, representing a more powerful sample than that of the individual studies, which can add to the interpretation of normative values. Therefore, our findings provide additional sources of information to guide professionals in interpreting the results obtained during the assessment of respiratory muscle strength in children and adolescents, as well as to propose interventions.
In addition, based on the results of our study, specifically for clinical practice, readers should consider the nationality of the study and opt for the use of reference equations developed for the country of origin. As reported by Lanza et al.,21 ethnicity can influence respiratory muscle strength reference values. Thus, regional values are preferable when determining normal values for MIP and MEP. It is also recommended to observe the values of the R2 between studies of the same nationality, with the selection of equations with higher values of R2 and those with better methodological quality.
ConclusionThis systematic review and meta-analysis suggested normative values for MIP and MEP in children and adolescents. By bringing together several samples and defining values from age and sex groups, this study can contribute to clinical practice, functional diagnosis, scientific research, and appropriate care for this population.
We thank the following: the authors from the articles included in this study for sending the data requested and for all their contributions; the Programa de Bolsa de Iniciação Científica from UDESC for providing a scientific initiation scholarship to Nicole Pradi and Olivia Ramalho; the Coordenação de Aperfeiçoamento de Pessoa de Nível Superior (CAPES) (Financial Code 001) and Fundação de Amaparo à Pesquisa e Inovação do Estado de Santa Catatina (FAPESC) for providing a master's scholarship to Maiqueli Arpini and Emanuella Cristina Cordeiro.


