
Individuals with stroke demonstrate low levels of physical activity. Self-report measures of physical activity are frequently used and the choice of the best one to use for each purpose and context should take into account the measurement properties of these instruments.
ObjectiveTo summarize the measurement properties and clinical utility of self-report measures of physical activity of post-stroke subjects and to evaluate both the methodological quality of the studies and the quality of the measurement properties.
MethodsSearches were made in MEDLINE, EMBASE, PEDro, LILACS, and SCIELO. Two reviewers independently screened studies that investigated measurement properties or clinical utility of self-report measures of physical activity in post-stroke subjects. The studies’ methodological quality, quality of the measurement properties, and clinical utility were evaluated.
ResultsFrom the 11,826 identified studies, 19 were included. Six self-report tools were evaluated: The Activity card sort, Coded activity diary, Frenchay activities index (FAI), Human activity profile (HAP), Multimedia activity recall for children and adults, and the Nottingham leisure questionnaire. The methodological quality of the studies ranged from “poor” to “good”. Most of the results regarding the quality of the measurement properties were doubtful. None of the self-report tools had their content validity investigated. The FAI and HAP showed the highest clinical utility scores.
ConclusionsContent validity needs to be better investigated to determine if the instruments actually measure the physical activity domain. Further studies with good methodological quality are required to assist clinicians and researchers in selecting the best instrument to measure physical activity levels.
Physical inactivity is globally recognized as a major cause of morbidity and is the fourth leading risk factor for mortality.1 Individuals with stroke demonstrate low levels of physical activity, which increase the risks for further cardiovascular diseases and stroke-related disabilities.2 The use of appropriate instruments to measure physical activity levels is important for determining trends over time, the effects of interventions, and the health benefits of physical activity.3
Physical activity is defined as any bodily movement produced by skeletal muscle contractions, which increases energy expenditure.4 Physical activity can be measured by self-report (e.g., questionnaires, diaries/logs, surveys, and interviews) or direct assessment tools (e.g., pedometers, accelerometers, and activity monitors).5 Self-report measures are frequently used due to their practicality, since most of them are easy to administer, have low cost, provide information regarding various types and intensities of activities, and may be used within a variety of contexts.6
A large number of questionnaires of self-report physical activity assessment tools for the adult population have been developed.3,7 The choice of the best instrument to use for each purpose and context should take into account the characteristics of the instruments, especially their measurement properties (validity, reliability, and responsiveness) and clinical utility (the practicalities of using the measurement tools).8
Two systematic reviews3,7 assessed the measurement properties of self-report physical activity tools in healthy adults. The authors highlighted limited investigated measurement properties of the evaluated tools and the low methodological quality of the included studies. Despite the important contribution of these systematic reviews,3,7 they did not included people with chronic diseases, such as stroke patients. The results from studies aimed at evaluating the measurement properties of a tool in one population cannot be systematically generalized to others.8
A systematic review9 with chronically ill patients and elderly subjects assessed the development process and initial validation of self-report tools for the measurement of physical activity levels. Although some studies with post-stroke individuals were included, the search strategy was not specific for this population and the results regarding the measurement properties of the identified tools, specifically for subjects with stroke, were not reported. There was found only one systematic review,10 which investigated the measurement properties of physical activity assessment tools specifically for post-stroke subjects, but only direct assessment tools were assessed.
Therefore, the objectives of this systematic review were to summarize both the measurement properties and clinical utility of self-report measures of physical activity levels of subjects with stroke and to evaluate both the methodological quality of the studies on measurement properties and the quality of the measurement properties.
MethodsThis study was reported using the Preferred Reporting Items for Systematic Reviews and Meta-Analysis statement guidelines.11 The protocol of this systematic review has been registered on the International Prospective Register of Systematic Reviews (#CRD42016037146; http://www.crd.york.ac.uk/PROSPERO/) and was recently published.12
Data sources and searchesThe following electronic databases were searched: Medical Literature Analysis and Retrieval System Online, Excerpta Medica Database, Physiotherapy Evidence Database, Literatura Latino-Americana e do Caribe em Ciências da Saúde, and Scientific Eletronic Library Online. Databases were searched from their inception to December 2018. The reference lists of the included studies were also screened, to identify further studies. The search strategy was previous published,12 and included words related to four components: (1) health condition (stroke), (2) outcome measure (physical activity), (3) measurement properties, and (4) self-report measures.
Study selectionDetails regarding the eligible studies were described in the previous published protocol.12 All full-text papers which investigated the measurement properties and/or clinical utility of self-report measures of physical activity levels in individuals with stroke were included. To be considered as self-report measures of physical activity levels, the authors should clearly state that the instrument provided a measure of physical activity or a measure of one of the dimensions of the physical activity (i.e. duration, frequency, or intensity). Studies published in English, Spanish, French, and Portuguese with adults (≥18 years of age), who had a stroke, were included, without further restrictions. Studies, which reported a specific activity, such as walking, exercise capacity, gait patterns, or the ability to perform activities of daily living, were excluded, as well as systematic reviews and studies with other neurological conditions, not related to stroke.
Two reviewers independently assessed the titles and abstracts of all identified records from the electronic searches. Full-text articles were screened for eligibility by the same reviewers. Disagreements were resolved by discussion and consensus. When, required, a third reviewer was consulted.
Data extraction and quality assessmentRelevant data from all the included studies were summarized in tables, as described in the published protocol.12 When the general characteristics of the self-report physical activity measures could not be extracted from the included studies, the original paper was consulted, to obtain the necessary information to be summarized.
The same reviewers independently assessed the methodological quality of the studies, the quality of the measurement properties, and the clinical utility. A third rater was available to solve any discrepancies.
Assessment of the methodological quality of the included studies using the COSMIN taxonomyThe COnsensus-based Standards for the selection of health Measurement INstruments (COSMIN) checklist was used to determine the methodological quality of the included studies.13,14 In the COSMIN, nine measurement properties clustered within three domains, i.e. reliability, validity, and responsiveness, are considered relevant for the evaluation of outcome measurement instruments.14 In the reliability domain, internal consistency, test-retest, inter-and intra-rater reliability, as well as measurement errors, are assessed. In the validity domain, construct validity (structural validity and hypotheses testing), criterion-validity and content validity are assessed. By taking the lowest item rating, an overall quality score (‘poor,’ ‘fair,’ ‘good,’ ‘excellent’) was separately obtained for each evaluated measurement property.14
Quality of the measurement property using the Terwee's criteriaTo assess the quality of the measurement properties, the criteria proposed by Terwee et al.15 was applied to the results of a study on measurement properties. Terwee et al.15 defined criteria for what constitutes good measurement properties. For example, for the assessment of validity, it is often recommended that hypotheses about expected results be tested, but no criteria have been defined about how many hypotheses should be confirmed to justify that a questionnaire has good validity. No criteria have been defined for what constitutes good agreement (acceptable measurement error), good responsiveness, neither for the required sample size of studies assessing measurement properties. Each measurement property is rated as positive (+), negative (−), or doubtful/indeterminate (?), depending upon the design, methods, and outcomes of the study.15 If a clear description of the design of the study is lacking, the evaluated measurement properties are rated as doubtful.15 In addition, if any important methodological weaknesses in the design or execution of the study are found, e.g., selection bias or an extremely heterogeneous study population, the evaluated measurement properties are also rated as doubtful.15 These criteria15 complement the evaluation of the measurement properties, since the COSMIN does not determine the cut-off values, which are considered adequate for the statistical analyses.16 In other words, the fact that a study used some statistics advocated by the COSMIN, does not guarantee the quality of the measurement property, as appropriated values may not have been reached.15,16
Clinical utilityThe clinical utility (feasibility) was assessed to quantify the practicalities of the identified tools. Previously developed criteria based upon factors that may influence whether clinicians would use a measurement tool in their practice17,18 were used: application time, cost, need of specialized equipment/training, portability and accessibility. Both the item and the total scores (maximum of 12 points) were reported.18
Data synthesisA systematic narrative synthesis was provided in text and table formats, to summarize and discuss the sample and methodological characteristics, as well as the findings regarding the measurement properties and clinical utility of the included studies on self-report measures of physical activity levels in individuals with stroke. Measures, which were investigated in more than one study, were grouped and the references of all studies were cited.
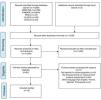
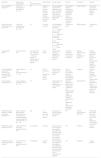
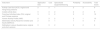
ResultsThe electronic searches returned a total of 11,826 studies (300 were duplicates) and after the initial selection based upon the titles and abstracts, 90 were potentially eligible. Fig. 1 shows the flow of the studies through this review, including the reasons for exclusion. After screening the full-texts, 17 studies met the eligibility criteria. Two other relevant studies were found by screening the reference lists of the included articles. Therefore, 19 studies were included in this systematic review.19–37 The following six self-report measures of physical activity levels were identified, three of them in two different versions:19,21,24 The Activity Card Sort (ACS and ACS-Hong Kong version),19,34 Coded Activity Diary,35 Frenchay Activities Index (FAI and FAI-chinese version),23–32,36,37 Human Activity Profile (HAP),33 Multimedia Activity Recall for Children and Adults (MARCA),22 and the Nottingham Leisure Questionnaire (original and short versions).20,21 These measures are described in Table 1.
Description of the self-report physical activity assessment tools for subjects with stroke.
| Instrument | Type/Time of Administration | N° questions/activities | Recall Period | Answer options | Scoring | Dimensions | Domains |
|---|---|---|---|---|---|---|---|
| Activity Card Sort (ACS)34,43,* | Type: Sort photographs of activitiesTime: 20min | 80 | Activities in which a person is currently involved, compared to those he/she was involved in the past | Sort photographs into one of five categories: never done, still doing, given up due to stroke, do less due to stroke, and started after stroke | Percentage of retained-activity level, calculated by dividing the total sum of current activities by the total sum of previous activities | ModeFrequency | Instrumental, social, and high- and low-physical-demand leisure |
| Activity Card Sort - Hong Kong version (ACS-HK)19 | Type: Sort photographs of activitiesTime: 20min | 65 | The same as above | Sort photographs into one of five categories: 1=not done prior to current illness/injury; 2=continued to do during illness/injury; 3=given up due to illness/injury; 4=beginning to do again; 5=a new activity | The same as above | ModeFrequency | The same as above |
| Coded activity diary35 | Type: DiaryTime: NR | List of 63 codes into categories in four columns: (1) time, (2) activity, (3) position, and (4) intensity of the activity | 30-min period | Choose the 63 codes into categories of activities and inform the position | Perceived intensity of each activity is rated on a 6–20 scale. | Intensity (MET.min and energy expenditure in kcal/min) | Selfcare, household tasks, work, therapy, leisure and home activities, and activities related to mobility and transport |
| Frenchay Activities Index (FAI)44,45,* and Frenchay Activities Index – Chinese version (FAI-C)24 | Type: Interview or mail questionnaireTime: 5min | 15 | First 10 items: past 3 monthsLast 5 items: past 6 months. | 4-point scale: 0 (never) to 3 (at least once a week) | Sum of itemsTotal score ranges from 0 (no participation) to 45 (frequent participation) | Frequency | Daily and social activities: domestic, work/leisure, and outdoors/other |
| Human Activity Profile (HAP)33,46,* | Type: self-report questionnaireTime: 20min | 94 | 3-point scale: still doing, have stopped doing’, or ‘never did the activity | Maximum activity score (MAS): sum of activities the subjects are still doingAdjusted activity score (AAS): subtract the number of activities that the respondent had discontinued performing from MAS | Intensity (MET) | Self-care, transportation, home maintenance, entertainment, social, and physical exercises | |
| Multimedia Activity Recall for Children and Adults (MARCA)22,47,* | Type: Computer delivered/time-diary format, self-administered or computer assisted personal/telephone interviewTime: 15–20min | 300 | 24h period in time slots of 5min or more | Choose one of the 300 activities and inform the duration | NA | Duration (min/d)Intensity (MET.min) | Total sitting time, screen time, quiet time, sleep, social, self-care, work/study, chores (indoor and outdoor) |
| Nottingham Leisure Questionnaire20,48,* | Type: Interview or self-report questionnaireTime: NR | 37 categories | Last year | Yes/no options.If the answer was yes, subjects were asked how often the activity was carried-out on a 5-point scale: never to very regularly | NR | Frequency | Leisure activities |
| Nottingham Leisure Questionnaire (short version)21 | Type: Interview or self-report questionnaireTime: NR | 30 categories | Last few weeks | Yes/no options.If the answer was yes, subjects were asked how often the activity was carried out in 3-point scale: 0- never, 1-ocassionally, 2-regularly | NR | Frequency | Leisure activities |
NA, not applicable; NR, not reported.
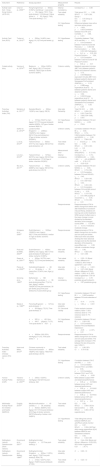
The 19 included studies19–37 involved 2411 participants with stroke, aged between 56 and 79 years and time since the onset of the stroke ranging from 6 days to 22 years. Table 2 presents the characteristics of the studies, as well as the investigated measurement properties and the results of the included studies.
Characteristics of the included studies and measurement properties of self-report physical activity assessment tools for subjects with stroke.
| Instrument | Reference | Study population | Measurement property | Results |
|---|---|---|---|---|
| Activity Card Sort - Hong Kong Version (ACS-HK) | Chan et al., 200619 | Hong Kong/Chinan=60Sex: 31(52%) menGroup 1: Less active (n=30), Age(y): 75(7), Time post-stroke(y): 1(0.2)Group 2: More active (n=30), Age(y): 74(6), Time post-stroke(y): 1(1) | Internal consistency | Cronbach's α=0.89 |
| Test–retest reliability | Total group: ICC=0.98, 95%CI=0.97–0.99; Group 1: ICC=0.91;Group 2: ICC=0.92 | |||
| CV: Hypotheses testing | Difference between less active and more active groups: t=−1424, p=0.001Correlation between ACS-HK and ComQOL: r=0.86, p=0.001 | |||
| Activity Card Sort (ACS) | Tucker et al., 201234 | n=29Sex: 14(48%) men; Age(y): 61(13)Time post-stroke (y): 4(3) | CV: Hypotheses testing | Correlation between Total ACS and RNL: r=0.51, p=0.01Correlation between Total ACS and SIS Recovery r=0.38; SIS Communication r=0.46, p=0.05; SIS Participation r=0.41, p=0.05; SIS Physical Domain r=0.64, p=0.01Correlation between Total ACS and SF-36 Physical Function: r=0.60, p=0.01 |
| Coded activity diary | Vanroy et al., 201435 | Belgiumn=16Sex: 9(56%) men; Age(y): 68(11)Time post-stroke(d): 78(53)Type of stroke: ischemic 9(56%) | Criterion validity | Metabolic equivalent minutes (MET.min) between patient's diaries and observer's diaries: rs=0.75, p=0.001Metabolic equivalent minutes (MET.min) between patient's diaries and Sensewear Pro2 armband (SWP2A): rs=0.15, p=0.59Energy expenditure (kcal/12h) between patient's diaries and observer's diaries: rs=0.92, p=0.0001Energy expenditure (kcal/12h) between patient's diaries and Sensewear Pro2 armband (SWP2A): rs=0.29, p=0.28 |
| Frenchay Activities Index (FAI) | Monteiro et al., 201727 | Salvador/Braziln=36Sex: 13(36%) men; Age(y): 58(18) | Inter-rater Reliability | Total FAI: ICC=0.83, 95%CI=0.69–0.91; p<0.001;Total FAI: K=0.66 (0.54–0.68); p<0.001 |
| n=161Sex: 50(31%) men; Age(y): 57(17)Time post-stroke(d): median 6(IQR4–12)Type of stroke: ischemic 98(61%) | CV: Hypotheses testing | Correlation between FAI and NIHSS: rs=−0.23, p=0.004 | ||
| Sarker et al., 201230 | London/United Kingdomn=238Sex: 124(52%) men; Age(y): 69(14)Time post-stroke(mo): 3Type of stroke: ischemic 205(86%) | Criterion validity | Correlation between FAI and BI: rs=0.80, 95%CI=0.74–0.84Correlation between FAI and NEADL: rs=0.90, 95%CI=0.88–0.92 | |
| Lu et al., 201226 | Taiwan/Chinan=52Sex: 37(71%) men; Age(y): 59(12)Time post-stroke(mo): >6 | Test–retest reliability | t=0.0(3.5), p=0.94; ICC=0.89, 95%CI=0.81–0.93; LoA=6.9 | |
| Measurement error | SEM=2.4; SRD(SRD%)=6.7(14.9) | |||
| Lin et al., 201225 | Taiwan/Chinan=127Sex: 93(73%) men; Age(y): 55(12)Time post-stroke(mo): 17(16)Type of stroke: infarction 50(39%) | Internal consistency | Cronbach's α=0.73–0.81MNSQ infit=0.63–1.49; t=−4.9–4.9MNSQ outfit=0.76–1.37; t=−3.20–3.20 | |
| Wu et al., 201137 | Taiwan/Chinan=70Sex: 46(66%) men; Age(y): 56(12)Time post-stroke (mo): 20(13) | Criterion validity | Correlation between FAI and NEADL: rs=0.80, 95%CI=0.70–0.90, p<0.01Correlation between FAI and SIS/ADL: rs=0.40, 95%CI=0.20–0.60, p<0.01; SIS/Total: rs=0.40, 95%CI=0.20–0.60, p<0.01;Correlation between FAI and MAL/amout of use: rs=0.30, 95%CI=0.10–0.50, p<0.01; MAL/quality of movement: rs=0.30, 95%CI=0.10–0.50, p<0.01 | |
| Responsiveness | Responsiveness of FAI to detect change from before and after treatments of constraint-induced theray, bilateral arm training and control treatment. SRM (variant of effect size) is the mean change in score divided by the standard deviation of the changed scores.SRM=0.5, 95% CI=0.3–0.7 indicate a moderate change | |||
| Schepers et al., 200631 | Dutch/Germann=163Sex: 102(63%) men; Age(y): 56(11)Time post-stroke(d): median 41Type of stroke: ischemic 121(74%) | Responsiveness | Responsiveness of FAI to detect change from six months and one year post stroke. Effect size were calculated dividing the mean absolute change score by the standard deviation of the baseline score.Effect size=0.59 indicate a moderate change | |
| Post and de Witte, 200329 | Dutch/Germann=45Sex: 26(58%) men; Age(y): 56(11)Time post-stroke(w):31(32)Type of stroke: ischemic 31(69%) | Inter-rater reliability | ICC=0.90, 95%CI=0.82–0.94; K=0.41–0.90 | |
| Green et al., 200123 | n=22Sex: 16(73%) men; Age(y): 72(7)Time post-stroke(mo): 15(0.5) | Test–retest reliability | K=0.25–1.0; Bland Altman: difference of −0.60(3.5), 95% limits of agreement −2.21–0.93. | |
| Piercy et al., 200028 | Oxfordshire/Englandn=68 (n=33 stroke, n=35 carers)Sex: 27(40%) men; Age (y): 71(15) | Inter-rater reliability | rs=0.93, p<0.001; K=0.27–0.80; Bland Altman: difference 0.76(5), median –1(IRQ −4–2), 95% limits of agreement −9.9–8.4 | |
| Schuling et al., 199332 | Netherlandn=188 (n=92 pre-stroke, n=96 post-stroke group)Sex: 77(41%) men; Age(y): median 76(IQR10)Time post-stroke(w): 26 pre-stroke groupTime post-stroke(mo): 6 post-stroke group | Internal consistency | Cronbach's α=0.78 prestroke groupCronbach's α=0.87 poststroke group | |
| CV: Hypotheses testing | Correlation between FAI and BI: r=0.66Correlation between FAI and subscales of SIP: r=−0.14−(−0.73) | |||
| Wade et al., 198536 | Frenchay/Englandn=14Time post-stroke(w): 1 | Inter-rater reliability | rs=0.80, p<0.001 | |
| n=581Age(y): 72(10); Time post-stroke(w): 3 | CV: Structural validity | Factor analysis (varimax rotation): factor 1–30% variance, factor 2–17% variance, factor 3–7% variance | ||
| n=935 (n=491 6mo, n=444 1y)Age(y): 71(10); Time post-stroke: 6mo/1y | CV: Hypotheses testing | Correlation between FAI and BI: r=0.60–0.65, p<0.01Correlation between FAI and Wakefield Depression: r=−0.35−(−0.37), p<0.01 | ||
| n=383Sex: 200 (52%) menAge(y):71(10); Time post-stroke: 1y | Responsiveness | Responsiveness of FAI to detect change from six months and one year post stroke. The average (SD) increase in FAI between the two-time points was 1.26(6.1) | ||
| Frenchay Activities Index - Chinese version (FAI-C) | Imam and Miller, 201224 | Chinese community in Vancouver/Canadan=66Sex: 19(29%) men; Age(y): 79(9)Time post-stroke(y): 22(10) | Test–retest reliability | ICC=0.86, 95% CI=0.79–0.92 |
| CV: Hypotheses testing | Correlation between FAI-C and RNL: r=0.61, p<0.01Correlation between FAI-C and ABC: r=0.55, p<0.01Correlation between FAI-C and TUG: r=−0.68, p<0.001 | |||
| Human Activity Profile (HAP) | Teixeira-Salmela et al., 200733 | n=24Sex: 13(54%) menAge(y): 64(12)Time post-stroke(y): 2(2) | Criterion validity | MAS between subject HAP and observed performance: r=0.95, p<0.01MAS between proxy HAP and observed performance: r=0.80, p<0.01AAS between subject HAP and observed performance: r=0.99, p<0.01AAS between proxy HAP and observed performance: r=0.87, p<0.01 |
| Multimedia Activity Recall for Children and Adults (MARCA) | English, 201622 | Meulborne/Australian=40 (validity: n=36, reliability: n=30)Sex: 26(65%) men; Age(y): 67(11)Time post-stroke(y): 4(10)Type of stroke: ischemic 29(73%)Severity of stroke: mild 34(85%) | Test–retest reliability | ICC=0.83, 95%CI=0.68–0.92 for total scoreICC=0.95, 95%CI=0.89–0.97 for superdomains |
| CV: Hypotheses testing | Total sitting time (min/d) between MARCA and activPAL3 activity monitor: ICC=0.67, 95%CI=0.38–0.84Total daily energy expenditure (Kj/d) between MARCA and Sensewear armband: ICC=0.62, 95%CI=0.32–0.80 | |||
| Nottingham Leisure Questionnaire (short version) | Drummond et al., 200121 | Nottingham/United Kingdonn=121Time post-stroke(y): 1 | Test–retest reliability | K=0.44–0.94; Bland and Altman: difference −0.25(3.23), 95% limits of agreement 6.21−(−6.71) |
| Nottingham Leisure Questionnaire | Drummond and Walker, 199420 | Nottingham/United Kingdonn=20Sex: 11(55%) men; Age(y): 73(9)Time post-stroke(d): 654(178) | Inter-rater reliability | K=0.65–1.0 |
| n=21Sex: 12(57%) men; Age(y): 73(9)Time post-stroke(d): 477(50) | Test–retest reliability | K=0.23–1.0 |
CV, construct validity; BI, Barthel Index; NEADL, Nottingham Extended Activities of Daily Living; SIS, Stroke Impact Scale; MAL, Motor Activity Log; RNL, Reintegration to Normal Living Scale; ABC, Activities-specific Balance Confidence Scale; TUG, Timed Up and Go; SIP, Sckiness Impact Profile; NIHSS, National Institutes of Health Stroke Scale; ComQOL, Comprehensive Quality of Life Scale; SF-36, 36-item Short-Form Medical Outcomes Study; MAS, Maximum Activity Score; AAS, Ajusted Activity Score; SEM, Standard Error of Measurement; SRD, Smallest Real Difference; MNSQ, Mean Squares; SRM, Standardized Response Mean.
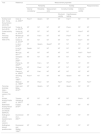
The methodological quality of the included studies ranged from “poor” to “good”, based upon the COSMIN scores (Table 3). Three studies investigated internal consistency: two showed “poor”, ACS19 and FAI,32 and one “good”, FAI,25 methodological quality. Reliability was analyzed in 11 studies: three showed “poor”, FAI23,36 and Nottingham Leisure Questionnaire,20 five “fair”, FAI,27–29 MARCA22 and Nottingham Leisure Questionnaire,21 and three “good”, ACS19 and FAI,24,26 methodological quality. Measurement error was described in one study with “good”, FAI,26 methodological quality. Validity was evaluated in 12 studies and methodological quality was rated as “poor” in six, ACS,34 Coded Activity Diary,35 FAI,27,36 HAP,33 and Nottingham Leisure Questionnaire,21 “fair” in five, ACS,19 FAI,29,35,36 and MARCA,22 and “good” in two studies, FAI.24,31 The most investigated type was construct validity (hypotheses testing) in eight studies, ACS,19,34 FAI,24,27,32,36 MARCA,22 and Nottingham Leisure Questionnaire.21 Responsiveness was analyzed in three studies and showed “fair” methodological quality, FAI.31,36,37 Content validity was never investigated by any of the included studies (Table 3).
| Tool | Reference | Measurement properties | ||||||
|---|---|---|---|---|---|---|---|---|
| Reliability | Validity | Responsiveness | ||||||
| Internal consistency | Reliability | Measurement error | Construct Validity | Criterion validity | ||||
| Structural validity | Hypotheseses testing | |||||||
| Activity Card Sort - Hong Kong Version (ACS-HK) | Chan et al., 200619 | Poor/? | Good/+ | NT | NT | Fair/? | NT | NT |
| Activity Card Sort (ACS) | Tucker et al., 201234 | NT | NT | NT | NT | Poor/+ | NT | NT |
| Coded activity diary | Vanroy et al., 201435 | NT | NT | NT | NT | NT | Poor/? | NT |
| Frenchay Activities Index (FAI) | Monteiro et al., 201727 | NT | Fair/+ | NT | NT | Poor/? | NT | NT |
| Sarker et al., 201230 | NT | NT | NT | NT | NT | Fair/? | NT | |
| Lu et al., 201226 | NT | Good/+ | Good/? | NT | NT | NT | NT | |
| Lin et al., 201225 | Good/+ | NT | NT | NT | NT | NT | NT | |
| Wu et al., 201137 | NT | NT | NT | NT | NT | Fair/? | Fair/? | |
| Schepers et al., 200631 | NT | NT | NT | NT | NT | NT | Fair/? | |
| Post et al., 200329 | NT | Fair/+ | NT | NT | NT | NT | NT | |
| Green et al., 200123 | NT | Poor/- | NT | NT | NT | NT | NT | |
| Piercy et al., 200028 | NT | Fair/- | NT | NT | NT | NT | NT | |
| Schuling et al., 199332 | Poor/? | NT | NT | NT | Good/+ | NT | NT | |
| Wade et al., 198536 | NT | Poor/- | NT | Fair/? | Poor/? | NT | Fair/? | |
| Frenchay Activities Index – Chinese version (FAI-C) | Imam and Miller, 201224 | NT | Good/+ | NT | NT | Good/+ | NT | NT |
| Human Activity Profile (HAP) | Teixeira-Salmela et al., 200733 | NT | NT | NT | NT | NT | Poor/+ | NT |
| Multimedia Activity Recall for Children and Adults (MARCA) | English, 201622 | NT | Fair/+ | NT | NT | Fair/? | NT | NT |
| Nottingham Leisure Questionnaire (short version) | Drummond et al., 200121 | NT | Fair/− | NT | NT | Poor/? | NT | NT |
| Nottingham leisure questionnaire | Drummond and Walker, 199420 | NT | Poor/− | NT | NT | NT | NT | NT |
NT, not tested; (+), positive; (−), negative; (?), doubtful.
Based upon the Terwee et al.15 criteria, 15 studies were classified as doubtful/indeterminate (Table 3): two studies on internal consistency, ACS19 and FAI,32 one on measurement error, FAI,26 eight on validity, ACS,19 Coded activity diary,35 FAI,27,30,36,37 MARCA,22 and Nottingham Leisure Questionnaire,21 and three on responsiveness, FAI.31,36,37 Positive ratings were reported by the following 11 studies: one on internal consistency, FAI25 (Cronbach's α=0.73–0.81); six on reliability, ACS,19 FAI,24,26,27,29 and MARCA22 (intra-class correlation coefficients (ICCs) ranging from 0.83 to 0.98); and four on validity, ACS,34 FAI,24,32 and HAP33 (at least 75% of the results were in accordance with the established hypotheses or Pearson correlation coefficients (r) ranged from 0.80 to 0.99 (criterion validity). Only five studies were classified as negative on reliability, FAI23,28,36 and Nottingham Leisure Questionnaire20,21 and the reason for this was that the Kappa coefficients were below 0.7 for some items of the evaluated tools (Table 3).
Clinical utilityTable 4 reports the clinical utility (feasibility) of the measures included in this review. Most of the tools are simple ‘paper and pencil’ tests, which are freely available and, thus, scored high on the clinical utility criteria for cost, portability, and need of specialized equipment.18 When information was not found (unknown), the item scored zero, as previously adopted.38 The FAI and the HAP showed the highest clinical utility scores (Table 4).
Clinical utility of self-report physical activity assessment tools for subjects with stroke.
| Instrument | Application time | Cost | Specialized equipment/training | Portability | Accessibility | Total Score |
|---|---|---|---|---|---|---|
| Activity Card Sort (ACS): original and Hong-Kong versions | 2 | 2 | 1 | 2 | 2 | 9 |
| Coded activity diary | 0 | 3 | 2 | 2 | 2 | 9 |
| Frenchay Activities Index (FAI): original and Chinese versions | 3 | 3 | 2 | 2 | 2 | 12 |
| Human Activity Profile (HAP) | 2 | 3 | 2 | 2 | 1 | 10 |
| Multimedia Activity Recall for Children and Adults (MARCA) | 2 | 0 | 1 | 1 | 0 | 4 |
| Nottingham Leisure Questionnaire: original and short versions | 0 | 3 | 2 | 2 | 2 | 9 |
This review is the first to systematically appraise and summarize the evidence on the measurement properties and clinical utility of self-report physical activity assessment tools for individuals with stroke, taking the methodological quality of the included studies into account. Six self-report physical activity assessment tools were evaluated and their methodological quality ranged from “poor” to “good”. The majority of the results regarding the quality of the measurement properties were considered doubtful. The most investigated properties were reliability and construct validity. Content validity was never investigated by any of the studies included in this review. The FAI and the HAP showed the highest clinical utility scores.
Two systematic reviews3,7 with healthy adults described the International Physical Activity Questionnaire (IPAQ) as the most often used and validated self-report physical activity assessment tool. However, in the present review, none of the included studies investigated the measurement properties of the IPAQ in subjects with stroke. Only one self-report physical activity assessment tool included in the previous reviews3,7 was assessed in this present review: the HAP. This indicates that despite the high number of available self-report physical activity tools, only few had their measurement properties investigated for the stroke population.
Methodological flaws were identified in the majority of the studies which investigated internal consistency. It is recommended that internal consistency be assessed in two ways: through the classic approach (Cronbach's alpha coefficients) or by the item response theory (Rasch mathematical model).13–15 The majority of the studies that investigated internal consistency did not apply factor analysis to assess unidimensionality, which is the most recommended method to verify the number of dimensions into which the items are distributed.13–15
Reliability was the most investigated measurement property and six studies20,21,23,27,28,36showed negative results regarding the quality of this measurement property (ICC or weighted Kappa <0.70). The methodological quality of all these studies ranged from “poor” to “fair”, because of the small sample size (<50 participants). One study, published in 1985,36 was rated as “poor” because it employed Pearson correlation coefficients for analysis. Nowadays, there is a consensus that the recommended statistical tests for reliability are ICC and Kappa.13,14
The main deficiency regarding the analysis of the reliability domain was the lack of examination of measurement error, which was only reported in one study.26 Measurement error method offer an approach to quantitatively estimate the magnitude of the various sources of errors, which may influence the results.13,14 The low quality rating on the measurement error of the study26 was due to the lack of information regarding the smallest detectable change or minimal important change.
Construct validity was mostly investigated by hypothesis testing. For assessing this domain, it is important to formulate specific hypotheses.15 However, only two studies24,32 formulated such hypotheses. The methodological quality of these studies was rated as “good” and positive results on the measurement properties were found.24,32
The methodological quality of the four studies30,33,35,37 which investigated criterion-related validity ranged from “poor” to “fair” and doubtful results were found in three.30,35,37 These results were justified by the small sample (<50 participants) and the difficulty to establish an adequate gold standard tool for the assessment of physical activity levels. Only one study33 showed convincing arguments regarding the gold-standard measure, but had insufficient sample.
There were not found any studies which investigated the content validity of self-report physical activity tools for stroke subjects. When a measurement tool has adequate content validity, it means that its items cover the entire universe of interest, reflect the relative importance of each part of this universe, and is free from factors that are irrelevant to the purpose of the measure.8,15 Content validity assessment is an important step in the process of development and investigation of measurement properties of a tool. The confusion between content and face validities, as well as the lack of knowledge regarding the systematic methods already available for content validity investigation, have been pointed-out as the main factors related to the absence of information on content validity for the majority of the instruments used in the rehabilitation field.39–41
Only if the content validity of a questionnaire is adequate, one will consider using it and the investigation of other measurement properties is useful.39–41 Faced with this, the question is whether the instruments included in this review are actually considered measures of physical activity. The FAI, for example, is an instrument that contains some items related to physical activity and others related to the performance of activities of daily living. This demonstrates a certain conflict with the physical activity terminology, which was already pointed out by previous reviews.3,7 This demonstrates that the scientific literature needs to establish clearer criteria on what is a measure of physical activity, thus avoiding conflicts with the use of the terminology and facilitating the use of appropriate instruments.
Only three studies31,36,37 assessed the responsiveness of self-report physical activity tools in subjects with stroke. These studies had “fair” methodological quality and doubtful results on the measurement properties, due to the lack of reports on the smallest detectable change or minimal important change.15 Treatment effects cannot be detected if a self-report tool shows poor responsiveness.7,9 A systematic review42 which investigated the efficacy of interventions to increase physical activity levels after stroke reported the lack of self-report tools that had their responsiveness investigated for subjects with stroke.
The majority of the tools included in the present review did not meet all the criteria to be feasible for use in clinical practice. These results were due to lack of information on the duration20,21,35 and cost22 or because some of the tools are not freely accessible for the clinicians,19,34 or require specialized and not portable equipment.22 Both clinical utility and measurement properties should be considered when selecting the most appropriate instrument for use in clinical practice.
LimitationsIt is possible that some relevant papers were not retrieved by the electronic literature search, because of the variability in terminology regarding physical activity. However, a manual search in all of the references cited by the retrieved studies was performed in an attempt to avoid loss of information. The pre-established criteria to select self-report measures of physical activity levels based upon the authors statements, may have included instruments that do not provide real measures of physical activity. Therefore, it is necessary that future studies investigate the content validity of these instruments, based upon a clear definition of what physical activity is and follow systematical and rigorous process to correctly investigate this important measurement property.
ConclusionThe present systematic review highlights the paucity of studies that investigated the measurement properties of self-report physical activity assessment tools in subjects with stroke. Important measurement properties, such as content validity, need to be further addressed by well-designed studies, to determine if the instruments actually measure physical activity. The majority of the tools did not meet all the criteria to be feasible for use in clinical practice. Further high-methodological quality studies on self-report physical activity assessment tools in post-stroke subjects are required to assist clinicians and researchers in choosing the best instrument to measure physical activity levels.
Study organization and fundingFinancial support for this research was provided by national funding agencies: Coordenação de Aperfeiçoamento de Pessoal de Nível Superior (CAPES), Fundação de Amparo à Pesquisa do Estado de Minas Gerais (FAPEMIG), Conselho Nacional de Desenvolvimento Científico e Tecnológico (CNPq), and Pró-reitoria de Pesquisa da Universidade Federal de Minas Gerais (PRPq/UFMG). This financial support includes scholarships and research grants. These agencies are not involved in any other aspect of this study.
Authors’ contributionsAll authors contributed to the conception/design of the study and provided final approval of the version to be published.
Funding sourcesThis work was supported by Coordenação de Aperfeiçoamento de Pessoal de Nível Superior (CAPES), Fundação de Amparo à Pesquisa do Estado de Minas Gerais (FAPEMIG), Conselho Nacional de Desenvolvimento Científico e Tecnológico (CNPq), and Pró-reitoria de Pesquisa da Universidade Federal de Minas Gerais (PRPq/UFMG).
Conflicts of interestThe authors declare that they have no competing interests.


