


Diabetes with peripheral neuropathy can lead to metatarsophalangeal joint (MTPJ) deformity. The purpose of this study was to estimate the effect of a foot-specific intervention on MTPJ deformity. Secondary aims were determining MTPJ deformity progression over 3 years and predictors of MTPJ deformity progression.
MethodsSixty people with type 2 diabetes and peripheral neuropathy were recruited for this randomized controlled clinical trial. Participants were assessed at baseline, 6 months (post-intervention), 1.5 years, and 3 years. A 6-month, foot-specific intervention in the experimental group was compared to a shoulder intervention in the control group. The primary outcome was change in 2nd MTPJ angle assessed with computed tomography (CT).
ResultsThere was no effect of intervention on 2nd MTPJ angle (main effect of group p = 0.56, main effect of visit p = 0.56, group*visit interaction p = 0.79). In combined experimental and control groups, 26 % and 9 % of participants met the cutoff threshold for MTPJ angle progression at 1.5 and 3 years, respectively. Change in 2nd metatarsal bone mineral density from baseline to 3 years predicted 2nd MTPJ angle progression at 3 years (Rescaled R2 = 0.22, p = 0.01).
ConclusionThe study intervention was unable to yield a detectible improvement in 2nd MTPJ angle. The intervention may not have been of sufficient intensity to induce positive changes or there may be limited capacity for the neuropathic foot to respond to traditional modes of exercise. While useful in improving other outcomes, exercise-based intervention may not be an effective method of reducing or delaying forefoot deformity progression.
One-quarter of patients with diabetes mellitus (DM) will develop a foot ulcer, a common precursor to non-traumatic lower extremity amputation.1–4 Forefoot deformity or metatarsophalangeal joint (MTPJ) hyperextension deformity is present in 85 % of people with DM and a history of ulcers or amputation.5 Characteristics of MTPJ deformity include hyperextension of the proximal phalanx on the metatarsal. Previous work indicates that MTPJ angle is the most important structural variable predicting forefoot peak plantar pressure during walking, increasing the risk for skin breakdown.6
Although MTPJ deformity is a common and important acquired neuropathic foot deformity, there is little evidence to guide treatment to arrest deformity development and progression. An imbalance in foot intrinsic and extrinsic muscle strength resulting from motor peripheral neuropathy (PN)7,8 along with the repetitive MTPJ hyperextension movement pattern9 have been proposed to contribute to MTPJ hyperextension deformity; both are potential treatment targets.
A recent consensus statement identified 93.1 % agreement among experts that individuals with diabetes at risk of foot ulceration should be encouraged to participate in aerobic activities, strength training, and stretching.10 Exercise-based interventions demonstrate a variety of benefits in individuals with DM and PN (DMPN), including improvements in neuropathy measures11,12 and function (e.g. walking).13,14 Individuals with DMPN have shown increased range of motion12,13,15 and inconsistent strength12,14,16 improvements with targeted exercise-based intervention. Functionally, lower leg strengthening and stretching have been found to improve foot mechanics with gait,14 with inconsistent improvements in foot plantar pressures.12,14,17 Despite evidence supporting exercise-based interventions for individuals with DMPN, the effect of foot strengthening and range of motion exercise on foot deformity outcomes has not been described.
The specific aims of this study are to (1) estimate the effect of a foot-specific intervention on MTPJ extension angle and (2) determine progression of MTPJ deformity and the predictors of progression over three years. We hypothesized that foot-specific intervention would improve MTPJ extension alignment compared to a control group (receiving a targeted shoulder intervention) at 6 months, 1.5 years, and 3 years. We further hypothesized that MTPJ deformity would progress in 50 % of the individuals with DMPN at a rate of 4° every 1.5 years and that measures of advanced glycation end-products (AGE) levels, intrinsic foot muscle volume/quality, MTPJ extension excursion during sit-to-stand/walking, and bone mineral density (BMD) would predict progression of MTPJ deformity. This hypothesis was based on prior data regarding magnitude of deformity progression in a related diagnosis group (Charcot deformity).18
MethodsParticipantsSixty people with type 2 DM and PN were recruited for this longitudinal, randomized, controlled, clinical trial (Clinicaltrials.gov, NCT02616263) (Fig. 1). Participants were recruited from 3/1/2016 to 5/10/2018 via the Recruitment Enhancement Core of the Institute of Clinical and Translational Sciences at the Washington University School of Medicine in St. Louis and patient databases of the Hastings and Mueller lab groups. Recruitment and retention information is in Fig. 1. Data collections were performed at the Washington University School of Medicine in St. Louis Program in Physical Therapy and Center for Clinical Imaging and Research. A priori power analysis was conducted to power regression analysis for predictors of 2nd MTPJ extension progression and was based on Hsieh et al’s19 sample size calculation for logistic and linear regression. Sixty-two participants were needed to detect a significant correlation of at least 0.44 between predictor and dependent variables after adjusting for covariates; however, study enrollment ended after recruiting 60 participants to allow completion of the 3-year follow-up.

Type 2 DM was diagnosed by the participants’ physicians. PN was defined as: (1) inability to sense the 5.07 monofilament on ≥ 1 of six plantar foot locations, (2) plantar toe vibration perception threshold >25 V (Biothesiometer, Biomedical Instrument Co, Newbury, OH, USA), or (3) Michigan Neuropathy Screening Instrument physical assessment score ≥ 2.
Exclusion criteria were inability to complete the study testing requirement, age > 75 years, pregnancy, dialysis, severe arterial disease (ankle-brachial index > 1.3 or < 0.9), rigid metatarsophalangeal deformity, presence of ulceration or lower extremity amputation greater than a single toe, weight greater than 180 kg, metal implants and/or pacemaker, or PN from causes other than DM (e.g., chemo toxic, alcoholic, lumbar radiculopathy). All participants provided informed consent. The protocol was approved by the Washington University School of Medicine in St. Louis Institutional Review Board.
Study designParticipants were randomly assigned to a foot- (experimental group) or shoulder-specific (control group) intervention. Groups were stratified by MTPJ angle on baseline computed tomography (CT) scans such that an even number of individuals with an MTPJ angle >50° were in each intervention group. The randomization code was prepared by the biostatistician shared via password-protected Excel sheet, and group assignment was provided by a clinical coordinator not involved in participant testing. Outcome assessors were blinded to group assignment and were not provided the password to the randomization code.
The shoulder intervention provided similar therapeutic interactions between participant and physical therapist while intervening on a joint remote to the foot. The participants and physical therapists could not be blinded to the intervention assignment. The intervention was delivered through 8 in-person visits completed over 6 months with a physical therapist and unmonitored home exercise program to be completed 5 times per week. Participants completed three visits during the first month, two visits in the second month, and a single visit per month for months three through six. The home program progression and intensity were individualized to participant level and tolerance.
The foot intervention (Supplementary Material 1) consisted of foot care (moisturizing cream and soft tissue massage to the foot by the participant), ankle dorsiflexion and toe flexion stretch in standing, progressive strengthening of the intrinsic and extrinsic foot muscles, and practice of functional activities while preventing toe extension during the activity (sit-to/from-stand, walking, and active dorsiflexion/plantarflexion). The shoulder intervention (Supplementary Material 2) included shoulder flexion stretch progressing to weighted shoulder flexion, shoulder circles through a large arc of motion, shoulder flexion return in abduction range of motion progressing to weighted exercise, triceps strengthening, and the functional activity of reaching items on a shelf. Exercise program progression was individualized based on visual assessment of the participant’s exercise performance by a physical therapist trained in the study’s intervention protocol. Once able to successfully complete the full number of sets/repetitions while maintaining proper technique, participants were progressed to the next level of the protocol as long as they were able to perform the higher intensity exercise with proper technique.
Home exercise program compliance was assessed by daily self-report in an exercise compliance log and reported as percent of prescribed exercises completed per week. The number of in-person visits for intervention was recorded.
Primary and secondary outcome measures were collected at baseline, 6 months, 1.5 years, and 3 years. Lower extremity measures were completed on the participant’s foot at baseline with (1) consistent toe extension pattern with dorsiflexion, (2) fewer foot complications (i.e., history of surgery or traumatic injury), and (3) the greatest MTPJ angle from visual inspection.
Intake informationBlood markers included (1) Hemoglobin A1c, an indicator of 3-month diabetes control, values >5.7 % indicate abnormal blood glucose control20 and (2) high-sensitivity C-reactive protein (Hs-CRP) a clinical marker of chronic inflammation, >1 is associated with abnormal inflammation.21 Blood markers were assessed at the baseline, 1.5, and 3 year visits, as we did not believe there would be sufficient time for these measures to markedly change by the 6-month timepoint.
Sensory PN was assessed with biothesiometry and the Michigan Neuropathy Screening Instrument Score. A biothesiometer was placed on the plantar aspect of the great toe with a vibration perception threshold >25 V indicating impaired sensation.22 The Michigan Neuropathy Screening Instrument23 physical assessment, incorporating sensory and observational assessments, was administered with higher scores indicating worse neuropathy (maximum score: 10, ≥2 was considered neuropathy).
Primary outcome – alignment of 2nd metatarsophalangeal jointAlignment measures were completed by a single rater (PKC) blinded to group assignment. The rater completed a computer-based training session and demonstrated reliability compared to a foot and ankle fellowship trained orthopedic surgeon using sample radiographs and previously determined precision criteria18 prior to performing measurements.
The primary outcome variable was 2nd MTPJ extension angle measured from CT scan (Siemens Biograph 40 CT, Siemens Medical Systems, Inc., Iselin, NJ, USA). Scan parameters were as follows: table speed=24mm/sec/rotation, pitch=1, 24 mm collimation, 0.6 mm slice thickness, 220 mAs, and 120 kVp. A phantom (Mindways, Austin, TX, USA; Calibration value: L11G 11F1 1171 611 L) was in each scan to calibrate the Hounsfield units (HU). Ankle position was standardized with a wooden board holding the ankle in 30° plantarflexion. The MTPJ angle was defined as 180 degrees minus the angle measured between the bisection of the proximal phalanx and the extension of the metatarsal bisector. A smaller angle indicates less forefoot deformity (Supplementary Material 3).24
Predictors of progression variablesIntrinsic foot compartment muscle and fat volume, BMD, foot kinematics during sit-to/from-stand and walking tasks, and AGEs in the skin were assessed. See supplementary materials for detailed methods (Supplementary Material 4). Briefly, intrinsic foot compartment muscle and fat volume25–28 and tarsal/metatarsal BMD29–31 were quantified with CT scan. Second metatarsal BMD and average BMD across all tarsal/metatarsal bones were used in analysis. Foot kinematics during sit-to/from-stand and walking were assessed using motion capture (Vicon MX, Los Angeles, CA, USA; Visual 3D, C-Motion Inc., Germantown, MD, USA) with a 4-segment foot model.32,33 Three trials of each task were averaged for analysis. Extension excursion was the difference between the peak MTPJ extension angle during the sit-to-stand task and the average MTPJ angle during the 3-second-standing component of the sit-to-stand task. For walking, peak MTPJ extension angle was the variable of interest. Forearm skin AGE accumulation was assessed using skin intrinsic fluorescence measured with a SCOUT DS skin fluorescence spectrometer (VeraLight, Albuquerque, NM, USA).34
Data analysis – effect of interventionAll analyses were done as intention-to-treat based on group assignment. Because of the presence of missing data, longitudinal analysis to assess the effect of intervention on 2nd MTPJ extension was tested using a linear mixed-effects model repeated measures analysis of variance (RM-ANOVA). Unlike traditional repeated measures ANOVA, the mixed model permits missing data. The RM-ANOVA included a Satterthwaite adjustment for unequal variance. The focus of the RM-ANOVA was on the significance of the interaction between group and visit. Interactions test the null hypothesis that change over visits is not different across groups. For the primary outcome (collected at the four time points), a compound symmetry covariance structure was used and additional statistical contrasts within the RM-ANOVA tested pre-specified hypotheses regarding the equivalence of change between baseline and each post-baseline visit across groups. Previous work has identified cutpoints for change by calculating least significant change values (changes considered real and not the result of chance or error) for radiological measures of the foot. Our original data analysis plan included an a priori cutpoint of progression in 2nd MTPJ extension angle of at least +4°, a rounded up value from our published cutpoint value of 3.94°18 In our analysis, we returned to the published cutpoint of 3.94° and individuals with an increase in 2nd MTPJ extension angle of 3.94° over 1.5 years and 7.88° over 3 years were classified as having 2nd MTPJ extension progression.35 Cutpoints were calculated from published standard error of the mean (SEM) converted to a least significant change (LSC) using the formula LSC=1.96*2*SEM where SEM=1.42° for a 1.5 year interval. The proportion of participants with progression at 1.5 and 3 years was compared across groups by chi-square test.
Data analysis – progression and predictors of foot deformityGroup comparison analysis found no detectible effect of the intervention on MTPJ deformity. Therefore, the two intervention groups were combined for remaining analyses to improve our ability to characterize progression of MTPJ deformity in a larger group of participants and detect smaller magnitude changes over time. Change over time in primary and ancillary MTPJ deformity measures was performed using the combined group of all participants with RM-ANOVA where the focus of the analysis was on the main effect of visit. Analysis of the primary outcome included contrasts to assess change between baseline and each post-baseline visit. Cutpoints for deformity progression were as described above.
Relationships between 2nd MTPJ extension angle and predictor variables (AGEs, foot intrinsic muscle quality measures, movement pattern during sit-to/from-stand and walking, BMD) were examined with bivariate Spearman correlations. These analyses excluded participants with missing data for the component variables. Predictors with p-values <0.10 in bivariate correlations were included in stepwise multivariable logistic regression to predict 2nd MTPJ deformity progression (progressed vs. did not progress over the duration of the study). The stepwise multivariable model used a p-value=0.10 for entry of a predictor and for remaining in the model. Note that this analysis was exploratory in nature, and p-values should be interpreted with caution due to the number of analyses conducted. Additional details regarding data analysis are in the supplementary materials.
ResultsParticipant demographics and diabetes control measures are in Tables 1 and 2. Adverse events during the intervention included 12 foot wounds, categorized as abrasions (n = 9), lacerations (n = 6), and blistering (n = 1). Four participants had >1 wound. Only one wound was attributed to exercise participation. In this participant, an abrasion on the dorsum of the great toe was observed due to the toe flexion stretch. The toe flexion stretch was subsequently modified to standing with a pillow under the foot.
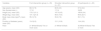
Participant demographics at baseline.
Abbreviations: n, sample size; SD, standard deviation.
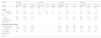
Measures of diabetes severity over study duration.
Abbreviations: n, sample size; SD, standard deviation.
The 1.5-year visit occurred between 1.4 and 1.9 years. The 3-year visit occurred between 3.0 to 4.6 years (mean (SD) of 3.6 (0.4) years) because the COVID-19 pause in human research occurred during the 3-year data collection visit.
Effect of foot-specific interventionResults indicated no effect of a foot-compared to shoulder-specific intervention on 2nd MTPJ extension angle (Fig. 2). The RM-ANOVA showed no statistically significant main effect of group (p = 0.56), visit (p = 0.29), or group by visit interaction (p = 0.79). Specific statistical comparisons of the changes from baseline to each follow-up between groups were not significant (baseline to 6-month, p = 0.45; baseline to 1.5-year, p = 0.84; baseline to 3-year, p = 0.70).
, foot intervention (experimental) group, and shoulder intervention (control) group. Note that there were no significant between group differences in change in 2nd metatarsophalangeal joint angle from baseline to month 6 (p = 0.45), baseline to 1.5-year (p = 0.84) or baseline to 3-year follow-up (p = 0.70).")
Change in 2nd metatarsophalangeal joint extension deformity in degrees from baseline in combined group (all participants), foot intervention (experimental) group, and shoulder intervention (control) group. Note that there were no significant between group differences in change in 2nd metatarsophalangeal joint angle from baseline to month 6 (p = 0.45), baseline to 1.5-year (p = 0.84) or baseline to 3-year follow-up (p = 0.70).
Out of concern that missing data at the 3-year follow-up could influence results, a sensitivity analysis was performed with data from the 45/56 participants with non-missing data at the 3-year follow-up with time between baseline and 3-year follow-up included as a covariate to adjust for the variable length of follow-up across participants. In this model, the covariate (p = 0.19), interaction of group and visit (p = 0.74), and baseline to final follow-up contrast (p = 0.80) were not statistically significant.
Participants in the foot intervention group completed a mean (SD) of 67.6 (34.4) % of the prescribed home exercise program in week 1, 66.1 (31.9) % in week 2, 69.1 (29.4) % in weeks 3–4, 58.3 (33.4) % in weeks 5–6, 59.7 (33.5) % in weeks 7–9, 58.7 (34.8) % in weeks 10–13, 50.2 (35.3) % in weeks 14–17, and 17.1 (25.2) % in weeks 18–24. Throughout the intervention, participants in the foot intervention group completed 7.7 (0.7) sessions of a possible 8 sessions.
Progression and predictors of 2nd MTPJ extension deformityProgression of 2nd MTPJ extension deformity. There were no significant between group differences in proportion of participants meeting the criteria for forefoot deformity progression at 1.5 or 3-year follow-up. In the foot intervention group, 7 of 25 (28 %) participants met the cutpoint of progression of 2nd MTPJ angle within the first 1.5 years of the study and 6/25 (24 %) in the shoulder group (p = 0.75). At the 3-year time point, 2/22 (9 %) of the foot intervention group and 2/23 (9 %) of the shoulder intervention group met the cutpoint for progression (p = 0.96).
In the combined group analysis, there was no significant change in 2nd MTPJ angle over time with a mean (SD) of 53.19 (13.12)° at baseline, 54.79 (14.30)° at 6-month, 52.76 (13.85)° at 1.5-years, and 54.15 (13.75)° at 3-year follow-up. Change in 2nd MTPJ from baseline was a mean (SD) of 1.60 (8.64)° at 6-month, −0.12 (7.98)° at 1.5-year, and −0.38 (7.18)° at 3-year follow-up. Main effect of visit was not statistically significant, p = 0.29; specific contrasts to assess change between baseline to 6-month (p = 0.16), baseline to 1.5-year (p = 0.90), and baseline to 3-year follow-up (p = 0.69) were not statistically significant (Fig. 2).
Predictors of 2nd MTPJ extension deformity. BMD change from baseline was the only predictor of 2nd MTPJ extension deformity progression, accounting for 22 % of the variability in 2nd MTPJ extension angle progression (R2 = 0.22, p = 0.01); with 78 % of variability in 2nd MTPJ extension angle progression remaining unexplained. For each unit increase in BMD from baseline, the odds of 2nd MTPJ extension deformity progression was reduced by 7 % (odds ratio, 0.93; 95 % confidence bounds, 0.87 to 0.98). After BMD change was included in the model, no other potential predictor satisfied the inclusion significance level. Results of bivariate analysis for relationships between predictor variables and 2nd MTPJ extension angle progression are in Table 3.
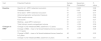
Association of potential predictors with 2nd MPTJ extension angle progression over the duration of the study (i.e., by 1.5 and/or 3 years).
| Visit | Potential Predictor | Sample Size | Spearman Correlation* | P-value |
|---|---|---|---|---|
| Baseline | Stand to sit – MTPJ extension excursion | 51 | 0.003 | 0.98 |
| Diabetes duration | 51 | 0.02 | 0.88 | |
| Sit to stand – MTPJ extension excursion | 51 | −0.04 | 0.77 | |
| Advanced glycation end-product measure | 47 | −0.10 | 0.52 | |
| Total muscle volume | 51 | −0.12 | 0.42 | |
| Fat volume | 51 | −0.13 | 0.37 | |
| Walking – peak MTPJ extension | 51 | −0.21 | 0.14 | |
| Total intrinsic muscle compartment volume | 51 | −0.24 | 0.09 | |
| Changes in BMD† | Change in 2nd metatarsal BMD, baseline to 1.5 years | 51 | −0.24 | 0.09 |
| Change in BMD – mean of all tarsal/metatarsal bones, baseline to 1.5 years | 51 | −0.26 | 0.06 | |
| Change in BMD – mean of all tarsal/metatarsal bones, baseline to 3 years | 45 | −0.35 | 0.02 | |
| Change in 2nd metatarsal BMD, baseline to 3 years | 45 | −0.39 | 0.01 |
Correlations sorted in ascending order of magnitude with each color representing the magnitude of the correlation from p > 0.10 (blue), p > 0.05 and p ≤ 0.10 (green), and p ≤ 0.05 (purple). Metatarsophalangeal joint (MTPJ), bone mineral density (BMD).
Foot and ankle strengthening, range of motion, and movement retraining intervention did not delay or reverse forefoot deformity progression compared to a shoulder-specific intervention. Further, 2nd MTPJ extension angle did not progress a clinically meaningful amount over the course of three years in the majority of our sample with DMPN. Change in BMD was the only foot/ankle characteristic found to contribute to 2nd MTPJ extension deformity progression.
While exercise-based interventions may improve other outcomes (e.g., balance, mobility, etc.), this does not appear to translate into mitigation of foot deformity progression. Little is known about the effect of foot strengthening, specifically of the foot intrinsic muscles, on functional outcomes.36 Foot intrinsic muscle strengthening has been found to improve foot alignment of the medial longitudinal arch in young and older adults without diabetes using clinical tests.37–39 It seems that there is less carryover of foot intrinsic muscle strengthening on dynamic foot alignment outcomes. A randomized controlled trial investigating response to a foot intrinsic strengthening program in adult, recreational runners found increases in intrinsic foot muscle volumes but did not observe changes in medial longitudinal arch range of motion or stiffness during running.40 It may be that there is a limited capacity to mitigate long-standing forefoot deformity in older adults with DMPN despite the potential for improving or slowing the decline of foot intrinsic muscle performance.
There are other explanations for the lack of response to intervention observed in this study. For example, it may be that the heavy reliance on a home exercise program did not allow for assertive enough exercise progression or consistent enough intervention performance to yield an effect. While attendance at in-person intervention sessions was good (96 % attendance), self-reported compliance with the full home exercise program ranged between 50 and 67 % in the first 17 weeks of intervention and dropped in the remaining 6 weeks of intervention. Telehealth may be an option to increase future compliance balancing the benefits of interacting with a healthcare provider with the convenience of performing interventions at home.41
The 2nd MTPJ angle remained relatively stable over the present study’s duration. In the combined study group, 26 % of participants met or exceeded the cutoff for progression of forefoot deformity. Given that most participants did not meet the cutoff for progression, timely identification and intervention of those who do have 2nd MTPJ angle progression greater than 3.94° over 1.5 years or 7.88° over a 3-year period may reduce the risk of foot and ankle complications.
We observed that, of the potential predictors of forefoot deformity progression investigated, only reduced 2nd metatarsal BMD predicted 2nd MTPJ extension deformity progression. Our findings align with research observing reduced tarsal and metatarsal BMD in individuals with DMPN.42,43 Alterations in BMD are nuanced; exact bones and regions of bones that are affected are specific to the site of deformity.44 We did not observe relationships between neuropathy severity or muscle quality deterioration and progression of forefoot deformity in this longitudinal study.45–47 Together, it seems that BMD plays an important role in foot deformity progression warranting future studies.
This study has limitations to consider. We excluded individuals with severe foot deformity limiting generalizability of study findings. There were delays in final time point assessment and participant attrition due to Covid-19 related restrictions on human subjects’ research. While participants were encouraged to continue their home exercise program after the 6-month intervention, they were not required to continue this program, and continued compliance was not systematically tracked. Participant age may have impacted responsiveness to intervention; however, the effect of age was not able to be definitively investigated due to the truncated age range of included participants. Additionally, participants had a high BMI. High BMI is frequently associated with presence of type 2 diabetes, thus, we feel that the BMI range observed in this study is representative of this particular patient group. Foot function is negatively influenced by high BMI,48 so the effect of high BMI on responsiveness to foot-specific intervention or progression of deformity in this diagnosis group may be an area for future study. Finally, correlations between predictors of foot deformity and 2nd MTPJ extension progression are exploratory and p-values were not corrected to account for multiple statistical testing.
ConclusionThis study’s findings provide valuable insights into the natural course of forefoot deformity in individuals with DMPN with well-managed glycemic control and moderate neuropathic impairment. The majority of individuals in this study did not show forefoot deformity progression, suggesting the importance of identifying individuals who meet cutoffs for progression during routine foot screening. BMD contributed to progression of forefoot deformity, suggesting structural contributors to foot deformity.
FundingThis work was supported by the National Institute of Diabetes and Digestive and Kidney Diseases (NIDDK) of the National Institutes of Health (grant numbers R01DK107809, F32 DK123916), Washington University Diabetes Research Center (grant number P30, DK020579), and the Washington University Institute of Clinical and Translational Sciences grant from the National Center for Advancing Translational Sciences (NCATS) of the National Institutes of Health (grant number UL1TR002345). Funding sources had no involvement in the collection, analysis, and interpretation of the data; the writing of the report; and the decision to submit the article for publication.
Clinical trial numberNCT02616263
Ethics committeeWashington University School of Medicine Institutional Review Board
The authors have no competing interests relevant to this study.
The authors acknowledge Ling Chen who supplied statistical support. Kathryn Bohnert, Darrah Snozek, and Christopher Sorensen assisted with subject recruitment and data collection, and Jessica Stumpf, Kaitlyn Winters, Jadean Hoff, Hana Bernhardson, Haley Brogan, Nicholas Youmans, Mary Ellis, Whitney Korgan, Alexa York, and Nick Schroeder who assisted with data processing.


