


Children and adolescents with cerebral palsy often have poor respiratory function, which is often not addressed.
ObjectiveTo examine if adding inspiratory muscle training to sensorimotor exercises would improve mobility capacity and respiratory function in children and adolescents with cerebral palsy.
MethodsForty school-children and adolescents with cerebral palsy aged 8–15 years with Gross Motor Function Classification System I–III, participated in this randomized controlled trial. The experimental group received 45 min of sensorimotor physical therapy in addition to 15 min of inspiratory muscle training for 18 sessions over six weeks. In contrast, the control group received 45 min of sensorimotor training session, three times a week over six weeks. The primary outcome measure was the six-minute walk test. The secondary outcome measures were maximal inspiratory and maximal expiratory pressure, as well as pulmonary function tests.
ResultsTime by group interaction showed no statistical significance between the groups in any outcome measures except for peak expiratory flow. The mean difference of 9.6 cm H2O (95% CI: 2.3, 16.8) in the MIP from baseline to 2-month follow-up supports the experimental intervention. Post-training, the between-group mean difference was 19.8 (95% CI: -18.0, 57.6) meter in the six-minute walk test.
ConclusionAdding inspiratory muscle training to sensorimotor physical therapy did not impact mobility capacity in children and adolescents with cerebral palsy.
The incidence of cerebral palsy (CP) in India is three per thousand live births.1 The life expectancy of people with CP is shorter than the general population with minimal change over the past few decades.2 Respiratory complications are the most common cause of mortality and morbidity.3 Pneumonia is one of the main reasons for hospital admissions accounting for 40% of all deaths in youth and young adults with CP, highlighting the consequence of poor respiratory function on mortality and quality of life in this population.4
Children and adolescents with CP have poor respiratory function, secondary to the disease process.5 Impaired airway clearance, recurrent aspirations, chest infections, poor cough mechanism, impaired lung function, deformity of the spine and chest, and poor nutrition status influence the respiratory condition of children and adults with CP.6 Furthermore, neuromuscular impairment and poor biomechanics of the thorax contribute to lung damage and low cardiopulmonary function, resulting in reduced lung capacity in these individuals.7 Respiratory muscle strength and aerobic capacity, two inter-related physiologic components, essential to perform energy-efficient walking and functional activities, are markedly lower in children and adolescents with CP than their typically developing peers.8–10 Both lung function and respiratory muscle strength are positively correlated with mobility.9 Children with Gross Motor Function Classification System (GMFCS) level I and II have better respiratory function and mobility than those in GMFCS level III.11,12 The severity of impairment in progressing GMFCS levels entails higher energy expenditure even in seemingly simple functional movements such as sitting, standing, and walking.13 This results in a spiral of respiratory function deconditioning and reduced activity levels. Therefore, respiratory muscle strength training may improve lung function and mobility capacity in children and adolescents with CP.
In physical therapy treatment for CP, there is an often limited emphasis on respiratory muscle training. Past studies14,15 have investigated the effects of respiratory muscle training in children in GMFCS levels I–IV and measured their lung function parameters, but not mobility capacity. Keles et al.16 observed improvements in the six-minute walk test (6MWT) in independently unaided ambulatory children with CP, post inspiratory muscle training (IMT). Another study by Unnithan et al.17 reported beneficial changes in the standing and walking dimensions of gross motor function measures after strengthening and aerobic exercises in children in GMFCS level I-III. However; these two dimensions do not represent mobility capacity.
Considering the physical challenges children and adolescents with CP face in school environments, particularly those with GMFCS levels II-III, a regime consisting of only physical exercises may not be sufficient to improve mobility capacity.18 We, therefore, hypothesised that improving respiratory muscle strength by combined IMT and sensorimotor physical therapy might be a potential option for improving the mobility capacity in this population. The primary objective of the current study was to examine the effect of additional IMT to sensorimotor physical therapy on mobility capacity measured using the 6MWT in school children and adolescents with CP. The secondary objective was to investigate the benefits of IMT on respiratory muscle strength and pulmonary functioning in CP.
MethodsParticipantsChildren and adolescents with CP (N = 40), aged 8–15 years, were recruited from two special-schools, the Spastic Society of Karnataka, and Association of People with Disability, Bangalore, India. The inclusion criteria were: children and adolescents diagnosed with spastic, dyskinetic, ataxic CP; GMFCS level I, II, or III; and ability to understand simple verbal instructions. The orthopaedic and developmental paediatricians had made a diagnostic classification of CP. The exclusion criteria were: visual and hearing impairment; surgery within the last three months preventing them from taking part in sensorimotor physical therapy; and severe oromotor issues; severe chest infections or existing respiratory problems precluding them from participating in the intervention.
Study designThis randomized controlled trial, with a parallel-arm design, was conducted between March 2018 and June 2019. The ethics and institutional research committee of Manipal College of Health Professions approved this study, and the trial was registered prospectively in the clinical trial registry of India (CTRI/2018/03/012582). Written informed assent for the child's participation in the study was obtained from the parents/teachers/school principal. Eligible participants were randomly assigned to either the experimental or control group through the lottery method. We marked 40 pieces of paper, 20 as control and 20 as an intervention. The school teacher picked up the papers shuffled them thoroughly in a container and then allocated the participants into the respective groups. Keles et al.16 suggested a between-group mean change of 57.1 m walk distance (6MWT) post-IMT in children with GMFCS I-II. With 80% power (1-β) and 5% significance level (α = 0.05), we considered between-group mean difference of 45 m and a standard deviation of 43 m in the 6MWT as clinically relevant improvements among individuals with CP and GMFCS I-III. However, anticipating the uncertainty in the loss to follow-up, and a 10% attrition rate, we determined to recruit 20 individuals per group.
Outcome measuresPrimary outcome measureThe 6MWT measures the mobility capacity of children and adolescents with CP. The 6MWT is easy to administer, well tolerated, and better reflects the ability to perform mobility-related daily needs compared to other walk tests.19 It has excellent test-retest reliability in the population with CP aged 4–18 years (GMFCS levels I to III).20,21 The 6MWT was performed according to the American Thoracic Society guidelines.22 We selected a straight quiet corridor for the test and provided verbal instructions and practical demonstration to the participants. Children and adolescents with GMFCS level III used their assistive device while performing the 6MWT during baseline, post-training and two-month follow-up measurements. Verbal encouragement was required to complete the test as children got distracted. All the study participants were able to complete the test.
Secondary outcome measuresRespiratory muscle strength was measured using a respiratory pressure monitor (Micro RPM, Carefusion, UK). The maximum inspiratory pressure (MIP) was recorded after maximum inhalation, preceded by a maximum exhalation. As per the American Thoracic Society guidelines MIP <80 cm H2O was considered as respiratory muscle weakness.23 Similarly, during the maximum expiratory pressure (MEP), the participant was asked to inhale to the maximum and exhale forcefully. Three practice trials were given with a rest interval of five minutes before starting the actual test. The assessor noted the best of the five readings.
Pulmonary function tests (PFT) were performed according to the European Thoracic Society guidelines, using Easyone™ (Medizintechnik-Switzerland), diagnostic spirometry device.24 Forced vital capacity (FVC) - the maximal volume of air that can be exhaled forcefully after a maximum inspiration; forced expiratory volume in one second (FEV1) - the maximal volume of air exhaled forcefully in the first second after a full inspiration; peak expiratory flow (PEF) - the maximum speed of expiration were measured. After a demonstration and practice session, the participants performed the PFT in a seated position. They were instructed to “inhale completely so that their tummy comes out like a balloon and then rapidly exhale maximally” using phrases like “blowing out the candle” or “keep blowing”. The assessor recorded the best of eight attempts. A qualified pediatric physical therapist with 15 years of clinical experience, not involved in conducting the intervention and allocation, collected all the outcomes at baseline, 6-week post-training, and two months follow-up.
InterventionThe inspiratory muscle trainer was the Threshold® IMT (Respironics Inc, Murrysville, PA, USA) with a flow-independent one-way valve with adjustable pressure setting from 9 to 41 cm H2O. The participants sat comfortably in a chair and had to close their mouth tightly and inhale deeply using the device. They were asked to inspire 10–15 breaths, rest for 30 s, and repeat the cycle. They performed IMT for 15 min, which is the amount of time they could complete the exercise in one session without fatigue (Fig. 1). One other study also recommended training for 15 min and found it beneficial.25 The initial pressure was set at 30% of MIP and gradually increased every week by 5% of initial MIP based on the participant's performance. A pediatric physical therapist with 10 years of clinical experience provided one practice session to the children to familiarize them to the device's use and later conducted the training sessions. Overall, everyone participated in 18 sessions of IMT, three days a week over six weeks.

In addition to the IMT session, children and adolescents in the experimental group had sensorimotor physical therapy for 45 min per session, three times a week for six-weeks, for a total of 18 sessions. Participants in GMFCS level I and II performed the following activities: pushing a play tunnel; picking balls from a bucket on one end, crossing obstacles, and throwing it in a tub on the other end; jumping on a trampoline; climbing stairs; climbing ramps; running in the playground (in a set time). Those in GMFCS level III performed upper limb exercises in sitting (due to poor postural control) and balance and mobility exercises. The sensorimotor activities included picking balls from one end and throwing it in a tub kept at a distance of one meter by crawling, getting into a play tunnel picking balls and returning to the tunnel again. They underwent walking on an even surface, climbing up and down four steps, walking on a ramp, and wheelchair mobility. The exercises were individualized according to the GMFCS levels and the children's ability in keeping with sensorimotor activities (Fig. 2). Participants in the control group received 45 min of sensorimotor physical therapy that comprised similar physical exercises as the experimental group. This group also completed three training sessions a week, totaling 18 sessions over six weeks.
Statistical analysis
Data were analysed using the SPSS 16.0 version. Baseline descriptive statistics were reported, and Shapiro-Wilk was used to test for normality of data distribution. The outcome variables were tested for homogeneity of variance using Levene's test. A repeated measure analysis of variance was performed to test the intervention's effect on the outcome variables over time. The outcome measures collected at three-time points were reported as a within-subjects variable “time”, and the groups were reflected as a between-subjects factor “group”. A significant interaction of “time by group” means that the between-group change seen over time is statistically significant. The post hoc test with Bonferroni adjustment was used to test the differences in the outcomes between-groups at specific time intervals. We conducted the secondary analysis to observe the difference between groups in the primary measure (6MWT) for each of the GMFCS levels (I, II, and III) and the interaction between GMFCS levels and time. The level of significance was set at p < 0.05.
ResultsOf the total 337 school children and adolescents screened, 114 were diagnosed with other neurological disorders or no movement dysfunction. Only 45 met the study inclusion criteria. Parents of five children did not consent to participation in the study. Thus, 40 children and adolescents with CP were included in the study. All participants were available for the two months follow-up except one child in the control group. We used the last observed value carried forward method for imputing the missing data for that participant. Fig. 3 shows the CONSORT diagram. The baseline demographics and outcome variables between both groups were similar, except for GMFCS levels (Table 1). There were 12 participants in the control group and five in the experimental group belonging to GMFCS level I. In the GMFCS level II, five individuals were in the experimental intervention group and four underwent sensorimotor training. There were ten and four individuals with CP and GMFCS level III in the experimental and control groups, respectively. Of the 20 participants in the experimental group, two had a diagnosis of unilateral spastic CP (GMFCS I, n = 2), 10 had bilateral spastic CP (GMFCS II, n = 2; GMFCS III, n = 8), three individuals showed clinical signs of spasticity in all four limbs (GMFCS I, n = 3) and five participants belonged to the categories of dyskinesia (GMFCS II, n = 2; GMFCS III, n = 2) and ataxia (GMFCS II, n = 1). In the control group (n = 20), there were seven children and adolescents who had a diagnosis of unilateral spastic CP (GMFCS I, n = 7), five individuals with bilateral spastic CP (GMFCS II, n = 1; GMFCS III, n = 4), six had spasticity features in all four extremities (GMFCS I, n = 5; GMFCS II, n = 1), and dyskinesia and ataxic signs were present in two adolescents (GMFCS II, n = 2).

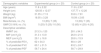
Baseline demographic and descriptive characteristics of experimental and control groups.
Data are mean ± standard deviation or frequency (proportion).
Abbreviations: cm, centimeter; kg, kilogram; BMI, Body mass index; no., number; GMFCS, Gross Motor Function Classification System; 6MWT, Six Minutes Walk Test; MIP, Maximum Inspiratory Pressure; MEP, Maximum Expiratory Pressure; FEV1, Forced Expiratory Volume in the first second; FVC, Forced Vital Capacity; PEF, Peak Expiratory Flow.
Repeated measure ANOVA revealed no significant group by time effect on the primary outcome, 6MWT (P = 0.35). Post hoc comparison with Bonferroni adjustments showed that compared to the sensorimotor physical therapy group, the experimental group demonstrated no significant improvement between groups on the 6MWT post-training (Mean Difference [MD]: 19.8, 95%CI: −18.0, 57.6) and during follow up (MD: 22.3, 95% CI:−12.6, 57.1) (Table 2). The Greenhouse-Geisser statistics revealed no significant interaction between GMFCS levels and time (P = 0.21) for the 6MWT. The findings did not demonstrate a significant between-group difference in the 6MWT post-training for the GMFCS level I (MD: 56.3, 95% CI: −24.3, 136.9) and at follow-up (MD: 41.7, 95% CI:−31.0, 114.4). There was no significant difference in the 6MWT post-training between the experimental and control groups in the GMFCS level II (MD: −7.3, 95% CI: −76.6, 62.0) and during follow up (MD: −23.8, 95% CI: −88.7, 41.0). Similarly, the children and adolescents in the GMFCS level III did not demonstrate substantial between group differences post-training (MD: −3.2, 95% CI: −66.5, 60.1), and at follow-up (MD: 11, 95% CI: −47.1, 69.1) (Table 3). For within-group comparisons, there was no significant improvement in the 6MWT for the control and experimental groups from baseline to post-training and from baseline to follow up (Tables 2 and 3).
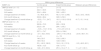
Changes in primary and secondary outcomes.
Data are mean ± standard deviation or mean (95%) confidence interval.
Abbreviations: 6MWT, Six Minutes Walk Test; MIP, Maximum Inspiratory Pressure; MEP, Maximum Expiratory Pressure; FEV1, Forced Expiratory Volume in the first second; FVC, Forced Vital Capacity; PEF, Peak Expiratory Flow; Bold data indicates statistical significance (95% CI does not cross zero; p-value <0.05).
Changes of 6 MWT in GMFCS subgroups.
Data are mean standard deviation or mean (95%) confidence interval.
Abbreviations: m, meter; 6MWT, Six Minutes Walk Test; GMFCS, Gross Motor Function Classification System; 6MWT changes were not statistically significant as 95% confidence intervals crosses zero and p > 0.05.
Repeated measures ANOVA revealed no significant group by time interaction for MIP (P = 0.18) and MEP (P = 0.17). Post hoc analysis showed no statistical significance between the groups for MIP post-training (MD: −0.6, 95% CI: −6.9, 5.8) and at follow-up (MD: 5.4, 95% CI: −2.1, 12.8), as well as for MEP post-training (MD: −2.7, 95% CI: −9.9, 4.6) and at follow-up (MD: −7.1, 95% CI: −15.4, 1.3) (Table 2). There was no significant time by group interaction on pulmonary function test measures (FEV1, P = 0.794; FVC, P = 0.731) except for PEF (P = 0.024) (Table 2). None of the respiratory muscles’ strength and pulmonary function test measures showed statistical significance between groups post-training except for PEF (MD: 19.4, 95% CI: 3.2, 35.5) (Table 2).
DiscussionThere was no between groups difference in performance on the 6MWT at post-training and follow-up. Only performance on the PEF showed substantial between group difference post-training.
The overall distance covered by study participants in the present trial were less for both the control and experimental groups than distances reported by previous studies.12,20,21,26 On interviewing parents and teachers about their children's mobility capacity, regardless of their GMFCS levels, most of them walked less owing to their family and environmental constraints. Impaired biomechanics, movement dysfunction, and high energy requirement might have potentially contributed to reduced walking distance. In the sub-group analysis of GMFCS, all three strata showed statistical insignificance due to heterogeneous diagnostic groups and wide CI in the 6MWT. The large CIs reflect the reality of diversity of diagnostic classification of people with CP. Sensorimotor physical therapy did not improve the walking distance. To date, there are no published data on the minimal detectable change for the 6MWT in individuals with GMFCS level III. When considering individuals in GMFCS level III, the increase in walking distance for the experimental group (n = 10, MD: 19.8 m) and control group (n = 4, MD: 23 m) is encouraging, warranting future studies with a longer duration of training intensity.
The improvement in MIP post-training and at two months follow-up might be related to practice and carry-over benefits of IMT. The mean difference of 9.6 cm H2O in MIP from baseline to 2-month follow-up for the experimental group is encouraging and clinically useful improvements. The substantial changes across time in MIP values of the current study is consistent with results in previous trials.14-16,27 The increased residual volume may be due to neuromotor dysfunction, affecting the respiratory muscles to force the thorax back to normal size voluntarily.7,9 Inspiring against set resistance might have resulted in increased lung expansion, causing the chest to push air out at higher flow rates, thereby increased PEF. The between-group change of 19.4 points in the% of predicted PEF variable from baseline to 6 weeks supports the experimental intervention.
There was mixed result in MEP and lung function test with no discernable pattern in the values of FEV1 and FVC. As we had to accommodate the training session within the school timetable, the frequency of training was shorter than the other studies that showed significant changes in the FEV1 and FVC.14,15,25 This study is consistent with the results by Keles et al.16 who observed no significant difference in pulmonary function following 42 sessions of IMT. During the study, we noticed that the participants were not wholly engaged in the IMT and found it monotonous, thereby taking frequent breaks during the training, requiring constant encouragement to continue. The problems such as dyskinesia, drooling, oromotor tone variations and difficulty holding onto the mouthpiece might have limited their ability to execute an optimal inspiration, leading to sub-optimal performance of the IMT. In addition to oromotor issues, the children and adolescents with CP had difficulty performing the PFT and respiratory muscle strength test correctly and required several attempts. Despite this, there was high variability in results and we had to consider the best of the readings, therefore potentially affecting the outcomes. Considering the challenges we encountered, a couple of questions arises as to whether PFT and respiratory muscle strength tests in this population reflect their actual values? Do we need to measure these if other accessible and functional tests are available? If improvement in mobility-related tasks is the primary focus, can other more fun and visual feedback interventions with less strain on the already compromised musculoskeletal system be designed?
This study's major limitation is the heterogeneity of individuals with CP and their GMFCS levels across both groups. Children and adolescents in GMFCS level III have more pronounced restrictions in mobility than those in levels I and II, resulting in a variety in the study sample. We would have prevented this by implementing stratified randomization based on GMFCS levels to create study arms instead of simple randomization. However, due to recruitment challenges and time constraints, we included participants from all three GMFCS levels. The participants from two special-schools may not represent the total population. The intervention duration could have been longer, but we had to complete it within the available school timetable. The sub-optimal performance of IMT might be one of the potential drawbacks as the children did not enjoy the sessions and required constant encouragement and supervision.
ConclusionThe study concludes that adding IMT to sensorimotor physical therapy did not impact mobility as measured with the 6MWT. The IMT did not change pulmonary function.
The authors are grateful to participants with cerebral palsy and their parents and teachers. We extend our gratitude to faculty of Association of People with Disability, Spastic Society of Karnataka, and Manipal College of Health Professions, Bangalore, India for their support.


