

Frailty syndrome is characterized by a marked reduction in physiological reserves and a clinical state of vulnerability to stress. Torque complexity analysis could reveal changes in the musculoskeletal systems that are the result of having the syndrome.
ObjectiveThe aim of this study was to evaluate the complexity of submaximal isometric knee extensor torque in frail, pre-frail, and non-frail older adults. A secondary aim was to analyze the torque complexity behavior in different force levels in each group.
MethodsA cross-sectional study was conducted. Forty-two older adults were divided into three groups: non-frail (n=15), pre-frail (n=15), and frail (n=12). The data collected included body composition, five times sit-to-stand test, walking speed, and isometric knee extensor torque at 15, 30, and 40% of maximal voluntary contraction. The knee extensor torque variability was evaluated by coefficient of variation, and the torque complexity was evaluated by approximate entropy and sample entropy.
ResultsThe frail group presented a reduction in body mass and peak torque value compared to the non-frail group. Also, the frail group showed worse physical performance (on the five times sit-to-stand test and walking speed) compared to the pre-frail and non-frail groups. In addition, the frail older adults showed reduced torque complexity compared to the non-frail group. Finally, the association between torque complexity and force levels remained similar in all groups.
ConclusionTorque complexity is reduced in the presence of frailty syndrome.
Frailty syndrome is considered a different process from normal physiological aging. This syndrome is characterized by a marked reduction in physiological reserves, making the individual more vulnerable to adverse outcomes, including the risk of falls, institutionalization, hospitalization, disability, and death.1–3 Some researchers describe frailty as a clinical state of vulnerability to stress, due to decreased resilience, with a progressive decline in the capacity to maintain homeostasis.1,3 Additionally, frailty syndrome is associated with changes in the complexity of biological signals, such as, heart rate4 and oscillation of pressure center.5,6 However, the effect of frailty on the neuromuscular system has not yet been investigated from this perspective. Measurements of physiological complexity are useful for early identification and preclinical degeneration, as well as for evaluating the effects of strategies rehabilitation and prevention.7
The neuromuscular system consists of multiple components: excitatory drive from supraspinal centers, α-motoneuron excitability, antagonistic muscle activity, motor unit recruitment and rate coding, neuromuscular transmission, muscle mass, excitation-contraction coupling processes, and muscle morphology and architecture.8 The interaction of these components results in force fluctuations with irregular and non-linear behavior, which is more appropriate to evaluate using non-linear measurements, such as the complexity of the force output.9
Therefore, non-linear methods can be used to analyze the torque complexity, such as entropies. These are mathematical algorithms that quantify the degree of predictability of the isometric torque fluctuations over time. Entropies evaluate the predictability and regularity of a signal, and they are an indirect measure of the complexity of the force output.10–12 Lower values of torque complexity indicate a less adaptive response to internal or external demands and may cause gait instability and increase the risk of falls.13 This torque complexity reduction could be related to the loss of structural components, such as a reduction in the number of motor units, or changes in the coupling between them, for example in the reduction of the simultaneous action of motor unit recruitment.14
In this context, the primary aim of this study was to evaluate the complexity of submaximal isometric knee extensor torque in frail, pre-frail, and non-frail older adults. In addition, a secondary aim was to analyze the torque complexity behavior at different force levels in each group. It was hypothesized that frail older adults would exhibit a reduction in knee extensor torque complexity compared with pre-frail and non-frail older adults.
MethodsStudy designA cross-sectional study was conducted. According to the sample calculation using G*Power 3.1.3 program, based on ANOVA repeated measures, considering group factors (non-frail, pre-frail and frail) and force levels (15%, 30% and 40% of maximal isometric voluntary contraction), it was observed that in order to reach a power of 80%, with an effect size of 0.25 and a significance level of 5%, 36 volunteers would be required, equally distributed among the groups.
Potentially eligible participants were recruited from churches, health centers, using advertisements in magazines, on radio, and television. On the first day of evaluation, anamnesis (i.e. history recollection) and frailty screening were performed. Subsequently, on a different day, each participant was assessed for body composition, physical performance and knee extensor torque. The sample size was determined using a pilot study and the standard normal distribution table, considering torque complexity (ApEn) as the main variable.
ParticipantsCommunity-dwelling individuals aged 65 years old or older were included if they understood instructions, agreed to participate, and had the ability to walk independently or if necessary, using assistive device except a wheelchair.
The exclusion criteria were a history of stroke,15 Parkinson's disease,16 balance and/or visual impairment,17 cognitive impairment (i.e. scores below 18 on the Mini-Mental State Examination)1, and previous orthopedic surgery to the lower limbs, such as hip or knee replacement, fracture fixation, or knee ligament reconstruction.
The subjects were informed about the experimental procedures and signed a consent form approved by the Ethics Committee of the Universidade Federal de São Carlos (UFSCar), São Carlos, Brazil (protocol number: 1.896.521/2017).
The experiments were carried out in a climatically-controlled room at 22–24°C, with a relative air humidity of 50%–60%. The volunteer subjects were instructed to avoid moderate or intense physical activity in the 24h preceding the test protocol and could have light meal up to 1h prior to the data collection.
AnamnesisThe demographic data collected included age, sex, body mass, stature, presence of comorbidities, and medications used. The body mass and stature were measure using the professional medical balance beam scale with stadiometer (Welmy®).
Screening for frailtyParticipants were divided into 3 groups: non-frail, pre-frail, and frail, according to the phenotype of frailty, proposed by Fried et al., 2001.1 Participants who were positive for 3 or more of the clinical characteristics were considered frail, individuals who were positive for 1 or 2 characteristics were considered pre-frail, and those with no positive characteristics were considered non-frail. The five characteristics were evaluated following the instructions of Fried et al., 20011:
- •
A reduction in grip strength below the 20th percentile of the population, evaluated by the hydraulic handgrip dynamometer (North Coast Medical®), adjusted for gender and body mass index (calculated by body mass/stature2);
- •
A walking speed reduction below the 20th percentile of the population, based on the time needed to walk 4.6m and adjusted for gender and stature;
- •
Unintentional weight loss (over 4.5kg or 5% of body weight) in the past year;
- •
Self-reported exhaustion as identified by two questions from the Center for Epidemiological Scale – Depression (CES-D)18,19 (questions #7 and #20, which are respectively: “I felt that everything I did was an effort” and “I could not get going”. The question is asked “How often in the last week did you feel this way?”);
- •
A physical activity level in the lowest 20% of the population, according to the Minnesota Leisure Time Activity Questionnaire, version translated and adapted for use in Brazil.20
A whole-body evaluation was determined using a dual-energy X-ray absorptiometry (DXA) (Discovery A; Hologic Inc. – Bedford, MA, USA), according to the protocol described by Bijlsma et al.21 Relative skeletal muscle mass [i.e. appendicular lean mass/stature2 (kg/m2)]22 was used in this study for characterization of the sample.
Five times sit-to-stand testPhysical performance was evaluated using the five times sit-to-stand test. The test was performed following the instructions and commands described in the short physical performance battery (SPPB).23
Walking speed testThe walking speed test was evaluated over 4.6m using a stopwatch.1 The total test was performed over a route of 8.6m over a smooth walking surface with no obstacles. To eliminate the effect of acceleration and deceleration of gait,24 the 2m at the beginning and end of the route were disregarded for the calculation of walking speed. It was considered the time in seconds that the individual took to walk in 4.6m, and with this data was calculated the walking speed in meters/seconds (m/s). This test was always performed by the same examiner, using the same verbal command “walk at a comfortable pace”.25–27 In addition, the test was performed three times and the final value of speed was calculated from the mean of the three trials.27
Maximal voluntary contraction (MVC)The isometric MVC of the dominant leg knee extension was tested at 60° of knee flexion (full extension=0°) using an isokinetic dynamometer (Biodex Multi Joint System III, Biodex Medical System Inc., Shirley, NY, USA). The load cell was calibrated before each test by positioning and stabilizing the lever arm parallel to the floor and hanging a known weight on the load cell. Subjects were positioned on the dynamometer chair (seat back angle=90°) and stabilized using pelvis, chest, and thigh straps. The rotational axis of the dynamometer was aligned with the lateral femoral epicondyle and the resistance pad was distally positioned above the malleoli on the lower leg, while allowing full ankle dorsiflexion. The gravity correction factor (i.e. additional torque produced by the leg segment and by the resistance pad weights) was determined at about 60° below the horizontal position, with the subject relaxed.
The subjects performed 3 isometric MVC (duration=10s), with a rest period of 5min between each contraction. During the MVC, the subjects were motivated with loud and consistent verbal encouragement and instructed to pay attention to the visual feedback generated by the isokinetic dynamometer screen, to avoid contractions of other muscles, and to keep breathing spontaneously. The highest value obtained of these 3 MVC was used as the peak torque value (PT in Nm).28
Submaximal isometric contraction (SIC)The SIC was performed to allow the calculation of torque variability and torque complexity, since it must be performed on stationary signals.29–37 The subjects carried out 3 SIC knee extensions (15%, 30%, and 40% of the previously determined isometric peak torque). The contractions were performed in a random order and maintained for 30s with a 5-min rest period between each test contraction. The procedures related to the isokinetic dynamometer calibration, subject preparation, and test instructions were the same as described earlier.28 A target was placed on the screen of the isokinetic dynamometer monitor representing each force level (15%, 30%, and 40%) that individuals were required to reach. The participants were always instructed by the same examiner to perform the test by reaching the intended target level and maintaining that target level for 30s.28
Data analysisAll metrics of torque variability and torque complexity were calculated using the stationary signals of the 3 SIC knee extensions (15%, 30%, and 40% of isometric peak torque). To eliminate the transient effect of isometric torque adjustments, the first and final second of the torque samples of each contraction were removed, after which the steadiest 3s were selected for subsequent analysis.
The torque variability of each contraction was measured using the coefficient of variation (CV). The torque variability quantifies the ability to control muscle force during different standardized tasks such as steady contractions. The CV provided a measure of the relative variability by normalizing the standard deviation with the mean of torque.29,38
The torque complexity was examined using the corrected approximate entropy (ApEn),10 and sample entropy (SampEn).11 These entropies are the parameters used to provide the values of complexity. They evaluate the predictability and regularity of the signal, they are an indirect measure of complexity.10,12,39 The values of the input parameters for the calculation of ApEn and SampEn in this study were: the embedding dimension m=2, tolerance r=0.2, and sample size N=300. All the computed indices, i.e. ApEn and SampEn were calculated using a strategy for the correction of the bias of the estimate arising from the smallness of the sample size.
These two entropies follow the same behavior (if increases in SampEn, then there are increases in ApEn), but one will not find the same values due to differences in mathematical formulas. The SampEn was raised to supply a bias presented by ApEn.11 This bias occurs because in the ApEn the reference vector is included in the comparison count, which ends up causing an increase in the signal regularity. For the correct use of the ApEn, it is necessary to make a correction and to withdraw the number of times that the reference vector occurred at the end of the count.10 The difference between the corrected ApEn and the SampEn is that it does not consider the reference vector during the counting comparisons. The SampEn was idealized, thus avoiding the occurrence of self matches that would incorrectly increase the regularity, which would occur with the ApEn if the correction was not performed at the end of the analysis. Summarizing, the ApEn counts comparisons and removes the number of occurrences of the reference vector only at the end of the calculations, and SampEn makes this removal during the comparison calculations. High values of entropy indicate less regularity in the signal, and less predictability, therefore the signal is more complex. Low entropy values indicate greater regularity in the signal, greater predictability, therefore the signal is less complex.10–12,39 More details regarding the procedures are described by Porta et al.40
Statistical analysisThe Shapiro–Wilk test was used to verify the data normality. A descriptive analysis of the three groups (i.e. non-frail, pre-frail, and frail) was performed. To compare the clinical characteristics of the subjects at baseline (i.e. age, body mass, stature, and relative skeletal muscle mass) and physical performance (i.e. 5 times sit-to-stand test and walking speed), ANOVA one-way with the Holm–Sidak post hoc test were used. To compare peak torque, the Kruskal–Wallis test with Dunn's post hoc was used. To compare sex between the groups, the chi-squared test was used.
An ANOVA two-way analysis of variance with repeated measures and Holm–Sidak post hoc were used to test for differences between groups and force levels (SIC) for torque mean value and the metrics of the torque variability (CV) and torque complexity (ApEn and SampEn).
Statistical analysis was performed using SigmaPlot software (version 11.0, Systat, USA). Data are presented as mean and standard deviation. The level of significance adopted was 5%.
ResultsA total of 61 older adults were evaluated. Nineteen subjects were excluded due to the presence of a cognitive impairment (3), a history of stroke (5), or did not finalize the evaluations, and did not return for the second evaluation day (11). The final sample consisted of 42 individuals, divided into three groups: non-frail group (n=15), pre-frail group (n=15), and frail group (n=12) (Fig. 1).

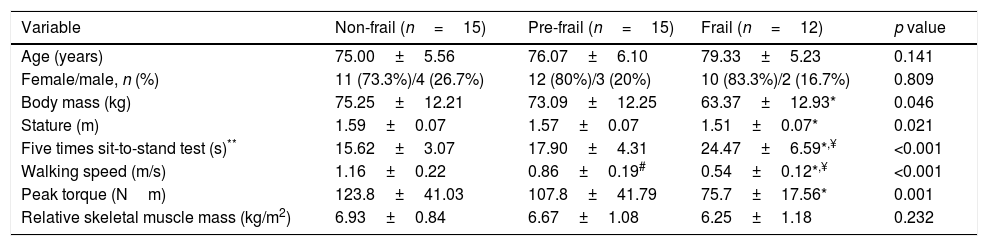
The baseline characteristics of participants are described in Table 1. All groups were homogeneous for age and gender. However, significant differences were found between body mass and stature where the frail group exhibited lower values when compared to the non-frail group. Regarding the five times sit-to-stand test, the frail group took a longer time to perform the test than the other groups. Three individuals in the frail group were unable to perform the test, these subjects were removed from the statistical analysis only for the five times sit-to-stand test. Walking speed was different between the three groups, since the frail group took a longer time to perform the test. The variability in three trials of the walking speed test was presented in percentage (%) by coefficient of variation in each group, non-frail: 4.12±2.53, pre-frail: 4.92±2.55 and frail: 6.59±3.46. In addition, peak torque was reduced in the frail group compared with the non-frail. There was no difference between groups in relative skeletal muscle mass.
Descriptive characteristics between the 3 groups of subjects.
| Variable | Non-frail (n=15) | Pre-frail (n=15) | Frail (n=12) | p value |
|---|---|---|---|---|
| Age (years) | 75.00±5.56 | 76.07±6.10 | 79.33±5.23 | 0.141 |
| Female/male, n (%) | 11 (73.3%)/4 (26.7%) | 12 (80%)/3 (20%) | 10 (83.3%)/2 (16.7%) | 0.809 |
| Body mass (kg) | 75.25±12.21 | 73.09±12.25 | 63.37±12.93* | 0.046 |
| Stature (m) | 1.59±0.07 | 1.57±0.07 | 1.51±0.07* | 0.021 |
| Five times sit-to-stand test (s)** | 15.62±3.07 | 17.90±4.31 | 24.47±6.59*,¥ | <0.001 |
| Walking speed (m/s) | 1.16±0.22 | 0.86±0.19# | 0.54±0.12*,¥ | <0.001 |
| Peak torque (Nm) | 123.8±41.03 | 107.8±41.79 | 75.7±17.56* | 0.001 |
| Relative skeletal muscle mass (kg/m2) | 6.93±0.84 | 6.67±1.08 | 6.25±1.18 | 0.232 |
Data presented as mean±standard deviation.
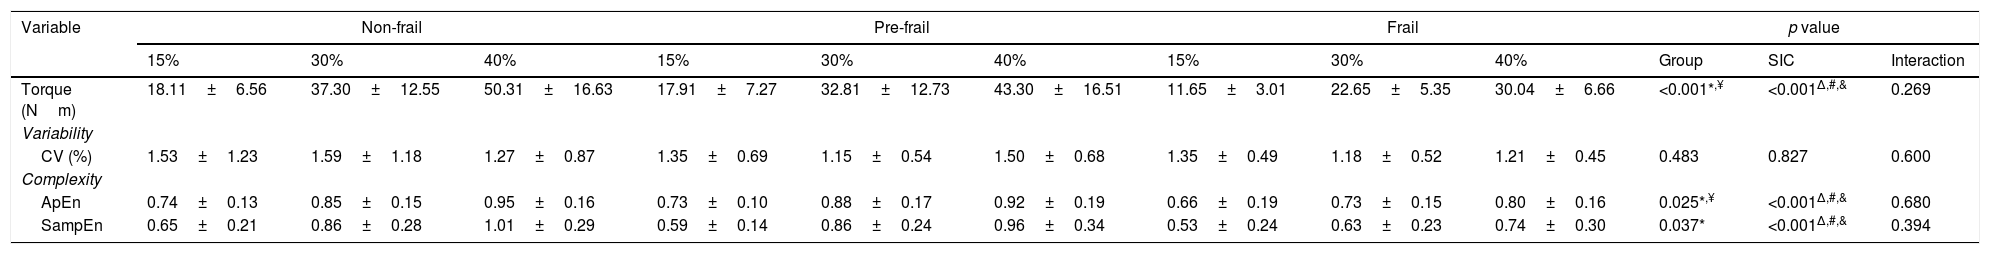
The variables of torque variability and torque complexity are presented in Table 2. There was no interaction between groups and force levels in any of the variables evaluated. The frail group exhibited lower torque and ApEn values when compared to the other two groups. The Frail group exhibited lower SampEn values than the non-frail group. An effect of force levels was observed in the variables: torque, ApEn, and SampEn.
Variables of torque variability and complexity for the 3 groups of subjects.
| Variable | Non-frail | Pre-frail | Frail | p value | ||||||||
|---|---|---|---|---|---|---|---|---|---|---|---|---|
| 15% | 30% | 40% | 15% | 30% | 40% | 15% | 30% | 40% | Group | SIC | Interaction | |
| Torque (Nm) | 18.11±6.56 | 37.30±12.55 | 50.31±16.63 | 17.91±7.27 | 32.81±12.73 | 43.30±16.51 | 11.65±3.01 | 22.65±5.35 | 30.04±6.66 | <0.001*,¥ | <0.001Δ,#,& | 0.269 |
| Variability | ||||||||||||
| CV (%) | 1.53±1.23 | 1.59±1.18 | 1.27±0.87 | 1.35±0.69 | 1.15±0.54 | 1.50±0.68 | 1.35±0.49 | 1.18±0.52 | 1.21±0.45 | 0.483 | 0.827 | 0.600 |
| Complexity | ||||||||||||
| ApEn | 0.74±0.13 | 0.85±0.15 | 0.95±0.16 | 0.73±0.10 | 0.88±0.17 | 0.92±0.19 | 0.66±0.19 | 0.73±0.15 | 0.80±0.16 | 0.025*,¥ | <0.001Δ,#,& | 0.680 |
| SampEn | 0.65±0.21 | 0.86±0.28 | 1.01±0.29 | 0.59±0.14 | 0.86±0.24 | 0.96±0.34 | 0.53±0.24 | 0.63±0.23 | 0.74±0.30 | 0.037* | <0.001Δ,#,& | 0.394 |
Data presented as mean±standard deviation. CV, coefficient of variation; ApEn, approximate entropy; SampEn, sample entropy; SIC, submaximal isometric contraction.
The major novel findings of this investigation were: (a) torque complexity was reduced in the presence of frailty syndrome; (b) all groups showed an increased torque complexity with increased force levels.
Regarding the clinical and anthropometric data, there were no significant differences between the groups for age and sex. The frail group presented lower body mass and stature than the non-frail group. This finding is in accordance with Ferriolli et al.41, who affirmed that older adults classified as underweight presented with a higher prevalence of frailty.41 In this study, the frail group presented lower isometric peak torque in relation to the non-frail group, however, there was no difference in relative skeletal muscle mass. This finding agrees with studies that indicated muscle strength reductions were not necessarily due to reduction in muscle mass, and that there was no linear relationship between them, since the decline in strength preceded that in muscle mass.42–44 In relation to physical performance, our results showed that the frail older adults had worse physical performance than the other two groups. That is, lower walking speed and taking a longer time to perform the five times sit-to-stand test. Some authors have shown that the worst performances in the five times sit-to-stand test were associated with frailty syndrome,45 and that frailty was associated with worse physical performance in female older adults.46
Additionally, the results of this study demonstrated that not only isometric peak torque and physical performance were compromised in the presence of frailty syndrome. The torque complexity of the frail group was reduced in relation to non-frail older adults. The reduction in the complexity of a biological signals indicates that the control mechanisms have become more simplified, which can result in a decrease in functional capacity.47 Lipsitz47 postulated a theoretical basis to exemplify the physiologic basis of frailty. This theory supposes that continued loss of biological signal complexity can lead function to the critical level, below which an organism can no longer adapt to stress (the frailty threshold). For this reason, frail older adults are vulnerable to falls and functional dependence when exposed to environmental, pharmacological, or emotional stress. Therefore, this reduction in torque complexity in frail group could be related to the loss of structural components, such as a reduction in the number of motor units, or changes in the coupling between them, for example in the reduction of synchrony in motor unit recruitment.14 Torque complexity has been reported by Fiogbé et al.48, who presented a reduction in knee extensor torque complexity in healthy older adults compared to young subjects. However, this is the first time it was verified that the presence of frailty syndrome caused greater reduction in torque complexity. This finding agreed with the theoretical basis of the syndrome that is characterized by difficulty of the organism to adapt quickly and accurately in response to internal or external demands.1,49
It is important to note that maintenance of isometric torque is often evaluated only through the calculation of the CV. In our study, this variable did not differ between groups. The same results occurred in others studies.32,33 In the present study, the entropy measurement was shown to be more effective in the neuromuscular evaluation. This is because CV and entropy provided different information. Entropy is a mathematical algorithms that measures regularity, which quantifies the degree of predictability of isometric torque fluctuations over time.10–12 In the present study, torque complexity was analyzed by two entropies (ApEn and SampEn). Our results demonstrated that ApEn was able to differentiate not only the frail from the non-frail group, but also the frail group from the pre-frail group. This becomes important, since pre-frail older adults should also be a target for treatment and rehabilitation, to prevent or retard their transition to frailty.50
Another interesting point in this study was the fact that all groups presented an increase in torque complexity with the increase in SIC. According to Kamen et al.51, at low intensity levels (such as 15%), the force is primarily due to the increase in the number of motor units firing, and once all units are recruited, additional force increases are obtained by the increase in firing rate of these motor units. Thus, it is possible that both strategies for force generation were active between 30% and 40% SIC. Therefore, higher levels of complexity were observed at these intensities in relation to lower levels. This behavior happens to adapt the neuromuscular system to achieve the necessary target force.51 In this study, even frail older adults were able to respond adequately to requests for submaximal force maintenance, although they had a reduction in torque complexity. Fiogbé et al.48 compared the knee extensor torque complexity (at 15, 30 and 40% of MVC) in young subjects and healthy older adults. The findings were that although the older adults presented with a reduced complexity, the relationship with the increase in SIC was similar between older adults and young subjects. Therefore, according to Lipsitz47 there is considerable redundancy in many biological systems, for example, more muscle mass and neuronal circuitry exist than are necessary to live. This is called physiological reserve and owing to this reserve it is possible to compensate for changes related to aging and the presence of frailty. Interaction networks of the physiological systems can compensate for any deficits, since they are able to draw alternative routes to achieve the same desired function, without generating significant impact in the execution of day to day tasks.
Study limitationsIn the present study, three older adults in frail group were unable to perform the five times sit-to-stand test. Thus, in analysis of this test, it was not possible to include the entire sample. Perhaps another test of physical performance would have been more appropriate for this population. In addition, a possible limitation was the use of phenotype of frailty due to: (a) the weight depends on to remember how much lost in previous year, (b) the grip strength might not refer to the individual's total strength, (c) the individuals did not necessarily present the same characteristics in classification of frailty. Finally, the analysis of the electrical activity in muscle through electromyography of the knee extensor muscles could contribute to understanding neural aspects in torque complexity. That would be an idea for future studies of the torque complexity in this population.
ConclusionTo the best of our knowledge, this is the first study to investigate the relationship between torque complexity and force levels in frailty syndrome. In conclusion, torque complexity was reduced in the presence of frailty syndrome although the relationship between torque complexity and force levels remained similar in all groups. Lipsitz47 suggested that physical exercise could potentially restore the dynamics of biological systems, thus improving health and preventing frailty. In this way, future studies should identify whether frail older adults can improve the interactions between the neuromuscular components to exhibit higher entropy values after an exercise training program.
Conflicts of interestThe authors declare no conflicts of interest.
This study was supported by the Coordination for the Improvement of Higher Education Personnel (CAPES).


