

The Back Pain Attitudes Questionnaire (Back-PAQ) was developed to evaluate attitudes and beliefs of the general public, people with back pain, and healthcare professionals about the spine.
ObjectivesTo translate and cross-culturally adapt the Back-PAQ (34-item and 10-item versions) into Brazilian-Portuguese (Back-PAQ-Br) and test its measurement properties in a Brazilian sample.
MethodsThe cross-cultural adaptation and testing of the measurement properties followed the recommendations of international guidelines. Members of the general public, people with back pain, and healthcare professionals, for a total of 139 individuals, took part in the assessment of internal consistency, construct validity, and ceiling and floor effects. The Hospital Anxiety and Depression Scale (HADS) and the Brazilian-Portuguese version of the Tampa Scale of Kinesiophobia (TSK) were used to evaluate construct validity. Test-retest reproducibility was determined on 77 participants. Retest was performed a minimum of 1 week and a maximum of 2 weeks from the original test.
ResultsThere was very high agreement between translators (88.2%). The Back-PAQ-Br showed excellent internal consistency (Cronbach’s alpha 0.92) and excellent reproducibility (ICC 0.94; SEM 5.14 points on a 136 point scale), with a smallest detectable change (90% confidence level) of 11.93 points. There was strong correlation between Back-PAQ-Br and TSK (r = -0.72) and very weak correlation between Back-PAQ-Br and HADS (r = -0.23 for both depression and anxiety domains). No ceiling/floor effects were observed.
ConclusionThe translation process and cross-cultural adaptation had very high agreement between translators. The Back-PAQ-Br has excellent measurement properties that are similar to the properties of the original version.
Back pain is the leading cause of disability worldwide1 and affects both high and low income countries at a personal, societal, and financial level.2 Estimates indicate the one-year prevalence of back pain in Brazil is 50% in adults and 13.1% to 19.5% in adolescents.3 Between 1990 and 2016, there was an increase of 80% in years lived with low back or neck-related disability in Brazil.4 To help solve this issue in Brazil, a well-orchestrated effort is needed.5
Back pain is influenced by biopsychosocial factors.6,7,8–10 Clinicians’ and patients’ attitudes and beliefs about the back can influence one’s experience, behaviour, and disability levels.11–17 Several patient self-reported questionnaires were developed to assess patients’ attitudes and beliefs about their back,18–21 but none of these questionnaires were designed to assess the beliefs of both patients and healthcare professionals (HCPs).18–20,22,23 Assessing beliefs about the back in the general public, people with back pain, and HCPs allows comparison of beliefs and assessment of the impact of interventions designed to target beliefs in these groups.
The Back Pain Attitudes Questionnaire (Back-PAQ) was developed to evaluate the attitudes and beliefs of the general public, people with back pain, and HCPs.24 Item scores indicate whether respondents hold unhelpful or helpful beliefs about the back. The questionnaire covers 5 different dimensions: (1) vulnerability of the back; (2) relationship between back pain and injury; (3) activity participation during back pain; (4) psychological influences on back pain and; (5) prognosis of back pain.24 The Back-PAQ has been previously cross-culturally adapted into French and Argentinian-Spanish.25,26
The primary aim of this study was to translate and cross-culturally adapt the Back-PAQ into Brazilian-Portuguese. The secondary aim was to determine the questionnaire’s measurement properties, including internal consistency, reproducibility (reliability and agreement), ceiling and floor effects, and construct validity in a Brazilian sample of people with and without back pain, including HCPs.
MethodsThis project was approved by the Research Ethics Committee from the Universidade Federal do Rio Grande do Sul (UFRGS), Porto Alegre, Brazil, approval number: 2.956.955/CAAE-90750418.7.0000.5347.
The Back-PAQThe Back-PAQ has a long (34 items) and a short (10 items) version. Each item is rated on a 5-point Likert scale, ranging from ‘False’ to ‘True’ (intermediate labels: ‘Possibly False’, ‘Unsure’, ‘Possibly True’). Responses are scored from -2 (True) to 2 (False) with 11 items reverse scored (items 1, 2, 3, 15, 16, 17, 27, 28, 29, 30, and 31). Scores range from -68 to 68, with negative scores reflecting unhelpful beliefs whereas positive scores reflect helpful beliefs. The 10-item Back-PAQ is composed of items 6, 11, 13, 14, 25, 27, 30, 31, 32, and 33 from the full version, with the score ranging from -20 (unhelpful beliefs) to 20 (helpful beliefs).24
Translation and cross-cultural adaptationThe original Back-PAQ was translated and cross-culturally adapted to Brazilian-Portuguese (Back-PAQ-Br) after gaining consent of the developer of the questionnaire.24 Translation and cross-cultural adaptation was conducted following the 6 stages proposed by Beaton et al.,27 described in detail below.
Stage I: initial translationTwo independent translators forward translated the original version of the Back-PAQ, resulting in 2 versions: T1 and T2. Both translators are Brazilian-Portuguese native speakers, fluent in English, and registered physical therapists with postgraduate training. The guidelines recommend one translator to have and the other not have a medical background.27 However, the research team agreed that having two physical therapists would enable a more accurate translation of the core ideas of the questionnaire.28–31
Stage II: synthesis of the translationDivergences between translators (T1 and T2) were discussed amongst them and one of the authors (JL), using the original English version as a reference. Subsequently, the two translators and one researcher synthetized these translations, resulting in one common translation, referred to as T-12.
Stage III: back translationTwo independent native English speakers fluent in Brazilian-Portuguese back translated the T-12 version of the questionnaire. The translators used for this stage had no medical background, and were blind to the English original version of the questionnaire. This process resulted in two back translations: BT1 and BT2.
Stage IV: expert committeeAn expert committee composed of two physical therapists (JPC and RK), one researcher (JL), a language professional, both forward and back translators from stages I and III, as well as the developer (BD) of the questionnaire was created. The committee did not include people with current back pain. This expert committee compared BT1 and BT2 and consolidated the pre-final version of the questionnaire in Brazilian-Portuguese for field testing. Through this process, expressions from the T-12 version that best suited the Brazilian-Portuguese language, were discussed and modified by the expert committee to improve clarity and interpretability of the questionnaire. This process resulted in the pre-final version of the Back-PAQ-Br.
Stage V: test of the pre-final versionThe pre-final version was tested in 35 participants, of which 25 had current or previous back pain, 10 never had back pain, in addition, 6 were HCPs and 29 were not. One participant had elementary school education, four completed high school, and 30 had at least a bachelor degree. These participants were recruited using the research group network and were tested using an online platform (Google Forms). Participants were asked to provide feedback about clarity and interpretability of the questionnaire using a probing technique. Participants were asked "how would you grade the clarity of the questionnaire” on an 11-points scale from 0 (very confusing) to 10 (very clear). The probing questions involved asking whether participants had any difficulty in understanding the questions and/or words of the questionnaire. In case participants had difficulties in understanding, they were asked “how would you rewrite these?”. This open-ended question gave the participants the opportunity to highlight if any individual items of the questionnaire were not clear for them and how to make it more understandable. The probing technique was applied at the end of the pre-final version questionnaire, using the same online platform. The 35 participants who participated in the testing of the pre-final version were not included in the final sample.
Stage VI: submission of documentation to the expert committee for appraisal of the adaptation processReports were submitted to the expert committee for analysis and agreement on a final version of the Back-PAQ-Br was reached without any further modifications. The final version of Back-PAQ-Br and the 10 items Back-PAQ-Br (Back-PAQ-Br-10) are available at www.otago.ac.nz/backpaq.
Measurement properties of the Back-PAQ-BrTo assess the measurement properties of the Back-PAQ-Br, we aimed to recruit 130 participants, accounting for a 20% dropout rate. This sample size was based on the Consensus-based Standards for the selection of health Measurement Instruments (COSMIN) guidelines, which considers samples >100 participants to be very good.32,33 Given that the questionnaire can be used to assess the attitudes and beliefs of the general public and HCPs, we adopted the following inclusion criteria (as per the original work by Darlow et al.24): individuals of the general public, people with back pain, and HCPs over 18 years of age, fluent, and able to read in Brazilian-Portuguese. Back pain status was determined using the following question: “Which statement describes you best?” i) “I have never had back pain”; ii) “I have had back pain in the past”; iii) “I currently have back pain”. This question was used before by Darlow et al.24 in the development and testing of the original BackPAQ.24,34 Participants were excluded if they did not answer all the questions of the three main questionnaires (Back-PAQ-Br, Tampa Scale of Kinesiophobia [TSK], and Hospital Anxiety and Depression Scale [HADS]).
Participants were asked for their consent and answered four questionnaires using an online survey in Google Forms. Online survey has been used previously to validate similar questionnaires, and was used during the development of the original Back-PAQ.24,26,38–40 The questionnaires gathered data about: (1) demographics (e.g., age, weight, height, place of residence, level of education, occupation, history of back pain); (2) kinesiophobia (fear of movement), using the Portuguese version of the TSK41 (3) emotions (anxiety and depression) using the Portuguese version of the HADS42; and (4) attitudes and beliefs about the back, using the Back-PAQ-Br.
Convergent validity between the TSK and Back-PAQ-Br was assessed as both of these scales explore aspects of fear of movement.24,41,43 Divergent validity between the HADS and Back-PAQ-Br was assessed as generalised anxiety and depression (measured by the HADS) often affect people with back pain and influence recovery, but are not intended to be evaluated by the Back-PAQ-Br.24,42,43
To assess the measurement properties of the Back-PAQ-Br, we followed the criteria recommended by COSMIN,33,44 and collected data in 2 phases. In phase 1 (test), participants were asked to respond to a demographic questionnaire (allowing characterization of the sample) and complete the Back-PAQ-Br, TSK, and HADS. This allowed us to test the internal consistency, construct validity, and ceiling and floor effects of the Back-PAQ-Br. In phase 2 (retest), participants were asked to answer the Back-PAQ-Br for a second time, using the same online platform, to assess its reproducibility (reliability and agreement). To minimize risk of recall bias, and consistent with the recommendation by Terwee et al.,45 the amount of time between test and retest was a minimum of 1 week and a maximum of 2 weeks. Participants whose back pain status (assessed with the same question) changed between test and retest were excluded from the reproducibility analyses. To minimize dropout rates, participants were contacted up to 3 times via email (7, 10, and 14 days after the initial test).
Statistical analysisThe data were analysed using the Statistical Package for Social Sciences, IBM® (SPSS, version 19.0). Both demographic and questionnaires’ data were tested for normality using the Kolmogorov-Smirnov test.
Internal consistency was calculated by using Cronbach’s alpha to assess the homogeneity of the items within the Back-PAQ-Br. Cronbach’s alpha analysis for each item deleted was also performed to test for item redundancy.
Reproducibility is an umbrella term for reliability and agreement.45 Reliability was determined using type 2,1 intraclass correlation coefficient (ICC) with 95% confidence intervals (CI) using the data from the test and retest. The following criteria were used for interpreting the findings: <0.40 as ‘poor’, 0.40 to 0.75 as ‘fair to good’, and >0.75 as ‘excellent’.46
Agreement was assessed by calculating (1) the standard error of measurement for consistency (SEM),47 (2) the smallest detectable change (SDC), and (3) the limits of agreement (LOA) between test and retest measurements.33,45 The SEM consistency was determined by taking the square root of the mean square error term from the respective ANOVA.47,48 To check for systematic differences between test and retest, a paired t-test was used, and the Cohen’s d was used to interpret the magnitude of differences. The SDC was calculated by multiplying the z-score corresponding to the level of significance, the square root of 2, and the SEM. A z-score of 1.64 was chosen to reflect an acceptable 90% confidence level for clinical application to individual participants.49–52 We expressed SDC90 as a percentage of the scale width (%SDC90). LOA were calculated as described by Bland and Altman.53
Construct validity was evaluated by determining the correlation between the scores on the Back-PAQ-Br and TSK as well as Back-PAQ-Br and HADS using the Spearman correlation coefficient. The following criteria were defined a priori: coefficient ranging from 0.00 to 0.30 was considered very weak; from 0.31 to 0.50 was considered weak; from 0.51 to 0.70 was considered moderate; from 0.71 to 0.90 was considered strong, and a coefficient greater than 0.90 was considered a very strong correlation.54 We hypothesized, a priori, that: (a) scores on the Back-PAQ-Br would be moderately to strongly negatively correlated to scores on the TSK (convergent validity); and (b) there would be very weak negative correlations between scores on the Back-PAQ-Br and depression and anxiety scores on the HADS (divergent validity).
Potential ceiling and floor effects were assessed by calculating the percentage of participants indicating the maximum (ceiling) and minimum (floor) possible scores. These effects were considered to be present if at least 15% of the participants scored the maximum or minimum score.45,47
ResultsThere were 139 participants (mean age: 37.8 ± 13.03 years; range: 18–73) recruited using the research group network and social media between January and March of 2019. Table 1 provides the sociodemographic data of the sample studied. All participants completed the demographic, Back-PAQ-Br, TSK, and HADS questionnaires allowing characterization of the sample and construct validity testing (Table 2). There were missing data for only one participant, who did not answer the item about back pain status.
Descriptive characteristics of participants.
| Characteristics | Frequency (and percentage) | |
|---|---|---|
| Construct validity test(n = 139) | Reliability test (n = 77) | |
| Gender Male Female | 50 (36%)89 (64%) | 25 (33.8%)51 (66.2%) |
| Occupation Healthcare professional Non-Healthcare professionalOffice worker StudentRetiredManual labour Others | 73 (52.5%) 66 (47.5%)39 (28.1%)10 (7.2%)7 (5%)5 (3.6%)5 (3.6%) | 39 (50.6%)38 (49.4%)23 (29.9%)4 (5.2%)3 (3.9%)5 (6.5%)3 (3.9%) |
| Education High school College Undergraduate degree Post-graduate degree | 9 (6.5%) 2 (1.4%) 55 (39.6%) 73 (52.5%) | 6 (7.8%)2 (2.6%)24 (31.1%)45 (58.5%) |
| Body mass index (kg/m2) Less than 18.5 18.529.9 30.0 or higher | 6 (4.3%)73 (52.5%) 43 (30.9%)17 (12.2%) | 0 (0%)0 (0%)2 (2.6%)75 (97.4%) |
| Place of residence in Brazil Northern North-eastern South-eastern Southern | 4 (2.9%)5 (3.6%)52 (37.4%)78 (56.1%) | 1 (1.3%)3 (3.9%)25 (32.5%)48 (62.3%) |
| Physically activea No Yes | 53 (38.1%)86 (61.9%) | 27 (35.1%)50 (64.9%) |
| Back pain Status I have never had back pain I have had back pain in the past I currently have back pain No answer | 11 (7.9%)71 (51%)56 (40.3%)b1 (0.7%) | 5 (6.5%)43 (55.8%)29 (37.7%) |
| Have you seen a healthcare professional for your back pain? Never seen Have seen | 45 (32.4%)94 (67.6%) | 22 (28.6%)55 71.4%) |
Questionnaires’ scoresa of test and retest.
| N = 139Median(Min and Max) | N = 62Median(Min and Max) | N = 77Test Median(Min and Max) | N = 77 re-testMedian(Min and Max) | |
|---|---|---|---|---|
| Back-PAQ-Br (34 -item) | −5(-40, 57) | −8(-36, 57) | −3(-40, 56) | −1(-34, 58) |
| Back-PAQ-Br (10 -item) | 3(-11, 20) | 2(-9, 20) | 4(-11, 20) | 5(-7, 20) |
| TSK | 33(17, 52) | 35(18, 52) | 33(17, 52) | |
| Depression (HADS) | 3(0, 14) | 4(0, 12) | 3(0, 14) | |
| Anxiety (HADS) | 6(1, 17) | 6.5(1, 17) | 6(1, 16) |
Min: minimal value; Max: maximum score. TSK: “Tampa Scale of Kinesiophobia”; HADS: Hospital Anxiety and Depression Scale; Back-PAQ-Br: Back Pain Attitudes Questionnaire – Brazilian-Portuguese version.
Translators and back-translators had no difficulty in translating the Back-PAQ. There was very high agreement between the translators (88.2%), with divergence on only four items. Literal translation of these four items from English to Brazilian-Portuguese did not make sense or would make it difficult for the general public (or lay person) to understand their meaning. The expert committee reached consensus by choosing terms from the back-translation with meaning that most closely approximated the meaning in Brazilian-Portuguese language. These divergences and the proposed solutions are presented as online supplementary material.
The average ± standard deviation (SD) clarity score for the questionnaire was 8.34 ± 1.53 out of 10, with 88.57% of participants providing a rating of 7 or greater. Four participants scored clarity under 7 out of 10. Three of these four participants understood the items but found it hard to relate to the statements, as they had never experienced back pain. Two participants reported having difficulty understanding item 17 and one had difficulty understanding item 32. The expert committee decided not to change the pre-final version as concerns about clarity were reported by far fewer participants than the 15% considered acceptable (item 17 = 5.7%; item 32 = 2.85%).55
Measurement properties of the Back-PAQ-BrThere was a loss of 62 participants between test and retest. Two participants had a response time that was either shorter (6 days) or longer (24 days) than the timeframe of 1–2 weeks. We kept these 2 participants because both participants had no change in their clinical status (confirmed by the answer on question 9 of the demographic questionnaire) and a sensitivity analysis of the data indicated no differences in ICC values when these 2 participants were excluded (0.943 with all participants and 0.945 excluding the two participants).
Internal consistencyThe Back-PAQ-Br showed excellent items homogeneity (Cronbach’s alpha: 0.92, range from 0.917 to 0.925).45
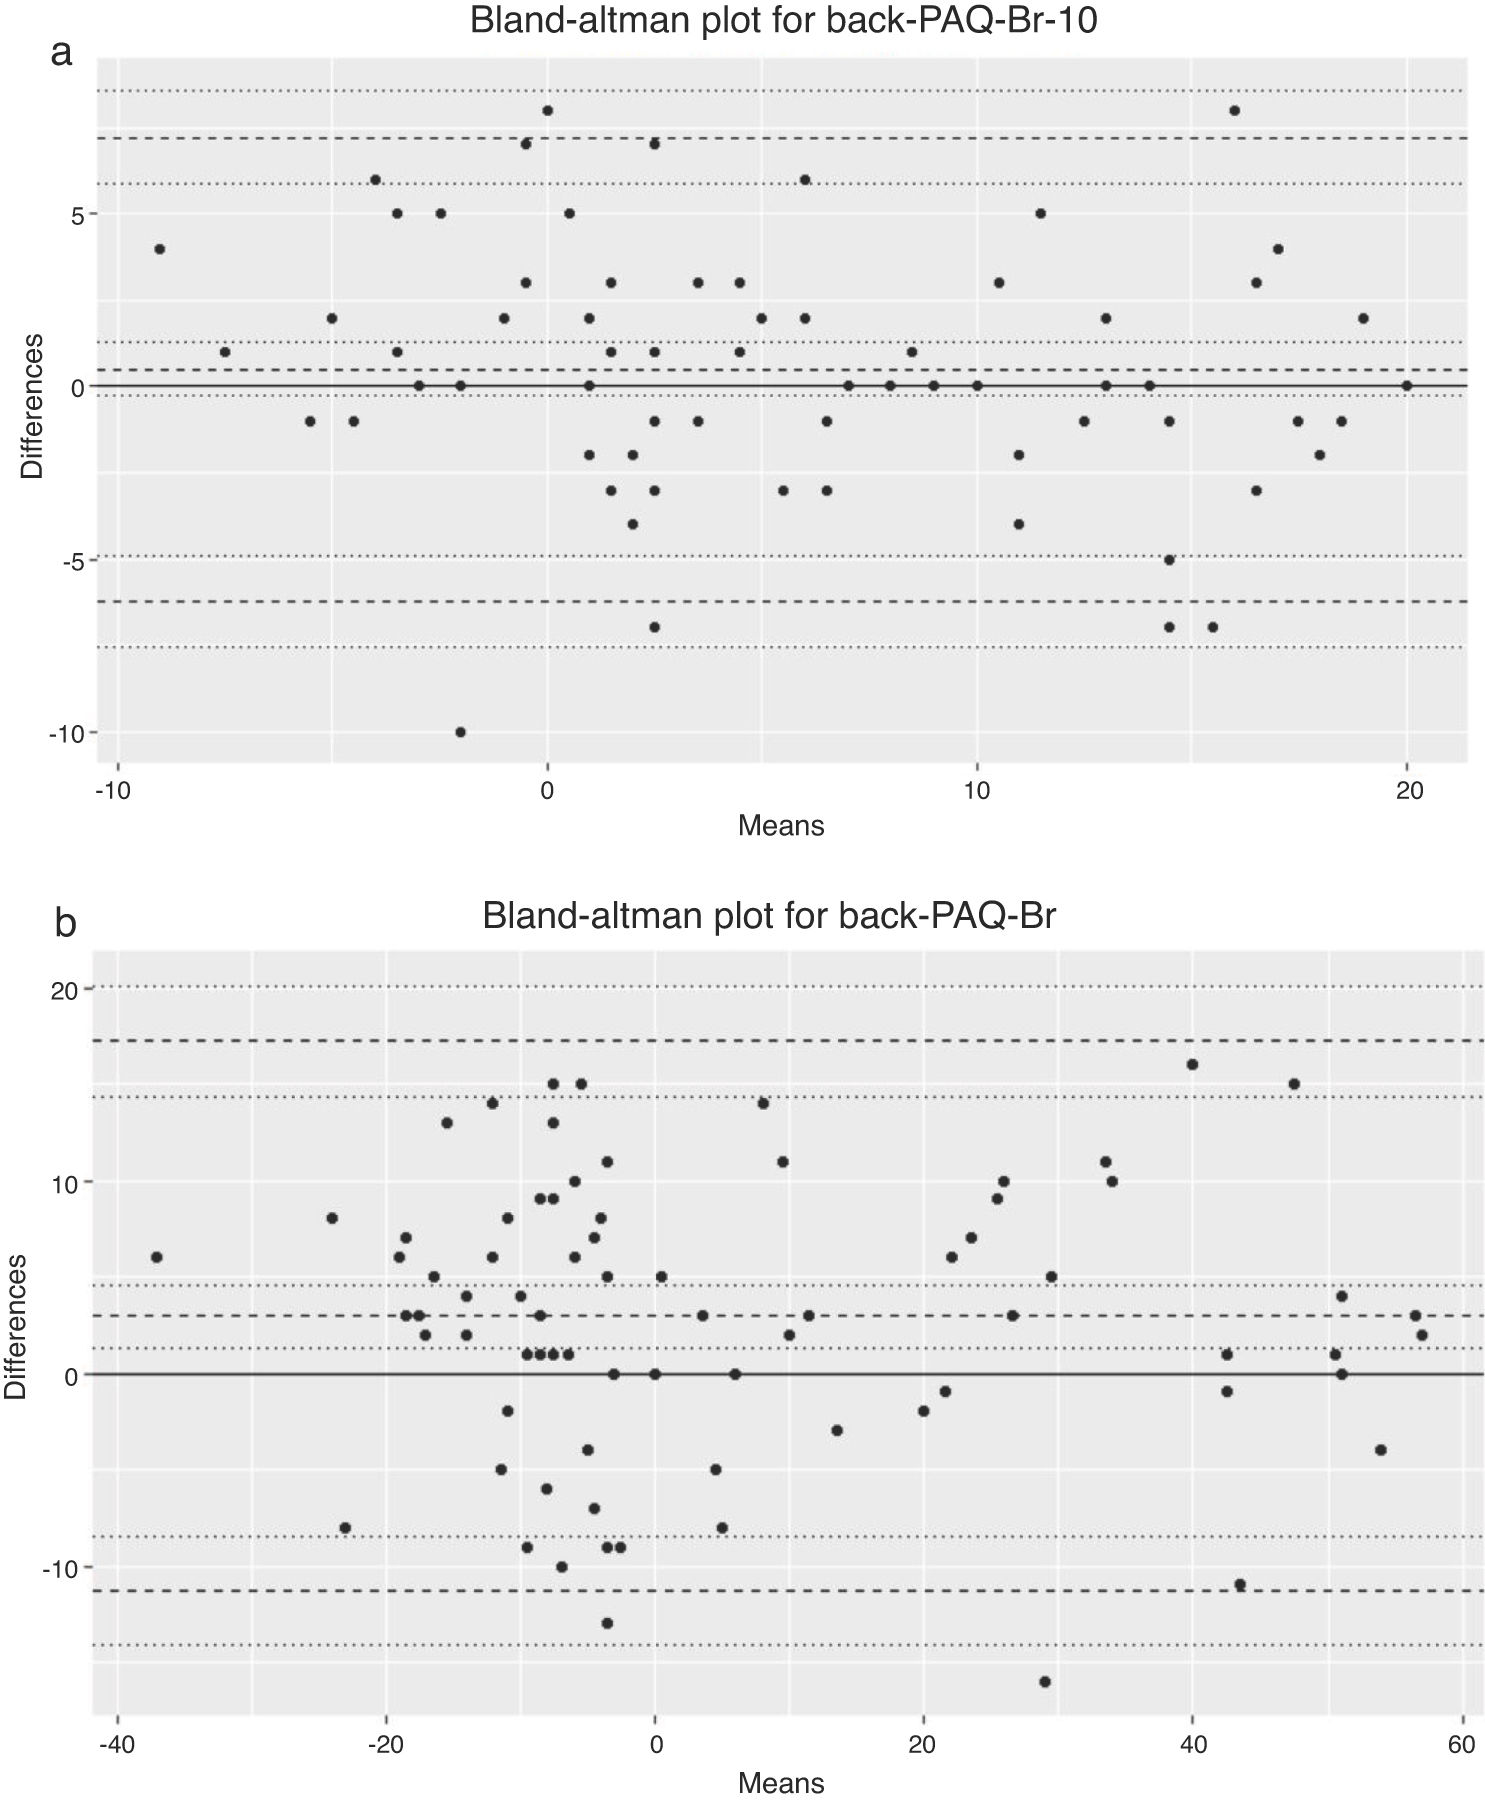
Reproducibility and ceiling and floor effectsThe translated version of the Back-PAQ-Br showed excellent test-retest reproducibility (Table 3). The mean difference between test-retest for the Back-PAQ-Br was -2.95 (95% limit of agreement: -17.2 and 11.3), with a Cohen’s d of 0.4. The mean difference between test-retest for the Back-PAQ-Br-10 was -0.49 (95% limits of agreement: -6.23 to 7.22), with a Cohen’s d of 0.14. Differences between test-retest did not increase as the magnitude of measurement increased (for both Back-PAQ-Br and Back-PAQ-Br-10), as shown in Bland and Altman plots and the respective LOA (Fig. 1). None of the participants reached the minimum or maximum scores for the Back-PAQ-Br. None of the participants reached the minimum score and only 3.6% reached the maximum score on the Back-PAQ-Br-10. These findings suggest no floor or ceiling effects.45,47
Test-retest reliability for Back-PAQ-Br scores (n = 77).
| ICC(95% CI) | SEM(%SEM) | SDC90(%SDC90) | |
|---|---|---|---|
| Back-PAQ-Br (score range -68 to 68) | |||
| Test-retestReliability | 0.94(0.89, 0.97) | 5.14(3.78) | 11.93(8.8) |
| Back-PAQ-Br-10 (score range -20 to 20) | |||
| Test-retestReliability | 0.90(0.85, 0.94) | 2.43(6.07) | 5.63(14.1) |
Min: minimal value; Max: maximum score. ICC: Intraclass Correlation Coefficient. CI: Confidence Interval. SEM: Standard Error of Measurement. %SEM: percentage of SEM. SDC90: Smallest Detectable Change with 90% confidence level. %SDC90: percentage width of the SDC90.
There was a strong correlation between the scores of the Back-PAQ-Br and TSK and very weak correlation between the scores on the Back-PAQ-Br and HADS (Table 4).54
Construct validity (correlation coefficient and 95% confidence interval).
| Back-PAQ-Br (n = 139b) | Back-PAQ-Br(n = 56b; only back pain participants) | |
|---|---|---|
| TSK | r = -0.725a(-0.795, -0.635) | r = -0.638a(-0.771, -0.451) |
| Depression (HADS) | r = -0.231(-0.383, -0.067) | r = -0.387(-0.590, -0.138) |
| Anxiety (HADS) | r = -0.234(-0.385, -0.070) | r = -0.244(-0.476, 0.020) |
Notes: r values are Spearman’s correlation coefficient. Negative values indicate a negative direction between instrument’s scores. TSK: “Tampa Scale of Kinesiophobia”; HADS: Hospital Anxiety and Depression Scale; Back-PAQ-Br: Back Pain Attitudes Questionnaire – Brazilian-Portuguese version.
The translation process was successful. There was high agreement rating between translators, with minimal divergences, which were resolved by the expert committee. The results indicate that the Back-PAQ-Br has excellent internal consistency, reliability, agreement, and construct validity which was consistent with the postulated hypotheses. These results confirm this instrument is reliable and valid to assess attitudes and beliefs of the general public, people with back pain, and HCPs about the back. This instrument has similar properties to the original version.23,24
The inclusion of the developer (BD) of the questionnaire in the process of cross-cultural adaptation added strength to our methods. The very weak correlation between the scores on the Back-PAQ-Br and HADS43 confirmed our hypothesis that the Back-PAQ does not measure anxiety and depression.24 Despite a high attrition rate for the retest (46% of the original participants), the remaining sample size (n = 77) was still greater than the minimum sample recommended (i.e. n > 50) for testing of reliability and agreement of an instrument.32,33,45,56 ICC for Back-PAQ-Br was excellent (0.94), similar to Pierobon et al. (0.90),26 and higher than Demoulin et al. (0.73).25 Also, LOA results (-17.2 and 11.3) were similar to Demoulin et al. (LOA = -16.1 and 12.9).25 Another strength of this study was that data were collected across four different regions of Brazil.57–59
Internal consistency for the Back-PAQ-Br was excellent (Cronbach’s alpha = 0.92). This is similar to the estimates reported by Moran et al.23 (Cronbach’s alpha = 0.91) and higher than the estimates reported by Darlow et al.24 (Cronbach’s alpha = 070), Demoulin et al.25 (Cronbach’s alpha = 0.63), and Pierobon et al.26 (Cronbach’s alpha = 0.76). Differences in these estimates may relate to sample characteristics. The study by Demoulin et al.25 only included people with back pain.25 The study by Pierobon et al.26 included people with and without back pain, while Moran et al.23 only included HCPs such as physical therapists and osteopaths in their study. In comparison, 56 (40.3%) of our participants had back pain (21 of which were HCPs) and 82 (59%) of our participants did not have current back pain (52 of which were HCPs). Back-PAQ-Br has excellent internal consistency compared to other instruments that were cross-culturally adapted to Brazilian-Portuguese, such as Pain Attitudes and Beliefs Scale for Physical Therapists, Fear Avoidance Belief Questionnaire and Örebro Musculoskeletal Pain Screening Questionnaire.19,20,60 Results for the ICC, SEM, and SDC were overall consistent to previous studies testing the Back-PAQ, with differences possibly explained by sample caracteristics.26,25,23 Our results suggest that a change of 12 points on the BackPAQ-Br or 6 points on the 10 item version (Back-PAQ-Br-10) of the Back-PAQ-Br is needed to be considered a meaningful change. Construct validity findings showed strong convergent validity between scores on the Back-PAQ-Br and the TSK (r = -0.73). The Back-PAQ addresses elements related to fear of movement and the relationship between back pain and injury, which are similar constructs covered in the TSK,20,24 hence the strong correlation between these tools. The strength of correlation of our study was higher than the correlations found between the Örebro Musculoskeletal Pain Screening Questionnaire and the TSK (r = 0.64)19 and similar to Fear-Avoidance Beliefs Questionnaire and TSK (r = 0.86).20 To the best of our knowledge, the only previous study that tested the convergent validity of the Back-PAQ against the TSK was Moran et al.,23 which reported a coefficient r = - 0.58. There was a very weak correlation between Back-PAQ-Br and HADS (depression and Anxiety). The Back-PAQ covers dimensions (i.e. vulnerability of the back; psychological influences on back pain; and prognosis of back pain) that have little in common with the content of the HADS (an instrument that assess anxiety and depression).24,42 These findings confirm the divergent validity between the two instruments.
This study has some limitations. First, both forward translators were physical therapists. The main advantage for having a translator without medical or clinical background is that the translator would represent and use the language used by the general public.27 However, our findings suggest the translated version of the questionnaire was clear and participants could understand the questions. A second limitation is that more than 90% of the sample had at least a bachelor degree and 52.5% of the sample were HCPs. According to the last national survey in 2010, 8.31% of the Brazilian population have completed higher education training.61 It is possible that individuals with lower literacy will have difficulties completing the questionnaire. Third, we used the same version of the TSK to assess fear of movement in people with and without back pain, and HCPs.62,63 This was done as Brazilian translations of the TSK for general public and the TSK for HCPs do not exist. However, this is unlikely to impact on our findings, as a sensitivity analysis showed that inclusion of the general public and HCPs did not affect the strength of the relationship found between TSK and Back-PAQ-Br. Fourth, the heterogeneous sample prevented the authors from investigating whether this questionnaire would be suitable for specific group of people. This study provides valuable information about the properties of this questionnaire across a sample that includes the general public, people with back pain, and HCPs. While we had a large number of HCPs, the rest of the sample was reasonably well distributed across professions and age groups.
Beliefs about the back can influence a person’s trajectory in the healthcare system and their recovery as well as the clinical decisions made by a HCP.11,12,16,17,31,63,64 The cross-cultural adaptation of the Back-PAQ to Brazilian-Portuguese will enable researchers to use this questionnaire to evaluate attitudes and beliefs of the general public, people with back pain, and HCPs. This could help guide future interventions regarding education about back pain at a public level, health system level (policy and stakeholders), and at a clinician level. Future studies could evaluate the attitudes and beliefs of these groups and also the responsiveness of this questionnaire to interventions targeting changes in beliefs and behaviours about the back.
ConclusionThe Back-PAQ-Br has excellent measurement properties that are similar to the properties of the original version. Therefore, as the original, the Back-PAQ-Br can be used for research and clinical purposes in Brazil.
Conflict of interestThe authors declare no conflict of interest.
This research did not receive any specific grant from funding agencies in the public, commercial, or not-for-profit sectors. The authors would like to thank Cristiane Bündchen, for her valuable contribution to the statistical analysis and Nicolas Carl Duggan and Mathew Bender for translating the Back-PAQ-Br back to English.
R.C. Krug received a Master’s scholarship from the Coordination for the Improvement of Higher Education Personnel (CAPES).
This research was conducted during tenure of The Sir Charles Hercus Health Research Fellowship of the Health Research Council of New Zealand [Grant number: 18/111] awarded to DCR. The Health Research Council – New Zealand had no role in the design of the study, its execution, data analysis, and interpretation or on the submission of the manuscript for publication.
The following is Supplementary data to this article: