


Clinician-friendly tests, defined as affordable, portable, and readily available, can facilitate assessing and treating Achilles tendinopathy.
ObjectiveTo identify physical impairments in individuals with Achilles tendinopathy using clinician-friendly tests.
MethodsSearches were performed in Medline, CINAHL, EMBASE, Web of Science, and Sportdiscus for studies comparing physical function between individuals with Achilles tendinopathy and controls using clinician-friendly measures. Study quality was assessed using the Downs and Black scale, and evidence certainty using GRADE approach. When possible, data were pooled through meta-analysis.
ResultsSeventeen studies were included with 12 contributing to quantitative synthesis. Meta-analyses showed individuals with Achilles tendinopathy when compared with an asymptomatic group had: lower ankle dorsiflexion in a non-weight bearing position with knee bent (mean difference [MD] = 5.22, 95 % CI: 2.16, 8.28), lower ankle plantar flexion endurance on heel raises (MD = 10.47 repetitions, 95 % CI: 7.17, 13.76), and lower hip extension isometric strength (Effect Size= 0.49, 95 % CI: 0.12, 2.59). In those with Achilles tendinopathy, effect size analysis showed a greater Achilles tendon angle and tibia varus compared to an asymptomatic group, greater first ray and midfoot abduction laxity than the asymptomatic limb, and impaired jump performance compared to asymptomatic individuals and limb.
ConclusionLow to moderate certainty evidence suggests those with Achilles tendinopathy have less ankle dorsiflexion, lower hip extension strength, lower ankle plantar flexion endurance, impaired hop performance, and greater Achilles tendon angle, tibia varus alignment, and first ray and midfoot abduction laxity. Clinicians should consider these impairments when assessing patients with Achilles tendinopathy.
Achilles tendinopathy (AT) is characterized by pain and tendon morphology alterations.1 that may occur in either the mid- or insertional- portion of the tendon,2 leading to functional loss and disability.3 Physical impairments such as reduction in joint range of motion (ROM), muscle strength and flexibility, and functional performance are often identified in this population.4–6 The most recent clinical practice guideline from the American Physical Therapy Association for mid-portion AT recommends including physical impairments evaluation as a core component of the physical assessment in this population.7
Weakness of the ankle plantar flexors is a physical impairment frequently found in individuals with AT. More specifically, previous systematic reviews8,9 determined that these individuals showed deficits in maximal, reactive, and explosive ankle plantar flexors strength in comparison to the uninjured side or to asymptomatic individuals. Reduced isometric strength of the hip abductors, external rotators, and extensors may also be present in individuals with AT.4 In addition, individuals with AT seem to have limited ankle dorsiflexion and first metatarsophalangeal joint ROM,10,11 and lower performance in jump tasks.6,12 The assessment of these deficits in clinical settings depends on the availability of clinical instruments.
Clinician-friendly assessment methods have been defined as being affordable, portable, and readily available methods that can be applied in clinical settings.13 Given that individuals with AT may present with a variety of physical impairments,14,15 clinicians would benefit from clinician-friendly methods to measure these deficits and subsequently develop a personalized treatment plan. Therefore, the aim of this systematic review with meta-analysis was to identify physical impairments in individuals with Achilles tendinopathy that are measured using clinician-friendly tests.
MethodsThis systematic review followed the Preferred Reporting Items for Systematic Review and Meta-analyses (PRISMA) guidelines16 and the protocol was prospectively registered and is available on the Open Science Framework (https://osf.io/mkebs).
We included studies that investigated physical impairments (i.e., flexibility, muscle function, ROM, lower limb performance, lower limb alignment, and foot posture) in participants with AT of any athletic level using clinician-friendly measures. We used the following operational definition to determine if a measure was clinician-friendly: can be performed in any sports or clinical settings with affordable, portable, and readily available equipment.13 This definition excludes measurements performed with equipment that is expensive, non-portable, or requires a great deal of expertise (e.g. force plates, three-dimensional motion capture system, electromyography). Only studies that compared physical impairments using an appropriate control: the non-injured limb for those with unilateral AT or a lower limb from asymptomatic individuals, were considered eligible. When individuals with bilateral AT were recruited, the comparison had to be made with a lower limb from asymptomatic individuals. Studies that used least symptomatic limb as comparator in individuals with bilateral tendinopathy were not included. Cross-sectional and interventional study designs (i.e., when the data for physical impairments were available at baseline) were deemed eligible. No restriction was applied to the language of publication. We excluded literature reviews, prospective cohort studies, case reports, and abstracts.
We performed a comprehensive search from inception to June 2023 in the following databases: MEDLINE (OvidSP), CINAHL (EBSCO), EMBASE (OvidSP), Web of Science, and Sportdiscus (EBSCO). Additionally, we screened the reference list of included articles and recent systematic reviews on AT. Our search strategy combined terms related to Achilles tendon, tendinopathy, and physical parameters and/or impairments. The detailed search strategy is presented in the Supplementary Material - S1. An updated search was performed for the period between June 2023 and September 2024, leading to the inclusion of one additional article.
First, all records identified in each database were checked, and duplicates were removed. Then, titles and abstracts were independently screened according to the eligibility criteria by two authors. Second, the same two authors performed full-text screening of selected articles. In case of disagreement, a third author was consulted for resolution. Once studies were deemed eligible, two authors independently extracted the relevant data using a standardized data extraction form. Data extracted included: first author, year of publication, sample size, participants' characteristics (i.e., sex, age, type of tendinopathy), study design, comparison groups (i.e., contralateral asymptomatic limb or asymptomatic control), and physical impairments assessed (including methods used).
We used a modified version of the Black and Downs checklist to analyze the methodological quality of included studies. The Black and Downs checklist was validated to assess risk of bias in non-randomized and randomized studies17 and its modified version has been used in previous studies to assess risk of bias in observational studies.18–20 In this modified version, 12 items (1–3, 6, 7, 10–12, 15, 18, 20, and 27) related to reporting, external validity, and bias were assessed. Two reviewers separately assessed the risk of bias and a third reviewer was consulted to resolve any disagreements.
Data extracted from included studies were grouped based on the following constructs: lower limb ROM and flexibility measurements, muscle function and physical performance tests, and lower limb alignment and foot posture. Means and standard deviation (SD) or mean difference (MD) and 95 % confidence interval (CI) were extracted from included studies. For purposes of data pooling and effect size (ES) calculation, we adopted the following criteria: (1) if measures of central tendency and variability were reported in median and interquartile range, data were converted to mean and SD21,22; (2) if measures of variability were reported as standard error, data were converted to SD23; (3) if interventional studies included two groups of individuals with AT and described means and SD of affected and uninjured limbs for each group separately at baseline, we pooled data of the affected limb of both groups and the same was done for the uninjured limb data.23
Meta-analysis was performed when two or more studies assessed the same impairment. For meta-analysis purposes, when possible, pooled effect was expressed as MD and 95 % CI. If the same outcome was evaluated using different scales or methods, pooled effect was expressed as Hedges’ G and 95 % CI. All meta-analyses were conducted using the random effects model to account for statistical and clinical heterogeneity across studies. Regarding single studies, we opted to express results as ES and 95 % CI using the Hedges' G statistics displayed together in a forest plot for continuous variables. For paired comparisons, r = 0.7 was used as within-participant correlation to estimate Hedges’G. All analyses were performed using Comprehensive Meta-Analysis, V.2.0 (Biostat, Englewood, New Jersey, USA).
We used a modified version of the GRADE system24 to assess the certainty of the evidence. Four factors were considered to decide if the certainty of evidence should be downgraded: i) risk of bias; ii) imprecision; iii) indirectness, and iv) inconsistency. Risk of bias – evidence was downgraded if 25 % of the included studies did not clearly define outcomes or did not report any attempt to blind the outcome assessors; imprecision – the evidence was downgraded if 25 % or more of the included studies did not report a sample size calculation to ensure a sufficient power to detect a clinically important effect; indirectness – the evidence was downgraded when 25 % or more of the included studies did not use a valid and reliable method to assess the outcome; inconsistency – downgrading occurred if there was minimal or no overlap across CIs of the included studies or when a substantial statistical heterogeneity (i.e. I2> 50 %) was identified. The certainty of evidence was initially regarded as high and could be downgraded to moderate, low, or very low in the presence of one or more factors described above. For outcomes investigated by single studies, the evidence was considered to be of low quality because the studies were considered inconsistent and imprecise (i.e., sparse data).
ResultsThe electronic search identified 10,091 articles, excluding duplicates. After the selection process, 17 studies were considered eligible and included in this review, of which 12 were included in the quantitative synthesis. The flow diagram of the study screening and selection process is presented in Fig. 1.

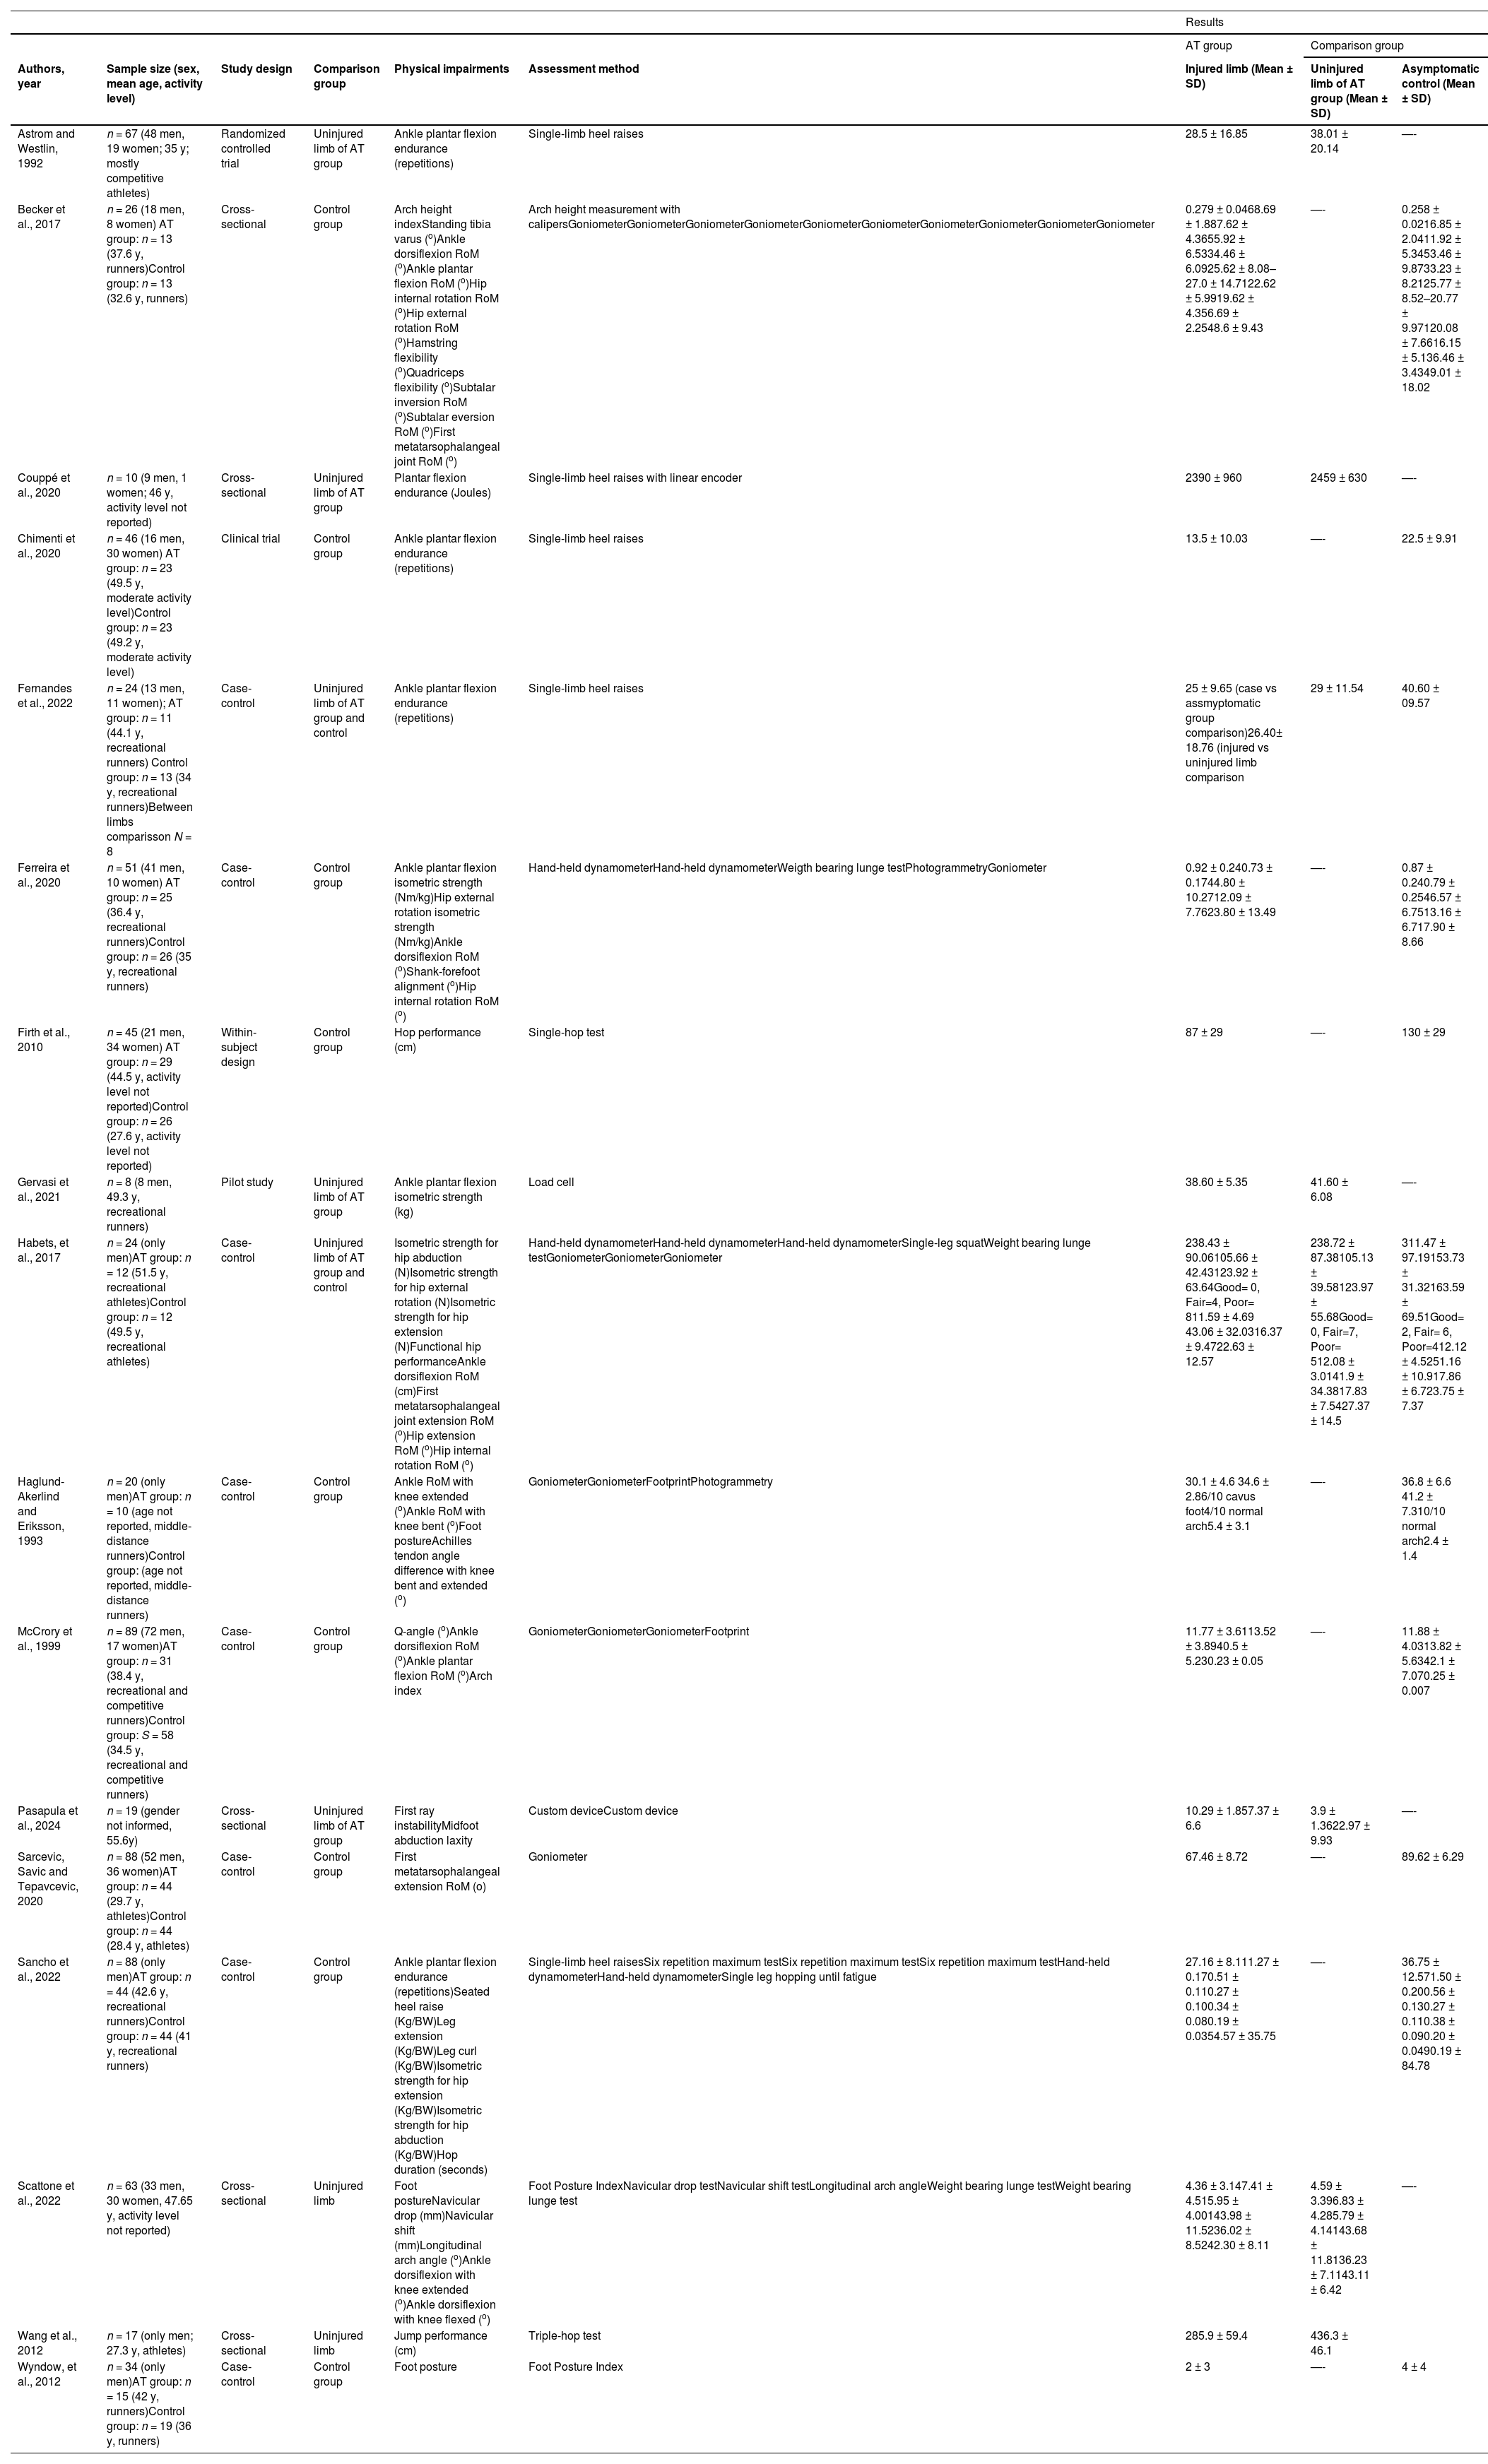
The included studies consisted of eight case-control,4,5,10,11,15,25–28 four cross-sectional,6,29–31 and four interventional studies.12,32–34 Sample size ranged from 8 to 89 with a total of 727 participants. The majority of participants were men (72 %) with six studies.4,6,10,27,28,34 including only males. Twelve studies included athletes4–6,10,11,15,25–28,32,34 (recreational or competitive levels) in which eight were runners,4,5,10,15,25–27,34 one study included active subjects,33 and in four studies12,29–31 the physical activity level was not reported. Ten studies included only individuals with mid-portion tendinopathy,4–6,11,26,27,29–31,34 three15,32,33 enrolled a mixed population of individuals with either insertional or mid-portion tendinopathy, and four studies10,12,25,28 did not specify location of AT. Detailed characteristics of included studies are provided in Table 1.
Studies Characteristics.
AT, Achilles tendinopathy; BW, body weight; RoM, range of motion.
Assessment of risk of bias of included studies is presented in Supplementary Material - S2. None of the included studies recruited a representative sample of the entire population and only one study.31 used blinded assessors for measuring the main outcomes. Most of the evidence was deemed low certainty with the evidence for only four variables being classified as moderate quality. The evidence for all analyzed data was downgraded for risk of bias. Detailed description of the certainty of evidence is provided in the Supplementary Material S3.
Quantitative synthesis with meta-analyses were conducted for the following variables: ankle dorsiflexion ROM, ankle plantar flexion ROM, first metatarsophalangeal joint ROM, hip internal rotation ROM, ankle plantar flexion endurance, hip external rotation isometric strength, hip abduction isometric strength, hip extension isometric strength, and arch height index.
Effect size analyses of individuals studiesEffect size and CIs of individual studies are reported in Fig. 2. Analyses revealed lower isotonic strength of the ankle plantar flexors and lower hop performance for the single and triple hop tests as well as lower hop duration in those with AT. Additionally, it was determined that individuals with AT, compared with an asymptomatic group, have larger Achilles tendon angle and tibia varus alignment. Also, individuals with AT had greater first ray and midfoot abduction laxity in their symptomatic compared with their non-symptomatic limb. For the remaining variables no differences were found between those with AT and the asymptomatic group (Fig. 2A) or between the symptomatic and non-symptomatic limbs of those with unilateral AT (Fig. 2B).
Meta-analysisAnkle dorsiflexion ROM
A subgroup analysis was conducted based on whether dorsiflexion ROM was assessed in a weight or non-weight bearing position and with knee bent or extended (Fig. 3A and B), or in a weight bearing position using the lunge test (Fig. 3C and D). Meta-analysis from two studies4,25 (n = 46) provided low quality evidence that ankle dorsiflexion ROM in a non-weight bearing position with knee bent is lower in individuals with AT (MD = 5.18, 95 % CI: 2.17, 8.19; I2 = 0.0) compared to asymptomatic individuals (Fig. 3A). For ankle dorsiflexion ROM in non-weight bearing position with knee extended (Fig. 3B), two studies5,10 (n = 109) provided very low quality evidence of no difference between individuals with and without AT (MD= 3.09, 95 % CI: −3.12, 9.31; I2 = 81.09). Similarly, meta-analysis from two studies4,15 (n = 75) showed low quality evidence of no difference in weight bearing ankle dorsiflexion ROM with knee bent (Fig. 3C) between individuals with AT and an asymptomatic group (ES= 0.17; 95 % CI: −0.27, 0.61; I2 = 0.0). Finally, pooling of two studies4,31 (n = 75) revealed moderate quality evidence of no difference in weight bearing ankle dorsiflexion ROM measured with knee extended (Fig. 3D) between symptomatic and non-symptomatic limb of those with AT (ES= 0.11, 95 % CI: −0.08, 0.29; I2= 0).

A – Quantitative synthesis of ankle dorsiflexion range of motion in open kinetic chain with knee bent: cases versus assymptomatic group. B – Quantitative synthesis of ankle dorsiflexion in open kinetic chain with knee extended: cases versus asymptomatic group. C – Quantitative synthesis of ankle dorsiflexion range of motion in closed kinetic chain with knee bent: cases versus asymptomatic group. D- Quantitative synthesis of ankle dorsiflexion range of motion in closed kinetic chain with knee extended: cases versus asymptomatic limb. E – Quantitative synthesis of ankle plantar flexion range of motion: cases versus asymptomatic limb; F – First metatarsophalangeal joint range of motion: cases versus asymptomatic group. G – First metatarsophalangeal range of motion: cases versus asymptomatic limb.
Meta-analysis from two studies5,25 (n = 115) for ankle plantar flexion ROM, revealed low quality evidence of no difference between individuals with AT and asymptomatic individuals (MD= 0.64, 95 % CI: −2.74, 4.02; I2 = 21.6) (Fig. 3E).
First metatarsophalangeal joint ROMMeta-analysis of three studies (n = 112)4,11,25 provided low quality evidence of no difference between individuals with AT and asymptomatic individuals (MD= 12.48, 95 % CI: −7.16, 32.13; I2 = 90.99) (Fig. 3F). Similarly, meta-analysis of two studies4,11 (n = 66) showed low quality evidence of no difference in first metatarsophalangeal joint ROM between the symptomatic and non-symptomatic limb (Fig. 3G) of those with AT (MD= 11.67, 95 % CI: −11.06, 34.4; I2= 89.62).
Hip ROMMeta-analysis using data from three studies (n = 101)4,15,25 showed low quality evidence of no difference between groups for hip internal rotation ROM (MD= −2.41, 95 % CI: −6.2, 1.38; I2 = 4.6) (Fig. 4A).

A – Quantitative synthesis of hip internal rotation range of motion: cases versus asymptomatic group. B – Quantitative synthesis of ankle plantar flexion endurance: cases versus asymptomatic group. C – Quantitative synthesis of ankle plantar flexion endurance: cases versus asymptomatic limb. D – Quantitative synthesis of hip external rotation isometric strength: cases versus asymptomatic group. E – Quantitative synthesis of hip abduction isometric strength: cases versus asymptomatic group. F – Quantitative synthesis of hip extension isometric strength: cases versus asymptomatic group. G – Quantitative synthesis of arch index: cases versus asymptomatic group.
Pooling of three studies26,27,33 (N = 158) demonstrated moderate quality evidence that individuals with AT have lower plantar flexion endurance (Fig. 4B) than asymptomatic individuals (MD= 10.47 repetitions, 95 % CI: 7.17, 13.76; I2=4.08). Pooling of three studies26,29,32 (N = 85) revealed very low quality evidence of no difference between the symptomatic and asymptomatic limb (Fig. 4C) of those with AT for ankle plantar flexion endurance (ES= 0.29, 95 % CI: −0.02, 0.59; I2=54.69).
Hip isometric strengthHip muscles isometric strength was also investigated in three studies.4,15,27 A pooled analysis (n = 75) (Fig. 4D) of two studies4,15 provided low quality evidence of no difference in hip external rotation isometric strength (ES= 0.56, 95 % CI: −0.12, 1.24; I2 = 49.94) between individuals with AT and asymptomatic individuals. For hip abduction isometric strength (Fig. 4E) a meta-analysis of two studies4,27 (N = 112) revealed moderate quality evidence of no difference between individuals with AT and asymptomatic individuals (ES= 0.38, 95 % CI: −0.00, 0.77; I2=4.84). Finally, meta-analysis of two studies4,27 (N = 112) revealed moderate quality evidence of lower hip extension isometric strength (ES= 0.49, 95 % CI: 0.11, 0.86; I2=0) when individuals with AT were compared with an asymptomatic group (Fig. 4F).
Arch indexArch index was assessed in two studies.5,25 The quantitative synthesis (n = 115) revealed very low quality evidence of no difference (MD= 0.001, 95 % CI: −0.03, 0.04; I2 = 85.66) between individuals with AT and asymptomatic individuals (Fig. 4G).
DiscussionOur findings revealed that individuals with AT have lower ankle dorsiflexion ROM in a non-weight bearing position with knee bent,10,25 lower endurance for ankle plantar flexion,26,27,33 and lower isometric strength for hip extension. Additionally, the ES analyses for individual trials showed differences for Achilles tendon angle, standing tibia varus alignment, and first ray and midfoot abduction laxity between those with AT and controls as well as a lower performance in jump tasks. No differences were found for the other variables.
Lower limb ROM and flexibility impairmentsOur data indicated that lower ankle dorsiflexion ROM in those with AT was observed only when ROM was assessed in a non-weight bearing with knee bent position. The reason for this result might be partially explained by a difference in soleus flexibility, assessed with knee bent,35 and the contributions of foot joints and increased torque on the talocrural joint when measured in weight bearing.36 Ankle dorsiflexion limitations may lead to increased tension in the Achilles tendon during running or gait which in turn may contribute to tendinopathy.37 Alternatively, individuals with AT may adopt a pattern of reduced ankle dorsiflexion motion during gait or running to avoid symptoms aggravation which may lead to reduced ankle dorsiflexion ROM. No other proximal (hip) or distal (ankle and foot) ROM deficits were identified in individuals with AT.
Physical performance testsMeta-analyses of three studies26,27,33 revealed lower endurance for ankle plantar flexion during a repeated heel raise test in those with AT compared to asymptomatic individuals. Similarly, individuals with AT showed lower ankle plantar flexion isotonic strength assessed through 6 repetition maximum (RM) test.27 Clinicians can use the repeated heel raise and 6 RM tests as they are sensitive to detect deficits in individuals with AT.27 However, caution is needed when relying in the asymptomatic limb as a reference because no side-to-side differences were observed in individuals with AT. Therefore, comparing heel raise results with normative values is recommended to evaluate impairment severity.38 There were also no differences in isometric strength for ankle plantar flexion.15,34 Our results are consistent with those of recent reviews8,9 indicating isotonic strength and endurance impairment in individuals with AT but no deficits in isometric strength. Finally, our review revealed deficits in isometric strength of the hip extensors in those with AT, which is consistent with studies showing impaired hip muscle function and altered muscular activity in this population.39,40 Therefore, clinicians should assess hip strength impairments in individuals with AT.
Two studies6,12 showed horizontal hop tests performance deficits in athletes with AT. Similarly, the review by Hasani et al.8 showed that individuals with AT have impaired hop performance when compared with a control group. As reactive strength index41 and power42 of lower limb are both predictive of hop test for distance, these components of muscle function may likely be impaired in lower limb muscles of those with AT. Also, Sancho et al.27 showed that those with AT had diminished single leg hop duration when compared with asymptomatic individuals. Clinicians should use jump tests to assess and monitor performance in individuals with AT.
Lower limb alignment and foot postureThe meta-analysis of two studies5,25 demonstrated no difference in arch height index between groups. Similarly, individuals with AT did not show any impairment when foot posture was assessed through foot posture index28 or footprint.10 Finally, no difference was revealed for the navicular drop and navicular shift tests between the symptomatic and asymptomatic limb in those with AT.31 Overall, these results may be indicative that no difference exists in variables related to static foot posture or alignment and that these factors are not affected in individuals with AT. Future studies should investigate variables such as intrinsic foot muscles strength, which can be assessed through clinician-friendly tests,43 considering that there is emerging evidence that those muscles might be compromised in individuals with AT.44
McCrory et al.5 assessed the Q-angle, and four studies10,15,25,30 examined foot or lower leg alignment. No Q-angle difference was found between individuals with AT and asymptomatic controls. We found conflicting results regarding lower leg and foot alignment. Ferreira et al.15 found no differences in shank-forefoot alignment between those with AT and asymptomatic individuals. In contrast, Haglund et al.10 found that individuals with AT had higher Achilles tendon angle, which is formed by the midlines of the calcaneus and lower leg and reflects subtalar joint position. Pasapula et al.30 found greater first ray and midfoot abduction laxity suggesting medial arch instability associated with AT. Finally, Becker et al.25 found increased tibia varus in those with AT. Differences in methods to assess alignment may explain these discrepancies. Lower leg and foot alignment are thought to be related to dynamic foot pronation, potentially increasing Achilles tendon stress.45 A recent review concluded that those with AT may have increased rearfoot eversion and time to maximum pronation.46 Alternatively, altered foot and lower leg alignment may heighten soleus activity.47 and place greater demand on the muscle-tendon complex. Future studies should use standardized clinical measures to facilitate quantitative synthesis of foot and lower leg alignment in those with AT.
The certainty of evidence assessed through GRADE was very low or low for most data included in the meta-analysis. All evidence was downgraded based on the risk of bias criteria, mostly, because no blinding was conducted for the assessors of the main outcomes. These issues diminish the confidence of evidence related to differences or the absence of differences between AT and control individuals, highlighting the need for high-quality future studies. Specifically, future studies investigating physical impairments with clinician-friendly measures should blind assessors and perform a priori sample size calculation. Clinicians should consider assessing ankle plantar flexors strength, hip extensors isometric strength, hop distance, and ankle dorsiflexion RoM as these variables might be affected in those with AT and are easily measurable.
LimitationsSignificant heterogeneity (I2 > 50 %) in 41 % of the quantitative synthesis limits result generalization. This is likely explained by the different measures used to assess the same variable combined with the lack of reliability analyses for most clinical measures, which likely increases the potential for systematic error. Additionally, with only 27 % women and mostly active individuals, different results might be expected among women and sedentary samples.
ConclusionLow to moderate quality evidence suggest that individuals with AT have lower ankle dorsiflexion ROM with knee bent when assessed in non-weight bearing and decreased jump performance, ankle plantar flexion muscular endurance, and hip extension isometric strength. In addition, these individuals appear to have a greater Achilles tendon angle and tibia varus alignment as well as first ray and midfoot abduction laxity. Importantly, clinicians may use these clinician-friendly measures to identify these impairments in patients with AT.
The authors declare no competing interests.
The authors gratefully acknowledge financial support offered by Fundação de Amparo à Pesquisa do Estado de Minas Gerais and Conselho Nacional de Desenvolvimento Científico e Tecnológico (CNPq- Process: 305285/2021–1).
This study was financed in part by the Coordenação de Aperfeiçoamento de Pessoal de Nível Superior - Brasil (CAPES - Finance Code 001, Process:88882.349237/2019–01).


