


To assess the prevalence of the use of 95% confidence intervals in the reporting of between-group differences in randomized controlled trials of physical therapy interventions and to determine if the prevalence is changing over time.
MethodsObservational study, including an analysis of 200 trials from the Physiotherapy Evidence Database: 50 from each of the years 1986, 1996, 2006, and 2016. The primary outcome used was the prevalence of the between-group difference presented with 95% confidence intervals. We also extracted trial characteristics for descriptive purposes (i.e., number of participants, number of sites involved in recruitment, country(ies) of data collection, funding, subdiscipline of physical therapy, publication language and total Physiotherapy Evidence Database score).
ResultsMost commonly, the trials were published in English (89%) and classified in the musculoskeletal subdiscipline (23%). The overall prevalence of use of confidence intervals was 29% and there was a consistent increase in reporting between 1986 and 2016, with peak usage in the 2016 cohort (42%). Confidence intervals were more likely to be used in trials that had received funding, were conducted in Europe and Oceania, and in trials with a Physiotherapy Evidence Database score of at least 6/10.
ConclusionsMost trials of physical therapy interventions do not report confidence intervals around between-group differences. However, use of confidence intervals is increasing steadily, especially among high-quality trials. Physical therapists must understand confidence intervals so that they can understand a growing number of trials in physical therapy.
Clinicians worldwide are implementing a transition to evidence-based practice. One of the main components of evidence-based practice involves clinicians interpreting and critically appraising the evidence for its validity and applicability.1 When considering whether to use an intervention with a patient, clinicians are encouraged to identify high-quality clinical research (systematic reviews and randomized controlled trials) and to consider its estimate of the size of the treatment effect of the intervention.1,2
One of the most common statistical approaches used to detect the effect of interventions involves significance testing.3 Traditionally, p-values are used to interpret the result of significance testing. In general terms, the p-value summarizes the compatibility between the observed data and what we would expect to see if all the assumptions used to compute the p-value were correct.4 In the context of testing a between-group difference in a randomized controlled trial, one assumption is the null hypothesis, i.e., the assumption that the study treatment makes no difference to the average outcome. However, there are other assumptions made in calculating p-value, such as assumptions about how the data were distributed and how the analysis was conducted. Many people misinterpret the p-value as only testing the null hypothesis assumption, but in fact it tests all the assumptions. In a between-group comparison in a trial, the difference between the observed data and what we would expect to see based on all the assumptions is calculated as a t-statistic or a Chi-squared statistic. The p-value is then the probability that that difference would have been at least as large as its observed value if every model assumption (including the null hypothesis) were true.4 The p-value can be viewed as a measure of how well the observed data fit with the assumptions made, ranging from 0 for poor fit to 1 for perfect fit. Usually, however, the p-value is dichotomised into significant or not, based on the 0.05 threshold.
Even when p-values are interpreted correctly, they do not portray some crucial information about the magnitude or the clinical relevance of the difference between the groups.5,6 Thus, a statistically significant finding should not be interpreted on its own to influence clinical practice.6,7 The p-value also provides no information about the uncertainty around the trial's estimate of the effect of the intervention. All such estimates are associated with uncertainty, even if trials are well designed and conducted, because the observed difference is only an estimate of the true effect of treatment derived from the sample of participants in the trial.8,9
Confidence intervals have been proposed as an alternative to significance testing reported using p-values.6,10,11 When reporting a trial's estimate of the effect of an intervention, a confidence interval describes the uncertainty around that estimate by defining two values, one on either side of the estimate. Most often the 95% confidence interval is used, meaning that 95% of the time, the true average effect of the intervention (i.e., the effect that the trial is trying to estimate) will fall within the interval between those two numbers. Therefore, the 95% confidence interval is the interval within which we can be 95% confident that the true average effect of the intervention actually lies.8,9,12,13 Confidence intervals indicate the precision of the estimate. This provides researchers and clinicians with a much more informative view of how much of an effect an intervention had, compared with only observing if there was statistical significance via a p-value.6,7,13
Many journals6–11 and reporting guidelines14–16 have been recommending the use of confidence intervals since as early as 1986. However, only a few studies have investigated how commonly authors report this measure; with 54% in public health trials, and 86% in epidemiology reporting confidence intervals.17,18 These studies, however, focused on high prestige journals, which may be unrepresentative of journals generally. As a result, the current prevalence of use of confidence intervals and whether the prevalence is changing over time are still unknown. Rigorous evaluation of how between-group differences are reported in a representative sample of trials is required to determine if reporting guidelines and journal editorial policies have been sufficient to shift reporting from p-values to treatment effect estimates. The representative sample of trials is also important to assess whether the usage of confidence intervals is increasing over time, because it is plausible that the stance taken by the high prestige journals could gradually filter down to lower prestige journals. This information could be used to promote the uptake of reporting of confidence intervals, which will ultimately assist clinicians to make more-informed decisions in their clinical practice.
One field in which a representative sample of trials can be obtained is physical therapy, because the Physiotherapy Evidence Database (PEDro; www.pedro.org.au) comprehensively indexes trials regardless of the publishing journal.19,20 Therefore, the first aim of this study was to assess the prevalence of the use of 95% confidence intervals in the reporting of between-group differences in reports of randomized controlled trials of physical therapy interventions. The second aim was to determine if the prevalence is changing over time.
MethodsDesignWe extracted a random sample of 200 published articles reporting randomized controlled trials: 50 from each of the years 1986, 1996, 2006, and 2016 to form representative samples at regular time points for analysis of change over time. The sample size of 200 was chosen because it gives overall estimates of prevalence that have confidence limits of ±7% or smaller, which we consider to be sufficiently precise estimates to characterize the use of 95% confidence intervals. Random sampling was performed using Microsoft Excel software (Microsoft Office 2007, Microsoft Corporation, Redmond, Washington). The trials were selected from the February 6, 2017 update of PEDro. PEDro was used because it is one of the most complete indexes of trials for an entire profession,19,20 plus all trials are evaluated for methodological quality and completeness of statistical reporting using the PEDro scale.21,22
EligibilityBecause trials were selected from the PEDro database, the eligibility criteria used for indexing trials on that database were by default applied to our cohort of trials. Briefly, the trials must be published in peer reviewed journals and use (quasi-)random allocation to estimate the effects of interventions that are (or could be) part of physical therapy practice in patients.23 In addition, we included articles that presented a trial's primary analysis, with no restriction by language of publication or area of physical therapy practice. Pilot studies and articles presenting secondary analyses were excluded. Full-text copies of the published articles were acquired and, if cited in the article, any online supplementary material was also obtained.
The small proportion of articles in each of the target years that failed to include a between-group statistical comparison were excluded based on the score for Item 10 of the PEDro scale, prior to random selection of the 50 trials from each year. Also excluded were articles that were still in the process of being indexed on PEDro (i.e., those without complete indexing terms and PEDro scale evaluation).
Data extractionBibliometric data, language of publication, subdiscipline of physical therapy (cardiothoracic, continence and women's health, ergonomic and occupational health, gerontology, musculoskeletal, neurology, oncology, orthopaedics, paediatrics, sports, and other), and PEDro scale were downloaded from PEDro. In cases where the trial was classified in more than one subdiscipline, one of the investigators selected the single most relevant subdiscipline for the trial. For the PEDro scale, all trials are double-rated by trained staff/volunteers and any disagreements are arbitrated by a third rater. The PEDro scale has good reliability and validity.21,22
Reporting of confidence intervals was extracted from the included trials. Trials were coded as ‘yes’ if 95% confidence intervals were reported for at least one between-group difference for one outcome. Confidence intervals for other types of analysis (e.g., baseline characteristics, within-group comparisons) were not considered. We also extracted the types of outcomes presented, coded as continuous, dichotomous, or both, and if the trial reported a primary outcome (i.e., the terms primary, principal, main or key were used when specifying the outcome). In trials that had more than one primary outcome, we also recorded whether there was any adjustment for multiple comparisons (including Bonferroni, sharpened Bonferroni, Dunn). We also extracted the number of participants, reporting of a sample size calculation, number of sites involved in recruitment, country(ies) where the study was conducted, and if the study was funded. We accepted only funding for the trial, not funding for authors. If funding was not specified, the item was rated as unclear. Two independent reviewers extracted these data, with any disagreements resolved by discussion. When trials were published in languages other than English, two bilingual colleagues for each language extracted the data and resolved disagreements by discussion.
The primary outcome used in our analysis was the reporting of the between-group differences (PEDro item 10) presented with 95% confidence intervals. The trial characteristics used for descriptive purposes were: number of participants, number of sites involved in recruitment (single-centre vs multi-centre), country(ies) of data collection (which were collapsed into continent of data collection), funding, number of primary outcomes, subdiscipline of physical therapy, and total PEDro score (raw score or dichotomized as ≤5 and >5).
Data analysisTrial characteristics and prevalence of the use of confidence intervals were summarized with descriptive statistics. The prevalence of the use of confidence intervals was presented graphically, with stratification by trial characteristics. These characteristics were funding, single/multi-centre, continent, subdiscipline and total PEDro score. These analyses were presented first separately and also for the 200 trials pooled, with weighting applied for the total number of trials published each year.
Each year, a greater number of trials evaluating physical therapy interventions are published than in the preceding year. By sampling 50 trials from each of the four nominated years (1986, 1996, 2006, 2016), we were able to generate representative samples at regular time intervals to examine changes over time. However, analysis of the characteristics of the four cohorts pooled would not be representative of the body of trials of physical therapy interventions because it would over-represent the earlier years. Therefore, we calculated a weighting factor for each publication year, calculated as the total number of trials indexed on PEDro with that publication year divided by the number of trials in that year's sample (i.e., 50). For any pooled analysis, first the numerator and denominator for each year were multiplied by this weighting factor. Then all the numerators were summed, and all the denominators were summed. The resulting pooled numerator and pooled denominator were scaled down until the denominator equalled the original number of trials entered into the weighted calculation. The re-weighted numerator and denominator were then used to calculate the proportion and its 95% confidence interval. The weighted analyses are more representative of the body of trials indexed on PEDro.
One-way analysis of variance (ANOVA) and Dunn's multiple comparisons post hoc tests were used to compare the total PEDro score over the years. We also performed a Mann–Whitney test to compare data from trials that reported or did not report confidence intervals. A significance threshold of 5% was adopted and GraphPad software was used for analysis.
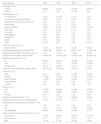
ResultsThe February 6, 2017 update of PEDro contained 28,216 trials, of which 3214 were published in 1986, 1996, 2006 or 2016. About 10% of trials were excluded because they were in-process (n=156) or did not report a between-group comparison (n=172). 50 trials were randomly selected from the remaining 170 trials published in 1986, 380 published in 1996, 1099 published in 2006, and 1237 published in 2016. The main characteristics of the selected trials are presented in Table 1. Most of the trials were published in English (89%). Other languages were: Chinese (n=14), Dutch (n=1), French (n=1), German (n=3), Japanese (n=1), Korean (n=1) and Spanish (n=2). Majority of trials were classified in the musculoskeletal (23%), continence and women's health (14%) and cardiothoracic (12%) subdisciplines. There was a significant increase (p<0.0001) in methodological quality with time when the 2016 total PEDro scores were compared with the 1986, 1996 and 2006 cohorts. Several of the variables showed consistent increases with time, including the proportions of trials that: included a sample size calculation, had multi-centre recruitment, and specified the primary outcome(s).
Summary characteristics extracted from the published reports of the 50 trials randomly selected from 1986, 1996, 2006 and 2016.
| Extracted data | 1986 | 1996 | 2006 | 2016 |
|---|---|---|---|---|
| Language, n (%) | ||||
| English | 48 (96) | 47 (94) | 34 (68) | 48 (96) |
| Others | 2 (4) | 3 (6) | 16 (32) | 2 (4) |
| Subdiscipline, n (%) | ||||
| Cardiothoracic | 5 (10) | 10 (20) | 5 (10) | 4 (8) |
| Continence and women's health | 8 (16) | 5 (10) | 7 (14) | 7 (14) |
| Ergonomics and occupational health | 0 (0) | 3 (6) | 0 (0) | 2 (4) |
| Gerontology | 1 (2) | 7 (14) | 6 (12) | 1 (4) |
| Musculoskeletal | 15 (30) | 5 (10) | 12 (24) | 13 (26) |
| Neurology | 3 (6) | 6 (12) | 6 (12) | 3 (6) |
| Oncology | 0 (0) | 0 (0) | 0 (0) | 1 (2) |
| Orthopaedics | 3 (6) | 2 (4) | 2 (4) | 6 (12) |
| Paediatrics | 7(14) | 6(12) | 4 (8) | 2 (4) |
| Sports | 0 (0) | 4 (8) | 4 (8) | 6 (12) |
| Other | 8 (16) | 2 (4) | 4 (8) | 5 (10) |
| Total PEDro score (0–10) | ||||
| Median [IQR] | 4 [3; 5] | 4 [4; 6] | 5 [4; 6] | 6 [5; 7]* |
| Randomized participants, median [IQR] | 50 [26; 93] | 59 [39; 118] | 82 [57; 147] | 81 [39; 123] |
| Sample size calculation presented, n yes (%) | 1 (2) | 7 (14) | 13 (26) | 32 (64) |
| Sample size calculated, median [IQR] | 40 [40; 40] | 104 [36; 200] | 120 [69; 179] | 89 [48; 173] |
| Multicenter recruitment, n (%) | ||||
| No | 26 (52) | 20 (40) | 28 (56) | 25 (50) |
| Yes | 2 (4) | 8 (16) | 15 (30) | 19 (38) |
| Not specified | 22 (44) | 22 (44) | 7 (14) | 6 (12) |
| Sites involved if multicenter, median [IQR] | 20 [17; 22] | 14 [3; 52] | 7 [4; 17] | 3 [2; 8] |
| Continent, n (%) | ||||
| Asia | 1 (2) | 3 (6) | 21 (42) | 15 (30) |
| Europe | 27 (54) | 20 (40) | 12 (24) | 17 (34) |
| North America | 19 (38) | 24 (48) | 14 (28) | 9 (18) |
| South America | 1 (2) | 0 (0) | 0 (0) | 2 (4) |
| Oceania | 2 (4) | 3 (6) | 3 (6) | 7 (14) |
| Funding, n (%) | ||||
| Yes | 19 (38) | 30 (60) | 18 (36) | 29 (58) |
| No | 27 (54) | 18 (36) | 30 (60) | 17 (34) |
| Unclear | 4 (8) | 2 (4) | 2 (4) | 4 (8) |
| Primary outcome identified, n (%) | 4 (8) | 11 (22) | 22 (44) | 33 (66) |
| Number of primary outcomes, median [IQR] | 4 [1; 9] | 2 [1; 7] | 1 [1; 2] | 1 [1; 2] |
| Adjustment for multiple primary outcomes, n (%) | ||||
| Yes | 1 (2) | 1 (2) | 2 (4) | 3 (6) |
| No | 3 (6) | 5 (10) | 14 (28) | 12 (24) |
| Not applicable | 46 (92) | 44 (88) | 34 (68) | 35 (70) |
| Types of outcomes presented in the trial, n (%) | ||||
| Continuous | 21 (42) | 29 (58) | 22 (44) | 31 (62) |
| Dichotomous | 2 (4) | 0 (0) | 8 (16) | 1 (2) |
| Both | 27 (54) | 21 (42) | 20 (40) | 18 (36) |
IQR, interquartile range.
The overall prevalence of use of confidence intervals (for at least one outcome) was 29% and the proportion of trials that reported confidence intervals for the between-group comparisons increased consistently between 1986 (2%) and 2016 (42%), as presented in Fig. 1. The increase over time was evident regardless of whether the use of confidence intervals was analyzed as ‘use with all outcomes’ or ‘use with at least one outcome’. In the 1986 cohort, the one trial that reported a confidence interval did so for a dichotomous outcome. From 1996 forward, however, the presentation of confidence intervals was most common for continuous variables (Fig. 1).
 reported 95% confidence intervals for at least one outcome and (B) reported 95% confidence intervals for continuous and/or dichotomous outcomes.")
We also analyzed the proportion of trials that reported 95% confidence intervals within the following strata: centres involved in recruitment (single-centre vs multi-centre), funding, continent, subdiscipline and total PEDro score (>5 vs ≤5). When these analyses were performed for each year (Fig. 2), few of these factors were consistently associated with the use of confidence intervals. Significant differences occurred between some continents and between some subdisciplines, but these differences were transient and generally disappeared in the most recent cohort. In contrast, several statistically significant differences emerged in the weighted analysis of the pooled cohort (Fig. 3). Confidence intervals were more likely to be used among trials that had received funding than among unfunded trials. Trials conducted in Europe and Oceania were more likely to use confidence intervals than trials conducted in Asia and North America. Neurology trials were more likely to use confidence intervals than cardiothoracic trials. Confidence intervals were more likely to be used among trials with a total PEDro score of at least 6 than among lower quality trials.
 among the 50 trials randomly selected from each of the 4 years examined in the study, categorized by site, funding, continent, subdiscipline and total PEDro score.")
 for all years combined (200 trials), categorized by site, funding, continent, subdiscipline and total PEDro score. See main text for details of the weighting procedure.")
The comparisons of number of participants, total PEDro score and number of primary outcomes between trials that did and did not report 95% confidence intervals are presented in Table 2. Trials that reported confidence intervals had some significantly better characteristics than trials that did not report confidence intervals. These significant differences were: greater median number of participants (in the 2006 and 2016 cohorts); higher median PEDro scores (in the 1996, 2006 and 2016 cohorts); and lower median number of primary outcomes (in the 2016 cohort only).
Mann–Whitney test comparisons between the trials that did and did not report 95% confidence intervals for at least one outcome for three characteristics: number of participants, total PEDro score, and number of primary outcomes identified.
| CharacteristicYear | Reported 95% confidence interval | Did not report 95% confidence interval | p value |
|---|---|---|---|
| Number of participants | |||
| 1986 | 49 [49; 49] | 50 [27; 94] | N/A* |
| 1996 | 80 [43; 239] | 57 [35; 101] | 0.20 |
| 2006 | 108 [80; 248] | 75 [44; 131] | 0.03 |
| 2016 | 114 [49; 252] | 60 [33; 103] | 0.008 |
| PEDro score (0–10) | |||
| 1986 | 3 [3; 3] | 4 [3; 5] | N/A* |
| 1996 | 6 [5; 6] | 4 [4; 5] | 0.004 |
| 2006 | 6 [6; 8] | 5 [4; 7] | 0.000 |
| 2016 | 7 [6; 8] | 5 [5; 7] | 0.000 |
| Number of primary outcomes | |||
| 1986 | 0 [0; 0] | 4 [1; 9] | N/A* |
| 1996 | 9.5 [1; 18] | 1 [1; 3] | 0.49 |
| 2006 | 1 [1; 1] | 1 [1; 3] | 0.49 |
| 2016 | 1 [1; 1] | 2 [1; 3] | 0.02 |
This study demonstrated that less than one-third of a representative sample of trials of physical therapy interventions reported confidence intervals for between-group comparisons, with an overall prevalence of 29% in the weighted analysis of the pooled cohort of 200 trials. This prevalence is lower than equivalent analyses in other disciplines; 54% of trials in public health and 86% of trials in epidemiology published in 1982–2000,18 74% of journal abstracts in medicine, and 83% of abstracts in epidemiology.17 This difference may at least in part be due to the fact that the present study used a representative cohort of trials, rather than trials from high prestige journals only. High prestige journals are typically early adopters of reporting initiatives such as the CONSORT Statement.
Despite the low prevalence of the use of confidence intervals overall, this study nevertheless identified several favourable trends among the trials. After only a single trial in the 1986 cohort reported confidence intervals, each subsequent year analyzed showed consistent increases in the proportion of trials that used confidence intervals. There were also progressive increases in the proportion of trials that used confidence intervals for all (as opposed to some) between-group comparisons (Fig. 1). These progressive increases suggest that awareness of the value of confidence intervals is increasing among clinical trialists. Similar trends have been noted outside physical therapy, with the percentage of abstracts with confidence intervals increasing from approximately zero in the mid-1970s to 79% in 2014.17 Editors and reviewers could refer to these consistent increases over time to show authors who are reluctant to use confidence intervals that their importance is being increasingly recognized. These findings may also convince readers who are unfamiliar with confidence intervals to upskill in this area so that they will be able to understand the growing proportion of trials that are reported using confidence intervals. Authors, reviewers and editors who are unfamiliar with confidence intervals can access several resources online for free, including excellent introductory papers8,9 and a user-friendly, Excel-based, confidence interval calculator.24
We hypothesize that the trend of increased reporting of 95% confidence intervals over time may be due in part to an emphasis on improved reporting of trials (e.g., Item 12a of CONSORT Statement16 and Items 10 and 11 of the PEDro scale16,21 encourage reporting of the estimated effect size with its confidence interval). These reporting elements are required for submissions of trials in many healthcare journals. This hypothesized explanation is supported by the concurrent increases in the number of PEDro criteria met by the trials over the same period (Table 1). This explanation is supported by the concurrent improvements in the prevalence of other aspects of design and reporting, such as having an explicit sample size calculation, multi-centre recruitment, and specifying primary outcome(s) (Table 1).
In the weighted analysis of the pooled cohort (Fig. 3), the significant differences in the use of confidence intervals between some strata indicate some groups of researchers that could be particularly encouraged to increase their use of confidence intervals – such as those in the cardiothoracic subdiscipline and those conducting trials in Asia and North America. That encouragement might come from the other two statistically significant associations in Fig. 3. First, higher quality trials are more likely to be reported with confidence intervals, suggesting that skilled researchers realize the value of confidence intervals. Second, funded trials are more likely to be reported with confidence intervals. Although we cannot determine causation in either of these findings, it is possible that a research protocol that indicates that confidence intervals will be reported is seen as more worthy of being funded.
This study had many strengths. The cohorts of trials studied were representatively sampled from a bibliographic database with comprehensive coverage of trials for an entire discipline.19,20 Sampling of trials was not limited to particular journals and language bias was avoided. Duplicate data extraction based on the full-text version of the articles (not the abstracts only) was used. Quality ratings were based on duplicate ratings with a scoring system that has good reliability and validity,21,22 and we analyzed whether confidence intervals were used with all or only some of the between-group comparisons reported in each trial.
Study limitationsThe study did not analyze whether confidence intervals were presented numerically or graphically, nor how the confidence intervals were used when interpreting the results. Both elements have been evaluated in studies of other disciplines,18 and could be the focus of future research for physical therapy trials. For example, the validity of any interpretation of the confidence interval provided by the authors could be evaluated in relation to factors like the smallest worthwhile effect. A small number of trial characteristics (number of sites, funding, geographic location, subdiscipline and total PEDro score) were considered for their impact on the use of confidence intervals. The associations between a more comprehensive list of trial characteristics and the reporting of confidence intervals could be evaluated using logistic regression analysis.
ConclusionsA minority of randomized controlled trials of physical therapy interventions are reported with confidence intervals around the between-group differences. This indicates that authors, editors and reviewers should undertake to increase the use of confidence intervals in the reporting of trials. Despite its current low prevalence, the use of confidence intervals has been increasing steadily over the past three decades. Higher quality trials are more likely to report confidence intervals. This suggests that readers of trials need to understand confidence intervals if they are to understand the rapidly growing body of high-quality evidence that uses confidence intervals.
Conflicts of interestThe authors declare no conflict of interest. The authors declare that no reprints are available.
The authors acknowledge the support from the Department of Education and Training and Australian Academy of Science.
Study was performed at The University of Sydney, School of Public Health, Musculoskeletal Health Sydney.


