


The PM-Scale was developed specifically to assess participation in individuals after stroke based on the concepts contained in the International Classification of Functioning, Disability and Health. However, this measure is only available in English and French.
ObjectiveTo translate and cross-culturally adapt the PM-Scale to Brazilian Portuguese, followed by the validation and testing of reliability of the translated version.
MethodsThe translation process followed standard guidelines. Preliminary test-retest reliability was determined using the intraclass correlation coefficient (ICC2,1). The Rasch model was employed to analyse the validity, unidimensionality, invariance, and internal consistency of the Brazilian version of the PM-Scale.
ResultsThe final translated version of the PM-Scale presented appropriate semantic, idiomatic, cultural, and conceptual equivalence. The preliminary analysis revealed excellent intra-observer and inter-observer reliability (ICC2,1 = 0.91; 95%CI: 0.83, 0.95 and ICC2,1 = 0.81; 95%CI: 0.64, 0.89, respectively). The analysis of the Rasch model revealed only one erratic item. An excellent overall fit was found for items (mean ± SD = 0.01 ± 1.02) and adequate fit was found for persons (mean ± SD = 1.16 ± 0.88). Internal consistency was considered adequate (person separation index = 1.77, reliability = 0.76). No significant invariance was found with regards to the personal characteristics of the sample (p > 0.05).
ConclusionThe Brazilian version of the PM-Scale is a valid, unidimensional, linear, reliable scale for measuring participation in stroke survivors and can be administered in less than five minutes.
Disability following a stroke exerts an impact on functioning, with direct effects on activities of daily living,1 psychosocial function, and social participation.2,3 According to the International Classification of Functioning, Disability and Health (ICF), participation defined as engagement and social interaction with others,4 is an important factor of social reintegration after stroke.4-6
Several instruments have been developed to assess participation.7,8 Those that have been translated and cross-culturally adapted and have adequate measurement properties for the Brazilian population are the Stroke Impact Scale (SIS),9 Assessment of Life Habits (LIFE-H),10 Stroke Specific Quality of Life (SS-QOL),11,12 and Satispart Stroke (SATIS-Stroke).13,14 Studies linking these measures to the ICF8,15 revealed that these instruments mainly assess the “body functions” and “activities” components.8,11 Unlike other available instruments, SATIS-Stroke was developed for the assessment of satisfaction with activities and participation in stroke survivors, encompassing the nine ICF activity and participation domains.14,16 However, the measure does not exclusively assess participation; it also considers aspects related to satisfaction regarding the capacity to execute tasks and issues related to performance in real life.17
For the exclusive assessment of participation following stroke, Kossi et al.18 developed the Participation Measurement Scale (PM-Scale), the conceptual framework of which was based on the nine ICF activity and participation domains.4,17 This is an unidimensional, reliable, invariant, linear, responsive assessment scale based on the ICF and created using the Rasch model.16 However, the PM-Scale was originally published in French and validated for the African population, with a subsequent version translated into English.18,19 Thus, sociocultural differences between continents needs to be considered when measuring latent variables such as participation.4 Therefore, the aims of the present study were to: 1) perform the translation and cross-cultural adaptation of the PM-Scale to Brazilian Portuguese, 2) test its preliminary reliability on stroke survivors, and 3) measure the validity of the scoring patterns of the items and answers using the Rasch model.
MethodsStudy design and ethical aspectsA methodological cross-sectional study was conducted involving the translation and cross-cultural adaptation of the English version of PM-Scale questionnaire to Brazilian Portuguese. The translation process received authorisation from the authors who developed and validated the original questionnaire in French and English versions.18 This study received approval from the institutional review board of Universidade Nove de Julho, São Paulo, Brazil (certificate number: 15150719.0.0000.5511).
All participants signed a statement of informed consent and needed to meet the following criteria: a clinical diagnosis of stroke, at least six months since the stroke event, age 18 years or older, and hemiparesis. Individuals with hearing impairment, motor aphasia, comprehension aphasia, or cognitive impairment determined using the Mini Mental State Examination (MMSE)20 were excluded from the study.
Sample sizeA two-tailed 99% confidence interval with a standard error ± 2.6 (S.E.) were considered in the calculation of the sample size. For a ± 1 logit interval, the standard error is ± 1/2.6 logits. This gives a minimum sample in the range 4*(2.6)2 < N < 9*(2.6)2, i.e., 27 < N < 61, depending on targeting. Thus, a sample of 50 well-targeted participants is conservative for obtaining useful, stable estimates.21 The sample size should be increased by 40% in the presence of large sources of unmodeled measurement disturbances, such as different test conditions.21 Thus, the minimum sample size is 70 participants. In the present study, we included 75 participants both for item calibration and reliability.
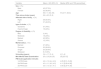
Description of PM-ScaleThe PM-Scale has 22 items with three response options for each item (“not at all”, “weakly”, or “strongly”). “Not at all” means that the individual does not participate in the action at all; “weakly” means that the participant participates but infrequently; and “strongly” means that the individual participates actively and often. Each item is scored from 0 to 2 points. The maximum is 44 points, with higher scores denoting greater participation.18 The raw final score of the PM-Scale must be transformed into logits of the Rasch model (see Appendix 1).18 Actions not performed in the previous three months or never performed are marked “missing” and represented by a question mark on the scale. In such cases, the logit score is obtained through an online analysis using the following link: http://rssandbox.iescagilly.be/pm-scale-online-analysis.html.
Procedures for translation and cross-cultural adaptationThe translation and cross-cultural adaptation of the PM-Scale were performed following internationally recommended norms22 and consisted of six phases. According to Beaton et al.,22 Step I of the translation and cross-cultural adaptation process consists of the initial translation. In this phase, the PM-Scale was translated into Portuguese by two Brazilian translators fluent in both Portuguese and English. These translators had different profiles. Translator 1 (T1) was informed about the concepts of the scale and Translator 2 (T2) was not informed. Thus, two independent versions were generated (T1 and T2).
In Step II (synthesis of translations), the two translators assessed the translations and synthesised a single version (T12). In Step III, the synthesised version (T12) was back-translated into English by translators fluent in Portuguese and English, generating two back-translated versions (BT1 and BT2) used to identify the validity of the translated version through comparisons between the original English-language version and back-translated versions.
In Step IV, the scale was judged by a committee of experts in neurofunctional physical therapy with extensive knowledge regarding the conceptual and taxonomic framework of the ICF and methodological studies. The language specialists and translators who participated in the first phases of the translation process also participated in this phase. This step was crucial to the achievement of cross-cultural equivalence. The role of the expert committee was to consolidate the translated version of the scale and develop the pre-final version to be used in the field test.
In Step V, a field test was performed with the pre-final version involving 40 stroke survivors, as recommended in the Guidelines for the Cross-Cultural Adaptation of Self-Report Measures.22
In Step VI (submission and assessment of all written reports), all reports and forms were presented to the expert committee, accompanied by the translated version of the scale. The committee then verified whether all steps of the translation and cross-cultural adaptation process were followed and whether the reports adequately portrayed this process.
Procedures for reliabilityThe PM-Scale was administered in interview form by two trained observers (physical therapists with at least 2 years of experience) to pose the questions in a standardized manner. Observer I administered PM-Scale twice (test-retest) with an interval of 7 to 14 days between the first and second assessment. Observer II also administered PM-Scale for the determination of inter-observer reliability. The three random administrations of PM-Scale were performed on different occasions considering the interval of 7 to 14 days from the first evaluation. This minimum interval of 7 days between assessments is necessary to avoid the memorisation of the answers and a maximum of 14 days is needed to avoid the occurrence of a change in the respondent's participation.23
Statistical analysisThe Shapiro-Wilk test was used to determine the normality of the data. Parametric data were expressed as mean and standard deviation (SD). Nonparametric data were expressed as median and interquartile range. Categorical variables were described in absolute values and percentage of the total sample. The average time required to complete the PM-Scale was also calculated.
Intraclass correlation coefficients (ICC2,1) were used with respective 95% confidence intervals (CIs) for the analysis of intra-observer and inter-observer reliability. ICC2,1 value were interpreted as follows: < 0.40 = weak reliability, 41 to 0.75 = moderate reliability, and > 0.75 = excellent reliability.24
The internal consistency of the PM-Scale was determined using the person separation index, which is interpreted in a way very similar to Cronbach's alpha25,26 and indicates the extent to which different participation levels can be distinguished in the sample.27,28 A person separation index of 1.50 is considered acceptable, 2.00 is considered good, and 3.00 is considered excellent.29 The item separation index has the same criteria and is interpreted the same way as the person separation index and reliability.29
Rasch analysis and item selectionThe Rasch model estimates the item and person fit, localisation of patients (levels of participation), as well as the localisation of items and thresholds (relative difficulty).30
The following criteria were used to determine the calibration, location of items and limits, unidimensionality, and invariance of the PM-Scale: 1 – Missing data: items with a missing answer rate ≥ 20% were considered irrelevant to the life of the patients. 2 – Item fit statistics: The individual fit of the item was examined by calculating mean square (MnSq) values and associated t values to determine the relation between levels of participation and difficulties encountered on each item of the scale. The suggested values for interpreting the MnSq are 1 ± 0.3 and an associated t = ± 2, which indicate the adequacy of the items.26 Higher MnSq values demonstrate that the score is highly variable or erratic. Thus, when individuals with lower participation have high scores on difficult items, this suggests either that the items have no connection or there is a difficulty in the definition of the item, requiring an adjustment.26 In contrast, low MnSq values (< 0.7) demonstrate little variability in the scoring of the item, indicating that the answers are predictable.27,28 The infit enables identifying response categories that have a probability of higher or lower scores, enabling the determination of whether an easier item obtains more correct answers than a more difficult item. The outfit is the inverse, but the items should have a certain type of answer, indicating the probability of a wrong answer for an item that should have a correct answer.31,32 3 – The Wright Map illustrates the level of difficulty of the items in relation to the level of ability of the sample, which, in this case, refers to participation. 4 – Differential item functioning (DIF): this measure was used to investigate the invariance of the scale in terms of three personal factors: sex (female vs. male), disability level (mRS score ≤ 2 [mild] vs. > 2 [moderate to severe]), and age (≤ 60 years [median] vs. > 60 years).18
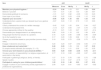
ResultsCharacteristics of participantsEighty-nine stroke survivors were recruited between June 2020 and June 2021, nine of whom were excluded due to aphasia and five presented cognitive decline. Thus, the sample was composed of 75 individuals. The average time required for the administration of the Brazilian version of the PM-Scale was 4′26’’. The demographic and clinical characteristics of the participants are displayed in Table 1.
Demographic and clinical characteristics of participants (n = 75).
Data expressed as absolute (relative frequency); mean ± standard deviation; median [25th and 75th percentiles]; CI,: confidence interval.
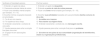
During the translation process (Steps I and II), there were no disagreements between the translators who performed the Brazilian Portuguese version of the PM-Scale (T1 and T2) or those who performed the back-translation (BT1 and BT2). In Step IV, the expert committee made some changes to achieve semantic and conceptual equivalence and facilitate the understanding of the items. Item 8 (“choose your activities based on your priorities”) and Item 21 (“engage in actions in your community”) required a more detailed description based on the concepts described in the domains of the Activity and Participation component of the ICF. Code d2301 (managing daily routine) was consulted for Item 8 and code d910 (community life) was consulted for Item 21. The description of the codes enabled specifying and facilitating the understanding of these items of the PM-Scale. Thus, Item 8 became “choosing your activities based on your priorities (common daily tasks)” and Item 21 became “engage in actions in your community (charity organisation or professional organisations)” (Table 2). At the end of the meeting, the specialists created the pre-final version of the scale.
Items altered to achieve semantic and conceptual equivalence.
* Changed items are in bold.
In Step V, the pre-final version of the Brazilian PM-Scale was tested on 40 participants. At the end of the test, all individuals answered the following question: “Did you have trouble understanding the meaning of any items on the scale?” The comprehension of the items was considered adequate for about 90% of the sample. However, 12.5% of the participants reported difficulties in understanding seven items, which were altered with synonyms by decision of the expert committee (Table 2). The ICF was consulted to exemplify the conception of two items: Item 20 – “Participate in gatherings (religious, family, or friends)”; and Item 22 – “Occupy a position of responsibility in a religious organisation, at work and/or in the family” (Table 2). The Brazilian version of the PM-Scale is available in Appendix 1.
ReliabilityAdequate reliability was found, with small differences in the means obtained during the intra-observer [ICC2,1 = 0.91 (95% CI: 0.83, 0.95); mean difference ± standard deviation (mean ± SD) = −0.21 ± 0.75)] and inter-observer [ICC2,1 = 0.81 (95% CI: 0.64, 0.89); mean ± SD= −0.70 ± 1.03)] assessments. The significance level for all data was p < 0.001.
Internal consistencyThe Brazilian version of the PM-Scale exhibited an excellent overall fit for items (mean ± SD = 0.01 ± 1.02) and adequate fit for persons (mean ± SD = 1.16 ± 0.88). These data reveal strong item separation (4.25) and item reliability (0.95). The person separation index (1.77) indicated an acceptable level of person separation and the person reliability index (0.76) indicated a good level of person reliability.
Item selectionNone of the 22 items on the PM-Scale had a missing answer rate ≥ 20%. Consequently, all 22 items were maintained in the Brazilian version of the scale.
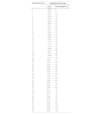
Description of the Brazilian version of the PM-ScaleTable 3 displays the estimated difficulty of each item, associated standard errors, and fit statistics. The items are ordered according to difficulty from the easiest (“Maintain your physical hygiene”: −2.24 logits) to the most difficult (“Engage in actions in your community”: 2.08 logits). The results of the Rasch analysis are displayed in Table 3, with the calibration, MnSq and t (infit and outfit) values for each item. One erratic item was found (“participate in caring for your children or grandchildren”), which had MnSq > 1.3 and t > 2. The outfit value was beyond the expected value on two items (“have a balanced and varied diet” and “maintain your physical hygiene”), with MnSq > 1.3 and t < 2. One item (“organise your accounts”) had MnSq > 1.3 and t < 2 for both the infit and outfit measures. Only one item (“choose your work based on your physical abilities”) had a predictable answer, with MnSq < 0.7. For the five items highlighted in the definitive version (Table 2), four were within the expected t values and were therefore not considered erratic. Only one item (4.5%) was found to have erratic behaviour, but was within the acceptable limit (5%) to confirm that the instrument measures a unidimensional concept.
Calibration of items on PM-Scale.
| Item | Infit | Outfit | |||||
|---|---|---|---|---|---|---|---|
| Measure | Error | MnSq | t | MnSq | t | ||
| Maintain your physical hygiene.⁎⁎ | −2.24 | 0.36 | 1.03 | 0.21 | 1.33 | 0.84 | |
| Believe in yourself. | −1.81 | 0.31 | 1.25 | 1.03 | 1.28 | 0.87 | |
| Demonstrate gratitude for someone. | −1.31 | 0.27 | 0.92 | −0.35 | 1.03 | 0.20 | |
| Have hope in your future. | −0.98 | 0.25 | 0.93 | −0.36 | 1.10 | 0.52 | |
| Organise your accounts.⁎⁎ | −0.96 | 0.25 | 1.35 | 1.83 | 1.33 | 1.41 | |
| Understand when a person bids you farewell (such as a gesture of good-bye). | −0.87 | 0.24 | 1.12 | 0.72 | 1.12 | 0.63 | |
| Clearly understand the context of a written message. | −0.40 | 0.22 | 1.00 | 0.04 | 0.94 | −0.27 | |
| Understand what people think. | − 0.13 | 0.21 | 0.84 | −1.07 | 0.78 | −1.40 | |
| Choose appropriate clothes for the weather. | −0.13 | 0.21 | 1.03 | 0.27 | 0.97 | −0.14 | |
| Demonstrate your disappointment in an adequate way. | 0.08 | 0.20 | 1.15 | 1.02 | 1.08 | 0.59 | |
| Help people find the final solution to a problem. | 0.16 | 0.20 | 0.90 | −0.68 | 0.86 | −0.95 | |
| Go to the hospital for care. | 0.17 | 0.20 | 1.09 | 0.66 | 1.13 | 0.85 | |
| Choose your activities based on your priorities (common daily tasks). | 0.19 | 0.20 | 0.70 | −2.28 | 0.70 | −2.16 | |
| Engage in decisions around you. | 0.20 | 0.20 | 0.87 | −0.92 | 0.84 | −1.11 | |
| Have a balanced and varied diet.⁎⁎ | 0.40 | 0.20 | 1.29 | 1.92 | 1.37 | 2.33 | |
| Do simple mental arithmetic (for example, 10 + 10). | 0.59 | 0.19 | 1.01 | 0.09 | 1.00 | 0.05 | |
| Choose your work based on your physical abilities.⁎⁎⁎ | 0.65 | 0.20 | 0.69 | −2.36 | 0.72 | −2.11 | |
| Occupy a position of responsibility in a religious organisation, at work and/or in the family. | 0.77 | 0.19 | 0.90 | −0.68 | 0.87 | −0.89 | |
| Participate in gatherings (religious, family, or friends). | 1.07 | 0.19 | 0.76 | −1.85 | 0.75 | −1.88 | |
| Speak in public. | 1.24 | 0.19 | 0.97 | −0.18 | 1.01 | 0.14 | |
| Participate in caring for your children/grandchildren.* | 1.25 | 0.19 | 1.40 | 2.53 | 1.37 | 2.33 | |
| Engage in actions in your community (charity organisation or professional organisations). | 2.08 | 0.20 | 0.91 | −0.63 | 0.87 | −0.82 | |
Fig. 1 displays the Wright Map illustrating the degree of difficulty of the items in relation to the level of ability of the sample, which, in this case, refers to participation. The items of the Brazilian version of the PM-Scale are displayed on the right, with the most difficult items at the top of the figure and the easiest items at the bottom. The numbered measurement scale on the left side of the graph is measured in logits and progresses from least participation (bottom) to most participation (top). The items are plotted on the linear (interval) logit scale, which ranges from −3 logits to 3 logits for this analysis. The Wright Map revealed adequate variation in the easy and difficult items, making the Brazilian version of the PM-Scale suitable for assessing different levels of post-stroke participation. Fig. 1 shows that the items are well distributed in terms of difficulty, but some participants had higher levels of participation that could not be assessed according to the difficulty of the items.

Differential item functioning (DIF) is used to investigate items (one by one) in search of signs of interactions with the characteristics of the sample. Fig. 2 displays the measures in logits relating invariance in the difficulty hierarchy of the items to sex (Fig. 2A), age (≤ 60 years, > 60 years; Fig. 2B), and disability (mRS ≤ 2, mRS > 2; Fig. 2C). No significant invariances were found related to the personal characteristics of the sample (p > 0.05). Fig. 2(C) displays invariances on the easiest items (Items 1, 3, 12, and 13) when comparing the DIF with regards to disability, but these invariances were non-significant.
Discussion (sex, age, and disability).")
This study translated and cross-culturally adapted the PM-Scale to Brazilian Portuguese, tested its preliminary reliability, and examined the validity of the scoring patterns of the items and answers. The analysis of the results demonstrated that the final translated version exhibited adequate semantic equivalence and reliability for use in the Brazilian population. The Rasch analysis revealed only one item with erratic behaviour, three items with MnSq > 1.3 and t < 2, and one item with MnSq < 0.7.
The sample was composed mainly of men in the chronic phase of stroke with an average age of 56 years. Similar data were described in the development study of the PM-Scale18 (predominance of men, average age of 59 years, and chronic phase of stoke). Regarding disability, 56% of the participants had marked disability, which is consistent with data reported in the study by Kossi et al.18 (69% of participants with moderate or marked disability).
In Steps I, II and III, no disagreement was found during the translation from English into Portuguese. In Step IV, the expert committee made some changes to achieve semantic and conceptual equivalence and facilitate the understanding of the meaning of the items. This was necessary due to the sociocultural characteristics of the Brazilian population of stroke survivors, as previous studies have identified a low level of schooling in this population.3,11-14,33 In Step V, 12.5% of the participants reported difficulties with regards to seven items, which were altered with synonyms to facilitate the understanding. As the level of uncertainty remained lower than 15%, it was not necessary to test the pre-final version a second time and it was possible to proceed to the analysis of the reliability of the final Brazilian version of the PM-Scale.34 The translated version of the PM-Scale exhibited excellent intra-observer and inter-observer reliability. Similar results were reported by Kossi et al.18 who found excellent reliability amongst stroke survivors in Africa.
The items on the Brazilian version of the PM-Scale exhibited an excellent overall fit and adequate fit for person separation. This shows that the sample was sufficient for revealing the hierarchy and spacing of the items in different samples with similar respondents, demonstrating adequate internal consistency and external validity of the data.29
Only one item (4.5%) was found to have erratic behaviour, which was within the acceptable limit (5%) to confirm that the instrument measures a unidimensional concept. Therefore, the PM-Scale indeed only assesses the participation construct. The item “participate in caring for your children or grandchildren” had erratic behaviour in the calibration, presenting a higher score than expected. This erratic pattern was likely related to the fact that not all participants had children or contributed to caring for grandchildren, leading to divergent answers amongst the participants independently of the level of participation. Only one item was considered predictable (“choosing your work based on your physical abilities”), with a score higher than expected. However, as more than half of the population had marked disability, one may expect these individuals to have difficulties with regards to physical abilities, which is a determinant in the choice of daily and occupational activities.
Values beyond the expected were found for two items (“have a balanced and varied diet” and “maintain your physical hygiene”), whereas the item “organise your accounts” had an altered score for both the infit and outfit measures. Although the MnSq values were altered, the t values remained lower than 2. The 17 remaining items had values within the expected limits, with a 77.2% proportion of variance, which is higher than the expected proportion (> 60%). This demonstrates the reliability of the validation of the scoring patterns of the items and answers of the individuals on the PM-Scale.
The Wright Map revealed that the scale had enough easy items to assess individuals with greater social restrictions and difficult items to assess those with higher levels of participation.26 These results are expected on a scale, as the items should be well distributed in terms of difficulty to enable analysing different degrees of ability (in this case, levels of participation). In Fig. 1, four difficult items were related to communication, domestic life & community, and social & civic life. The nine easiest items were related to communication, general tasks & demands, and major life areas (Table 3). Kossi et al.18 found that the most difficult item in the African population was related to community, social, and civic life (Item 22), whereas this item was considered neutral in the Brazilian population. As countries with different cultures and traditions, some situations of daily living may pose greater difficulty regarding access to participation. Regarding easy items, Kossi et al.18 found 12 related to communication and tasks and demands. The easiest item in the Brazilian population was related to personal care (Item 12). This item was also considered easy in the African population; the only difference was in the order.
The Brazilian version of the PM-Scale exhibited no variations with regards to sex, age, or disability level, demonstrating that the instrument can be used to assess social participation in the chronic phase of stroke regardless of one's sex, age, and degree of disability. However, the present study only provides preliminary results. Thus, further studies administering the Brazilian version of the PM-Scale to larger samples are needed to enable a more in-depth analysis of its measurement properties and further validation of the instrument.
ConclusionsThe Brazilian version of the PM-Scale exhibited adequate semantic, idiomatic, cultural and conceptual equivalence, as well as appropriate preliminary reliability and can be used to assess social participation in the chronic phase following a stroke regardless of one's sex, age, and degree of disability.
This study was conducted during a scholarship supported by the CAPES/PROSUP – Brazilian Federal Agency for Support and Evaluation of Graduate Education within the Ministry of Education of Brazil.
PM-Scale: Escala de Medição de Participação (Versão em português)
Instruções
O indivíduo deve responder a escala estimando o nível do seu envolvimento em situações da vida cotidiana, visando a estratégia e os meios utilizados para realizá-las.
No Brasil, a PM-Scale foi validada sob forma de entrevista guiada por um profissional. Durante a aplicação são apresentadas três opções de respostas para os indivíduos, que são convidados a apontar a participação percebida como “De Modo Nenhum”, “Pouco” ou “Muito”. Situações que não foram realizadas nos últimos três meses ou nunca foram executadas são marcadas como “Ausentes”, representada na escala como um ponto de interrogação.
Para cada item (situação), as repostas possíveis são:
- -
De modo nenhum (0): retrata que o indivíduo não participa, de nenhuma forma.
- -
Pouco (1): o indivíduo participa, mas com pouca frequência.
- -
Muito (2): o indivíduo participa ativamente, com a maior frequência possível.
- -
Ponto de interrogação: o indivíduo não consegue estimar o seu envolvimento porque nunca conheceu a situação, ou, não as vivenciou nos últimos três meses.
As instruções são fornecidas no início do teste. Durante a entrevista, o sujeito pode fazer perguntas se tiver dificuldade em responder algum item. Cada item é pontuado de 0 a 2. Portanto, a pontuação máxima obtida será de 44 pontos, com pontuações mais altas denotando maior participação. O escore bruto da escala deve ser convertido em logits (ver tabela disponível abaixo, no material suplementar). Quando houver resposta pontuadas com ponto de interrogação (?), o escore deverá ser calculado no seguinte site: http://rssandbox.iescagilly.be/pm-scale-online-analysis.html.
Escala de Medição de Participação (Versão em português)
das pontuações brutas da PM-Scale em medidas de intervalo em logit e em porcentagem.


