


The Jebsen–Taylor Test evaluates upper limb function by measuring timed performance on everyday activities. The test is used to assess and monitor the progression of patients with Parkinson disease, cerebral palsy, stroke and brain injury.
ObjectivesTo analyze the reliability, internal consistency and validity of the Jebsen–Taylor Test in people with Muscular Dystrophy and to describe and classify upper limb timed performance of people with Muscular Dystrophy.
MethodsFifty patients with Muscular Dystrophy were assessed. Non-dominant and dominant upper limb performances on the Jebsen–Taylor Test were filmed. Two raters evaluated timed performance for inter-rater reliability analysis. Test–retest reliability was investigated by using intraclass correlation coefficients. Internal consistency was assessed using the Cronbach alpha. Construct validity was conducted by comparing the Jebsen–Taylor Test with the Performance of Upper Limb.
ResultsThe internal consistency of Jebsen–Taylor Test was good (Cronbach's α=0.98). A very high inter-rater reliability (0.903–0.999), except for writing with an Intraclass correlation coefficient of 0.772–1.000. Strong correlations between the Jebsen–Taylor Test and the Performance of Upper Limb Module were found (rho=−0.712).
ConclusionThe Jebsen–Taylor Test is a reliable and valid measure of timed performance for people with Muscular Dystrophy.
New pharmacological and therapeutic interventions during the past three decades contributed to a longer survival of people with Muscular Dystrophy (MD).1,2 Therefore, the number of non-ambulatory people with upper limb dysfunction has increased, as has the demand for more accurate assessment protocols.2 The lack of instruments to quantify upper limb functional impairments is a challenge faced by health professionals who work with people with MD.3
Some tests evaluate upper limb motor function in MD or specifically in Duchenne Muscular Dystrophy (DMD), but none evaluate timed performance. The Brooke Scale classifies upper limb active movements in DMD and Becker muscular dystrophy (BMD) with a six-point scale.4 However, Brooke Scale did not quantify functional performance. Dimension 3 of the Motor Function Measure (MFM) has six items referring to upper limb function.5 However, in people with less severe MD, the Motor Function Measure might not detect early stage disabilities and might show scoring ceiling effects. ABILHAND questionnaire points to the subject's perception of difficulty performing activities of daily living involving upper limb functions.6 ABILHAND classifies the tasks as fully or partially performed, or not performed at all. Upper limb performance is inferred according to the subject's report and not specifically tested. The Performance of Upper Limb Test assesses shoulder, elbow and hand functions in DMD. Four items of this scale measure timed performance only as additional qualitative information, with no impact on the total score.7
Timed performance is an accurate functional measure in people with DMD.8,9 This evaluation strategy has been used in DMD for functional performance of the lower limbs, for example, the six-minute walk test,10 in the North Star Ambulatory Assessment11 and in the Functional Evaluation Scale for Duchenne Muscular Dystrophy.12 The Jebsen–Taylor Test evaluates upper limbs timed performance in seven subtests that represent everyday activities, such as writing, turning cards, picking up objects or beans with a spoon, stacking checkers, and picking up light or heavy cans. The subtests assess the distal and proximal upper limb performance. Materials are standardized and have low-cost. Assessment requires about 35min.13
The Jebsen–Taylor Test was translated and cross-culturally adapted into Brazilian Portuguese and showed excellent intra and inter-rater reliability in people with stroke, cerebral palsy and Parkinson disease.14–17 Scores are determined by timed performance on functional activities, which differentiates this test from others. The test has normative data for healthy people18 and was previously applied in boys with DMD and considered as a sensitive method to assess DMD progression. However, measurement properties were not tested and people with other types of MD were not evaluated.19
We hypothesized that Jebsen–Taylor Test would generate accurate measures20 of upper limb motor function in people with MD. First, we aimed to analyze the reliability, internal consistency and validity of Jebsen–Taylor Test in people with Muscular Dystrophy. Second, we aimed to describe and classify upper limb timed performance in people with MD.
MethodsExperimental designThis was an observational study using a cross-sectional design approved by the Universidade Federal de São Paulo (UNIFESP) Ethics Committee (process 132–193), São Paulo, SP, Brazil.
ParticipantsAll participants who submitted to clinical and therapeutic treatment by the Brazilian Association of Muscular Dystrophies (ABDIM) were invited to participate (80 people). They had their diagnosis of DMD, BMD, fascioscapulohumeral dystrophy (FSH), limb-girdle muscular dystrophy (LGMD) or Myotonic Dystrophy type 1 (MD1) confirmed by DNA analysis. Parents/legal guardians signed the consent form.
Two participants were excluded due to having associated neurological diseases, three were excluded due to participation refusal by participants/parents/legal guardians, three were excluded due to unavailability, eight were excluded due to severe cognitive impairment (i.e. scoring lower than 11 on the Mini-Mental State Examination).21–23 In a previous pilot study,22 we observed that a cut-point of 10 points (instead of eighteen) could be considered for DMD people. Fourteen participants were excluded due to the absence of upper limb function (i.e. severe cases, bed restricted). The minimum upper limb function required to participate in this study was the ability to grasp objects and not just the presence of an active muscle contraction in the hands and fingers without function. Therefore, participants who were not able to grasp objects were excluded.
The 50 participants included in this study were diagnosed with DMD (72%), LGMD (16%), BMD (6%), MD1 (4%) and FSH (2%). In the total sample, 18 (36%) were ambulatory and 32 (64%) were non-ambulatory. The sample size was calculated to achieve 80% power with alpha error of 5% and expected intraclass correlation coefficients (ICC) of 0.99714 using the ICC Sample Size Package. Thus, the sample size required for this study was 49 individuals.
Two raters participated in this study. Both were physical therapists who worked with patients with neuromuscular diseases. One of the raters had a master's degree and three years of clinical MD experience (Rater 1) and the other had a PhD degree and 15 years of MD clinical experience (Rater 2). One of the raters (Rater 1) had previously worked with the Jebsen–Taylor Test.
ProceduresParticipants were evaluated using the Mini-Mental State Examination,21 to screen for cognitive impairment. Then, hand dominance assessment24 and the Vignos Scale25 for strength and functional measurement were performed to classify the participants. The analysis of hand dominance was performed by asking and observing the preferred hand during the manipulation of everyday objects such as scissors, comb, toothbrush and pencil.24 The Vignos Scale indicated the clinical grading of people with neuromuscular diseases (from 1 to 10; 1 for subtle changes in posture or gait and 10 for bedridden patients).25 Based on Vignos Scale score, The sample was subdivided into ambulatory (Vignos score 1–6) and non-ambulatory (Vignos score 7–10) to describe timed performance.
The Jebsen–Taylor subtests were administered in the following sequence: 1: writing; 2: turning over cards; 3: picking up small common objects; 4: simulating feeding; 5: stacking checkers; 6: picking up large light objects. The sequence, instructions, tasks and materials followed the norms previously validated in Brazilian Portuguese.13,14 The Jebsen–Taylor Test was applied to people with MD in a previous pilot study.26 Based on those results, we improved the application protocol of the Test and set the inclusion/exclusion criteria of the present study.
Participants were assessed individually. They performed the subtests seated in their wheelchair or on a chair that allowed the correct positioning of the hips, knees and ankles, each flexed at approximately 90°. A table with an adjustable height was used to keep the participants elbows at approximately 90° flexion, considered to be the most comfortable position for the subject during the test. Each subtest was performed using the non-dominant upper limb, and then with the dominant upper limb.13 Time was measured with a mechanical stopwatch as commonly used in clinical practice. All trials were filmed from the left and right sides using a digital camera on a tripod located approximately two meters from the subject. The researcher asked participants to perform the Jebsen–Taylor Test in a comfortable time to simulate the real condition of the task.27
The two raters read the Brazilian Portuguese instructions for the Jebsen–Taylor Test. They then watched films of the patients performing the subtests and discussed the scoring of the Jebsen–Taylor Test for 8h.28 The raters were blinded about participants data and they had no access to participants’ charts. The raters collected data separately, during the same similar time period (i.e. in the same week). They watched the videos on different computers in different laboratories, but using similar equipment.29 Each rater analyzed 12 films corresponding to the non-dominant and dominant attempts by the participants of each six subtests of the Jebsen–Taylor Test. Fifteen days after the first assessment, the participants were reevaluated by Rater 2.
The validation process was conducted by comparing the Jebsen–Taylor Test with the test used to assess upper limb function in DMD: the Performance of Upper Limb Module.7 Participants were evaluated with Performance of Upper Limb Module in one session. The same positioning adopted to the Jebsen–Taylor Test was used, but only the dominant upper limb was tested (in accordance with Performance of Upper Limb Module testing procedures).
Statistical analysisThe hypothesis of normal distribution was tested using the Shapiro–Wilk test. Descriptive data analysis was performed to characterize the sample. Tests were run on the R Program (Windows version 3.3.2). The level of significance of 5% was adopted.30
Inter-rater reliability analysis included two evaluations of each film by Raters 1 and 2. The analysis was run using ICC for two-way models and their respective 95% confidence intervals. Very low reliability was considered if the ICC was below 0.25, low reliability if between 0.26 and 0.49, moderate if between 0.50 and 0.69, high if between 0.70 and 0.89 and very high reliability when ICC was higher than 0.90. Mann–Whitney tests evaluated the differences between the medians of timed performances measured by the two Raters and compared the timed performances of ambulatory and non-ambulatory participants.
The internal consistency of the total score of the Jebsen–Taylor Test was evaluated using Cronbach's alpha. The classification of the timed performance using the Vignos scores of ambulatory and non-ambulatory participants was shown in percentiles. We classified the timed performance as very good (below 20%), good (20–40%), moderate (40–60%), bad (60–80%) and very bad (above 80%). The sample was subdivided in DMD and other types of MD (FSH, MD1, BMD and LGMD).
To test the validity of the Jebsen–Taylor Test, Spearman correlation coefficients verified the relationships between the subtests and the domains of the Performance of Upper Limb Module.
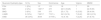
ResultsSample characteristics are displayed in Table 1.
Sample characteristics: mean and standard deviation of Muscular Dystrophy type, sex, upper limb dominance, age, Vignos Scale score and Mini-Mental State Examination score of 50 subjects with 5 Types of Muscular Dystrophy.
| Muscular Dystrophy type | N (%) | Sex | Dominance | Age | Vignos | MMSE |
|---|---|---|---|---|---|---|
| FSH | 1 (2%) | 1 F | 1 R | 19 | 7 | 29 |
| MD1 | 2 (4%) | 1 M/1 F | 2 R | 22.5 (16.26) | 1 | 22 (5.65) |
| BMD | 3 (6%) | 3 M | 3 R | 25 (1.73) | 6 (3.05) | 28 (4.04) |
| LGMD | 8 (16%) | 7 M/1 F | 7 R/1 L | 24.5 (9.16) | 7 (2.42) | 28.5 (0.74) |
| DMD | 36 (72%) | 36 M | 31 R/5 L | 13 (4.18) | 7 (2.25) | 27 (6.73) |
FSH, Facioscapulohumeral Muscular Dystrophy; MD1, Myotonic Dystrophy type 1; BMD, Becker muscular dystrophy; LGMD, limb-girdle muscular dystrophy; DMD, Duchenne Muscular Dystrophy; N, number; M, male; F, female; R, right; L, left; Vignos, Vignos Scale score; MMSE, Mini-Mental State Examination score.
Participants with severe upper limb disability (scored as 7–8 on the Vignos Scale) showed difficulty during subtests 3 and 4, which required inserting objects or beans into the can. In these cases, subtests 3 and 4 were considered complete when six small objects or five beans were placed on the table, near the can.
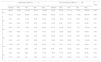
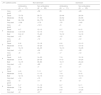
Measurement properties analysisThe internal consistency of the total score of the Jebsen–Taylor Test was good (Cronbach's alpha=0.98). To calculate reliability, each Rater analyzed 12 films correspondent to the non-dominant and dominant limb attempts of each of the six subtests of the Jebsen–Taylor Test. ICC values, 95% of confidence interval and standard error of the means of inter-rater reliability are displayed in Table 2. Subtests showed very high inter-rater reliability of subtests performed with both non-dominant and dominant limbs, except for the non-dominant upper limb attempt on subtest 1, which showed high inter-rater reliability (Table 2). Therefore, High agreement was observed between the evaluations of Raters 1 and 2. The correlations between shoulder, elbow and wrist domains of the Performance of Upper Limb Module and the Jebsen–Taylor subtests (i.e. validation analysis) are demonstrated in Table 3.
Jebsen–Taylor Test subtests 1–6. Means and 95% confidence intervals (95% CI), means standard errors (SE) and intraclass correlation coefficients (ICC) of inter-rater reliability analysis for 50 subjects with 5 types of Muscular Dystrophy.
| CV | Rater 1 (N=50) | Rater 2 (N=50) | p-value | ICC | 95% CI | SEM | CV Rater 1 | CV Rater 2 | |||
|---|---|---|---|---|---|---|---|---|---|---|---|
| 1 ND | 0.67 | 92.13 | (8.80) | 86.87 | (7.88) | 0.66 | 0.772 | [0.632, 0.864] | 4.20 | 0.68 | 0.64 |
| 1 D | 1.09 | 63.53 | (9.85) | 63.48 | (9.86) | 0.98 | 1.000 | [1.000, 1.000] | 0.00 | 1.10 | 1.10 |
| 2 ND | 0.59 | 13.24 | (9.11) | 13.23 | (1.10) | 100 | 0.998 | [0.997, 0.999] | 0.41 | 0.59 | 0.59 |
| 2 D | 0.66 | 11.87 | (1.06) | 12.04 | (1.07) | 0.91 | 0.997 | [0.994, 0.998] | 0.06 | 0.63 | 0.63 |
| 3 ND | 1.18 | 23.71 | (3.96) | 24.35 | (4.40) | 0.91 | 0.983 | [0.971, 0.991] | 0.52 | 1.18 | 1.28 |
| 3 D | 1.01 | 18.91 | (2.71) | 17.92 | (2.31) | 0.78 | 0.903 | [0.836, 0.944] | 0.84 | 1.01 | 0.91 |
| 4 ND | 1.42 | 41.3 | (8.30) | 42.35 | (8.45) | 0.93 | 0.999 | [0.998, 0.999] | 0.26 | 1.42 | 1.41 |
| 4 D | 1.37 | 30.77 | (5.98) | 31.15 | (6.08) | 0.96 | 0.999 | [0.998, 0.999] | 0.19 | 1.37 | 1.38 |
| 5 ND | 0.91 | 12.58 | (1.63) | 12.88 | (1.63) | 0.90 | 0.997 | [0.995, 0.998] | 0.09 | 0.91 | 0.90 |
| 5 D | 0.84 | 9.24 | (1.10) | 9.37 | (1.09) | 0.93 | 0.992 | [0.986, 0.995] | 0.10 | 0.84 | 0.83 |
| 6 ND | 1.02 | 18.77 | (2.71) | 19.02 | (2.74) | 0.92 | 0.999 | [0.999, 1.000] | 0.09 | 1.02 | 1.02 |
| 6 D | 0.95 | 13.75 | (1.85) | 14.03 | (1.93) | 0.92 | 0.995 | [0.992, 0.997] | 0.13 | 0.95 | 0.98 |
p-value ≤0.05; ICC, intraclass correlation coefficient (ICC); 95% CI, 95% confidence interval; SEM, standard error of measurement; CV, coefficient of variation (standard deviation/mean); ND, non-dominant upper limb; D, dominant upper limb.
Spearman correlation coefficients between the Performance of Upper Limb (PUL) Module domains (i.e. shoulder, elbow and wrist) and the Jebsen–Taylor Test subtests (JTT) (1–6) for 50 subjects with 5 types of Muscular Dystrophy.
| PUL Shoulder | PUL Elbow | PUL Wrist | PUL Total | |
|---|---|---|---|---|
| JTT 1 Writing | −0.143 | −0.156 | −0.190* | −0.129 |
| JTT 2 Turning over cards | −0.644** | −0.677** | −0.717** | −0.751*** |
| JTT 3 Picking up small objects | −0.685** | −0.686** | −0.821*** | −0.816*** |
| JTT 4 Simulating feeding | −0.666** | −0.725*** | −0.755*** | −0.780*** |
| JTT 5 Stacking checkers | −0.700** | −0.670** | −0.760*** | −0.791*** |
| JTT 6 Picking up large objects | −0.736** | −0.746** | −0.867*** | −0.854*** |
| JTT Total | −0.587* | −0.642* | −0.722** | −0.712** |
PUL, Performance of Upper Limb; JTT, Jebsen–Taylor Test.
Timed performance of ambulatory and non-ambulatory participants with DMD (n=36) and other MD types (FSH, MD1, BMD and LGMD; n=14) is described in Table 4.
Descriptive statistics of the Jebsen–Taylor Test for 50 ambulatory and non-ambulatory participants with Duchenne Muscular Dystrophy (DMD) and 4 other Muscular Dystrophy types (MD).a
| Ambulatory DMD (N=11) | Non-ambulatory DMD (N=25) | p-value | |||||||||
|---|---|---|---|---|---|---|---|---|---|---|---|
| Median | P25 | P75 | Min | Max | Median | P25 | P75 | Min | Max | ||
| 1 ND | 86.45 | 74.65 | 100.25 | 28.13 | 145.80 | 74.23 | 65.00 | 101.10 | 47.81 | 296.60 | 0.69 |
| 1 D | 52.23 | 34.32 | 66.86 | 21.56 | 193.50 | 40.20 | 31.43 | 69.30 | 15.60 | 295.40 | 0.88 |
| 2 ND | 9.46 | 5.32 | 12.33 | 3.28 | 35.20 | 14.28 | 12.68 | 19.30 | 5.85 | 30.20 | 0.00 |
| 2 D | 9.09 | 5.94 | 11.79 | 3.19 | 14.40 | 14.09 | 9.46 | 15.60 | 5.41 | 43.30 | 0.01 |
| 3 ND | 8.53 | 6.79 | 12.52 | 5.63 | 30.20 | 22.16 | 13.28 | 28.50 | 7.53 | 122.60 | 0.00 |
| 3 D | 9.38 | 6.38 | 11.73 | 5.06 | 15.70 | 14.22 | 12.26 | 32.80 | 8.45 | 94.30 | 0.00 |
| 4 ND | 10.19 | 6.52 | 14.39 | 5.06 | 19.60 | 26.78 | 16.34 | 73.50 | 9.46 | 234.60 | 0.00 |
| 4 D | 9.54 | 8.12 | 11.27 | 6.29 | 16.10 | 18.54 | 12.09 | 35.50 | 7.46 | 133.60 | 0.00 |
| 5 ND | 10.00 | 6.81 | 13.3 | 2.25 | 23.30 | 11.05 | 9.23 | 14.00 | 2.69 | 40.20 | 0.37 |
| 5 D | 7.84 | 5.42 | 9.92 | 1.87 | 12.60 | 9.46 | 8.75 | 12.20 | 3.75 | 34.40 | 0.13 |
| 6 ND | 7.38 | 5.22 | 8.82 | 4.22 | 13.30 | 18.00 | 11.37 | 35.90 | 5.59 | 69.90 | 0.00 |
| 6 D | 7.28 | 6.22 | 8.41 | 3.28 | 12.40 | 12.47 | 9.35 | 22.60 | 5.39 | 37.30 | 0.00 |
| Ambulatory MD (N=7) | Non-ambulatory MD (N=7) | p-value | |||||||||
|---|---|---|---|---|---|---|---|---|---|---|---|
| Median | P25 | P75 | Min | Max | Median | P25 | P75 | Min | Max | ||
| 1 ND | 48.47 | 36.78 | 53.34 | 24.09 | 131.69 | 58.09 | 46.66 | 65.9 | 36.97 | 140.9 | 0.23 |
| 1 D | 21.45 | 19.46 | 22.21 | 13.60 | 89.99 | 22.75 | 19.35 | 32.3 | 12.72 | 49.6 | 0.56 |
| 2 ND | 6.21 | 5.12 | 7.01 | 3.41 | 9.03 | 8.15 | 7.41 | 23.6 | 5.94 | 31.4 | 0.04 |
| 2 D | 5.67 | 4.62 | 6.00 | 4.31 | 6.31 | 8.78 | 6.80 | 17.2 | 5.38 | 23.3 | 0.01 |
| 3 ND | 7.16 | 6.64 | 8.87 | 6.44 | 14.78 | 14.47 | 10.61 | 61.7 | 7.90 | 126.7 | 0.04 |
| 3 D | 6.61 | 6.15 | 8.23 | 5.62 | 11.68 | 13.63 | 9.59 | 39.4 | 7.40 | 78.6 | 0.01 |
| 4 ND | 10.72 | 10.07 | 17.72 | 9.31 | 28.81 | 18.75 | 13.35 | 89.4 | 10.37 | 281.5 | 0.11 |
| 4 D | 9.59 | 7.87 | 14.64 | 7.25 | 24.22 | 18.44 | 13.41 | 81.7 | 8.47 | 214.0 | 0.11 |
| 5 ND | 3.16 | 2.94 | 3.78 | 1.92 | 5.85 | 6.10 | 3.90 | 36.6 | 2.44 | 57.7 | 0.14 |
| 5 D | 2.40 | 1.99 | 2.78 | 1.29 | 4.59 | 5.94 | 4.62 | 10.8 | 2.03 | 45.9 | 0.02 |
| 6 ND | 5.28 | 4.86 | 5.45 | 4.53 | 10.03 | 11.06 | 8.12 | 53.2 | 5.12 | 86.8 | 0.01 |
| 6 D | 4.56 | 4.35 | 5.62 | 4.14 | 12.69 | 12.14 | 7.72 | 25.6 | 5.38 | 83.3 | 0.01 |
P25, 25th percentile; P75, 75th percentile; min, minimum; max, maximum; ND, non-dominant upper limb; D, dominant upper limb.
The median time to the non-dominant and dominant limb performances on each subtest are shown. A significant difference was found between ambulatory (n=11) and non-ambulatory (n=25) DMD participants: non-ambulatory participants showed longer times on non-dominant and dominant upper limb performances on subtests 2–4 and 6 (Table 4).
A significant difference was found between ambulatory (n=7) and non-ambulatory (n=7) participants with other MD types: non-ambulatory participants showed longer times on non-dominant and dominant upper limbs performances on subtests 2, 3, and 6. They also differed in dominant upper limb performance of subtest 5: a higher median was observed in non-ambulatory participants (Table 4).
Ambulatory (n=36) and non-ambulatory (n=11) participants with DMD had their timed performance classified as very good, good, moderate, bad or very bad. Non-dominant and dominant upper limb performances on each subtest are displayed in Table 5.
Classification of the non-dominant and dominant upper limb timed performance on the Jebsen–Taylor Test (JTT) of 36 ambulatory and non-ambulatory participants with Duchenne Muscular Dystrophy.
| JTT subtest scores | Non-dominant | Dominant | |||
|---|---|---|---|---|---|
| Ambulatory (N=11) | Non-ambulatory (N=25) | Ambulatory (N=11) | Non-ambulatory (N=25) | ||
| 1 | Very good | <73 | <58 | 29 | <28 |
| Good | 73–76 | 58–71 | 29–44 | 28–34 | |
| Moderate | 76–92 | 71–90 | 44–52 | 34–65 | |
| Bad | 92–106 | 90–170 | 52–70 | 65–143 | |
| Very bad | >106 | >170 | >70 | >143 | |
| 2 | Very good | <4 | <12.3 | <5 | <9 |
| Good | 4–7 | 12–13 | 5–7 | 9–13 | |
| Moderate | 7.31–9.6 | 13–15 | 7–10 | 13–14 | |
| Bad | 9.6–12 | 15–20 | 10–12 | 14–16 | |
| Very bad | >12 | >20 | >12 | >16 | |
| 3 | Very good | <6 | <12 | <6 | <12 |
| Good | 6–8 | 12–18 | 6–8 | 12–13 | |
| Moderate | 8–10 | 18–24 | 8–10 | 13–16 | |
| Bad | 10–13 | 24–35 | 10–13 | 16–35 | |
| Very bad | >13 | >35 | >13 | >35 | |
| 4 | Very good | <6 | <14 | <7 | <12 |
| Good | 6–9 | 14–20 | 7–9 | 12–16 | |
| Moderate | 9–14 | 20–39 | 9–10 | 16–24 | |
| Bad | 14–15 | 39–80 | 10–11 | 24–43 | |
| Very bad | >15 | >80 | >11 | >43 | |
| 5 | Very good | <4 | <7 | <5 | <7 |
| Good | 4–9 | 7–11 | 5–7 | 7–9 | |
| Moderate | 9–12 | 11–13 | 7–9 | 9–10 | |
| Bad | 12–14 | 13–15 | 9–10 | 10–13 | |
| Very bad | >14 | >15 | >10 | >13 | |
| 6 | Very good | <5 | <11 | <6 | <9 |
| Good | 5–7 | 11–16 | 6–7 | 9–11 | |
| Moderate | 7–8 | 16–20 | 7–8 | 11–14 | |
| Bad | 8–9 | 20–37 | 8–9 | 14–25 | |
| Very bad | >9 | >37 | >9 | >25 | |
The present study described upper limb timed performance and analyzed the reliability, internal consistency and validity of the Jebsen–Taylor Test in people with Muscular Dystrophy. The good measurement properties found indicated that timed performance could be used to measure the progression of muscle weakness14 and upper limb motor function in participants with MD. The Jebsen–Taylor Test was previously applied in people with DMD by Hiller and Wade,19 who identified that short times were indicators of upper limb muscles preservation, internal consistency, reliability and validity. The times on the Jebsen–Taylor Test were correlated to the Performance of Upper Limb Module scores. Considering that the Performance of Upper Limb Module is the standard assessment for upper limb function, the Jebsen–Taylor Test could be considered valid for measuring timed performance. A previous pilot study also found a strong correlation between the Jebsen–Taylor Test and Performance of Upper Limb Module.31
The Jebsen–Taylor Test showed high ICC values, which reflected high agreement between raters. For ICC calculation, the variation between participants was divided by the total variation, which included the variation between participants and the not intended variation (i.e. “error”). As the study design involved the evaluation of time by means of filming, the authors believe the error was lower. The coefficients of variation varied from 0.59 to 1.42. Many high values were found to be due to the variation of the performance of each participant and not due to the variation of the instrument or rater. Even though the participants showed high variability in the tests, the raters had high agreement and the test showed good internal consistency.
Participants could perform all subtests of the Jebsen–Taylor Test and did not demonstrate any pain or discomfort during the procedures. Subtest 1 (i.e. writing) was previously considered unsuitable for people with DMD, because it might be influenced by cognitive and/or learning difficulties, often associated with MD, mainly DMD.19 The present study showed that this activity could be used with people with DMD (and other types of MD), as long as the subjects could read and write. The assessment of writing, which has motor and cognitive demands, is important for better understanding of upper limb function. Subtests 3 and 4 required adaptations for people with severe upper limb disability (i.e. scored as 7–8 on the Vignos Scale). They were asked to place the six small objects or the five beans on the table, near the can, instead of inserting objects or beans into the can.
All DMD participants and non-ambulatory MD participants showed increased times to perform subtests of the Jebsen–Taylor Test in comparison with the normative data.18 However, ambulatory MD participants exhibited similar times when performing the non-dominant and the dominant attempts of subtests 2, 3, 5 and 6 compared to controls. DMD non-ambulatory participants showed higher times in turning over cards, picking up small objects, simulating feeding, and picking up large light objects. For the other MD type groups, non-ambulatory participants showed longer times in turning over cards, picking up small objects, stacking checkers, and picking up large light objects. Therefore, these tasks were more sensitive in detecting differences in upper limb performance, as they showed increased times even in less severe participants. Very few biomarkers involving upper limb functions are currently available for decision making in research and clinical practice. The description of timed performance and the establishment of performance categories could help clinicians develop clinical treatment strategies. Quantitative information involving motor function is useful for monitoring MD progression.
Subtests instructions did not determine specific upper limb movements or positions, just the task aims. Compensatory movements were observed, because muscle weakness impairs upper limb performance and restricts movements, which elicits the selection of new motor strategies.32,33 Compensatory movements increase as motor function decreases with MD progression.33,34 However, a high number of compensatory movements could result in variability in performance, not only in people with DMD, but also with other types of MD. Our sample showed high standard deviations in all subtests, which exemplified such variability. Besides, subtests involved gripping and holding and required proximal stability. Functional motor loss in MD usually occurs from proximal to distal and the lack of proximal stability might impair upper limbs timed performance.9 Future studies should evaluate whether some proximal upper limb assistance would help performance on the Jebsen–Taylor Test in people with MD.
The present study has some limitations. It was not possible to compare timed performance between people with MD and healthy participants due to the absence of a control group. However, the normative data for the Jebsen–Taylor Test was available in the literature18 for such comparisons and analyses. Another important point is that the Jebsen–Taylor Test should not be used to evaluate people with severe upper limb impairment (e.g. Vignos score of 9) because of ceiling effects. Participants scored as 9 by Vignos would have much difficulty performing the tasks and show very long times, which could be improper in clinical practice. Additionally, people with severe upper limb disability might need adaptations to enable them to pick up small common objects and to simulate feeding testing. Finally, the lack of compensatory movement assessment must be mentioned. The description of compensatory movements could contribute to a better understanding of functional independence. Many people with MD employ compensatory movements to perform tasks that become difficult as muscle weakness progresses.10,33
ConclusionsThe Jebsen–Taylor Test is a reliable and valid method for evaluating upper limb performance in people with MD (DMD, LGMD, BMD, MD and FSH). The description and classification of timed performance provides normative data for clinical practice and research. Timed performance is a reliable measure for upper limb function in this population.
Conflicts of interestThe authors declare no conflicts of interest


