

There are very few observational methods for analysis of biomechanical exposure available in Brazilian-Portuguese.
ObjectiveThis study aimed to cross-culturally adapt and test the measurement properties of the Rapid Upper Limb Assessment (RULA) and Strain Index (SI).
MethodsThe cross-cultural adaptation and measurement properties test were established according to Beaton et al. and COSMIN guidelines, respectively. Several tasks that required static posture and/or repetitive motion of upper limbs were evaluated (n>100).
ResultsThe intra-raters’ reliability for the RULA ranged from poor to almost perfect (k: 0.00–0.93), and SI from poor to excellent (ICC2.1: 0.05–0.99). The inter-raters’ reliability was very poor for RULA (k: −0.12 to 0.13) and ranged from very poor to moderate for SI (ICC2.1: 0.00–0.53). The agreement was good for RULA (75–100% intra-raters, and 42.24–100% inter-raters) and to SI (EPM: −1.03% to 1.97%; intra-raters, and −0.17% to 1.51% inter-raters). The internal consistency was appropriate for RULA (α=0.88), and low for SI (α=0.65). Moderate construct validity were observed between RULA and SI, in wrist/hand-wrist posture (rho: 0.61) and strength/intensity of exertion (rho: 0.39).
ConclusionThe adapted versions of the RULA and SI presented semantic and cultural equivalence for the Brazilian Portuguese. The RULA and SI had reliability estimates ranged from very poor to almost perfect. The internal consistency for RULA was better than the SI. The correlation between methods was moderate only of muscle request/movement repetition. Previous training is mandatory to use of observations methods for biomechanical exposure assessment, although it does not guarantee good reproducibility of these measures.
The International Labor Office (ILO)1 estimates that there are 160 million new cases of work-related diseases per year. Musculoskeletal diseases affect 4% of world population.1 Almost of 15% of this cases are from exposure at work,2 in particular the biomechanical factors.3 This condition can generate productivity reduction, absenteeism and early retirement.4
The assessment of biomechanical exposure at workplace allows to propose interventions in order to reduce the physical demands.5,6 To this propose, the use of appropriate methods to identify the exposure to biomechanical risk factors is essential.7–9 In this sense, the observational methods are of great relevance, mainly because they are widely used for risk analysis in the workplace.7–10 There are several observational methods8 for the biomechanical exposure assessment, which may be classified as methods of analysis of general workload or focused on upper limbs and manual material handling analysis.8 Among the observational methods available for upper limbs evaluation, the most used in worldwide is the Rapid Upper Limb Assessment (RULA) and the Strain Index (SI).8,11 However, these methods were developed in English language, requiring cross-cultural adaptation for Brazilian-Portuguese,12 as well as test of their measurement properties.10–13 There are only two observational methods for biomechanical risk assessment adapted to Portuguese-Brazilian, the Quick Exposure Check (QEC)14,15 and the Rapid Entire Body Assessment (REBA),16 and the Roteiro para Avaliação de Riscos Musculoesqueléticos (RARME).17 However, these methods assess biomechanical exposure in general, which differs from the RULA and SI that assess, in particular, for the upper limbs. Therefore, this study aimed to cross-culturally adapt the RULA and SI methods for Brazilian Portuguese version and test its measurement properties.
MethodsThe study was approved by the Research Ethics Committee from the Universidade Cidade de São Paulo (UNICID), São Paulo, Brazil, approval number: 734,515.
Rapid Upper Limb Assessment (RULA)RULA uses diagrams of posture for classification the biomechanical exposure.18 The postures are evaluated in two groups, upper limbs (group A) and neck, trunk and legs (group B). Each group has partial scores range from 0 to 6 points. Then, for each group (A and B) the muscle use and strength/load are scored, which is added to the partial scores. Finally, it is obtained a total score from groups A and B, their values crossed in Table C (Appendix 1) to obtain the final score (from 1 to 7 points). The level of exposure and investigation priorities are classified as acceptable posture if not maintained or repeated for long periods (1 or 2 points); more investigations are needed and changes may be required (3 or 4 points); investigation and changes are required soon (5 or 6 points); investigation and changes are required immediately (7 points).13
RULA uses diagrams of posture for classification the biomechanical exposure.18 The postures are evaluated in two groups, upper limbs (group A) and neck, trunk and legs (group B). Each group has partial scores range from 0 to 6 points. Then, for each group (A and B) the muscle use and strength/load are scored, which is added to the partial scores. Finally, it is obtained a total score from groups A and B, their values crossed in Table C (Appendix 1) to obtain the final score (from 1 to 7 points). The level of exposure and investigation priorities are classified as acceptable posture if not maintained or repeated for long periods (1 or 2 points); more investigations are needed and changes may be required (3 or 4 points); investigation and changes are required soon (5 or 6 points); investigation and changes are required immediately (7 points).13
Strain Index (SI)SI evaluates six exposure variables: intensity of exertion, duration of exertion, exertion per minute, hand/wrist posture, speed of work, and the duration of the task per day.8,9,19 Each of these variables has five classification criteria, with different weights (multiplier factors).19 This score is used to sort the task into three categories: probably safe tasks (<3); tasks associated with risk for the disorder in distal extremities from the upper limb (>5) and task that is probably dangerous (≥7)19 (Appendix 2).
SI evaluates six exposure variables: intensity of exertion, duration of exertion, exertion per minute, hand/wrist posture, speed of work, and the duration of the task per day.8,9,19 Each of these variables has five classification criteria, with different weights (multiplier factors).19 This score is used to sort the task into three categories: probably safe tasks (<3); tasks associated with risk for the disorder in distal extremities from the upper limb (>5) and task that is probably dangerous (≥7)19 (Appendix 2).
Cross-cultural adaptationThe creators of the methods allowed the adaptation to Portuguese-Brazilian and Professor Alan Hedge from Cornell University authorized the use of the RULA protocol graph. The process of cross-cultural adaptation was carried out based on the guidelines of Beaton et al.,20 which consisted of translation, synthesis of translation, back-translation, revision by a committee of experts, pre-test, and the presentation of documentation for analysis by the Experts Committee.20
Pre-test of the pre-final versionTwo hundred ninety five physical therapists with knowledge, training or job in the area of occupational health and ergonomics were invited via email to perform the pre-test of the pre-final version of the RULA and SI methods through the analysis of 3 video-tasks along with instructions for applying. On the first attempt, the majority of physical therapists did not respond to a request via e-mail, some of whom refused to attend, justifying lack of time. The respondents (n=23; 8%) reported difficulty in using the methods (RULA: 24.7%; SI: 21.7%), due to incomprehension at the data crossing in tables A, B and C from RULA, calculations from steps 2 and 3 from SI.
All the difficulties reported were forwarded to the experts committee and the pre-final versions were revised.21 The second pre-test was performed after a theoretical and practical training in groups of the 20–30 participants using video-tasks with duration of 1 hour already with additional instructions included for each method reviewed by experts committee. In a period of 5–7 days after the training the physical therapists received the new pre-final version of the two observational methods (RULA and SI) and 3 video-tasks to analyze. The new RULA and SI versions were applied in a new sample of 156 (RULA) and 107 (SI) physical therapists from both gender, with an average age of 31.2±7.2 years (ranging from 24 to 45 years).
Clinimetric properties testingTwo experienced raters (physical therapists three and five years using of biomechanical exposure assessment in the workplace) analyzed independently one hundred and sixteen video-tasks in a randomized order. The raters received training together, which consisted of explanation of the methods and theoretical/practical application of 80minutes in video-tasks that did not take part of this analysis. After training the raters received 116 video-tasks to analysis (test) and reanalysis (retest) in separate. Playback of the videos could be done as often as needed and they could use a stopwatch and calculator.
The tasks assessed were performed in the textile industry, electronics industry, assembling line, tinsmith and sawmills, self-employed workers (hairdresser, dentist, beautician, woodworker, butcher, bricklayer, cook and upholster). The inclusion criteria were tasks which workers were exposed to biomechanical requirement in upper limbs, who remained in static posture and/or repetitive movements from 4 to 6h a working day. In addition, the repetition movements of the upper limb should last for more than 50% of the time of the work cycle.22
The measurement properties tested for RULA and for SI, were reliability, test and retest (inter and intra-rater), tests of agreement, internal consistency (rater 1, test data), construct validity and interpretability of methods. The measurement properties were based in studies by Terwee et al.10,12 and Mokkink et al.13,23 (COSMIN – Consensus-based Standards for the selection of health Measurement Instruments).
The retest was performed with an interval of 7 days. The video-tasks were analyzed in a random order.10,13,23 The construct validity between RULA and SI was tested using data from the retest (rater I) for the total scores of the two methods, besides the partial scores regarding the wrist/hand-wrist posture, muscle required/repetition of the movement and strength/intensity of exertion.
The hypothesis tested for the adapted versions were: (1) the measurement properties of the methods would be acceptable; (2) both methods would identify tasks with higher risk and that there was a positive correlation from moderate to substantial among them.
Data analysisThe data were analyzed using the Statistical Package for Social Sciences – IBM® (SPSS, version 19.0). The statistical tests used can be seen in Table 1.
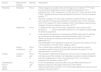
Test of measurement properties of the methods RULA and STRAIN INDEX criteria of analysis and interpretation of the results.
| Domain | Measurement property | Methods | Interpretation |
|---|---|---|---|
| Reliability | Reliability | RULA | Ordinal categorical variables: We use the Kappa Cohen method,10,13,23 where the results were interpreted as follows: reliability almost perfect (>0.81); substantial (0.61–0.80); moderate (0.41–0.60); poor (0.21–0.40); very poor (0.00–0.20)41. Reliability must be at least substantial and above 0.70 to be considered positive.10,23 |
| SI | Numerical variables: The Intra class Correlation Coefficient (ICC2.1) (type 2.1) was used with the following interpretations of reliability: poor (<0.40); moderate (0.40–0.75); strong (0.75–0.90); excellent (>0.90). The reliability must be at least moderate. Positive consistence occur when >0.70.23 | ||
| Agreement | RULA | To determine thee intra and inter-raters’ agreement, it was used the cross tabulation 2×2 that is expressed in percent (%). The greater the percentage the better the agreement. | |
| SI | It was used the standard error of measurement (SEM), whose result is obtained by calculating the ratio between the standard deviation (SD) of the mean differences (the test and retest) and the square root of 2 (SD of the differences/√2).13 The interpretation of the agreement is given as: very good (<5%); good (>5% and =10%); doubtful (>10% and =20%); negative (>20%). | ||
| Internal consistency | RULA and SI | The Cronbach alpha coefficient (α) was used, and considers the internal consistency: positive. Around 0.70 and 0.95; low when it is below 0.70; and redundant when it is above 0.95.10 | |
| Validity | Construct validity | RULA and SI | The correlation coefficient and Spearman (rho) was used to compare the partial and total scores of the methods. It is interpreted as a weak correlation between 0 and 0.30; moderate from 0.30 to 0.70 and strong 0.70 to 1.0. To confirm hypothesis the correlation at least 75%.10 |
| Interpretability (floor or ceiling effects) | RULA and SI | For the interpretability, it was found the ceiling and effect observed by the frequency response in the stage of total score of the method. Effect is present when more than 15% of the sample obtained the maximum score (ceiling) or minimum (floor).10 |
In the stage of SI adaptation, we identified an error in the formula that was corrected. In addition, the calculation formula has been revised. The terms “exertion” and “efforts” used in SI were referred in Portuguese to “esforço”.
The methods also needed additional instructions. The versions in Brazilian-Portuguese of RULA and SI were semantically understandable and culturally appropriate after adjustments, allowing for testing their psychometric properties.21
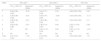
Measure properties testingThe intra-rater 1 reliability ranged from moderate to almost perfect (k=0.57–0.86; 95% CI=0.22–1.00) for RULA, with agreement percentage above 75%. The same was not observed for the intra-rater 2, who presented reliability ranging from very poor to moderate (k=0.14–0.53; 95% CI=0.00 to 0.80) in most of the steps. Only to force or load in arms the reliability was almost perfect (k=0.86–0.93; 95% CI=0.64–1.00). The agreement ranged between 42 and 99%. The inter-rater reliability for RULA was very poor (k=−0.12 to 0.13; 95% CI=−0.22 to 0.26) and the agreement ranged from 18% to 96% (Table 2).
The reliability test and the agreement percentage of RULA's version in Brazilian Portuguese.
| Steps | Intra-rater 1 | Intra-rater 2 | Inter-rater | |||
|---|---|---|---|---|---|---|
| Kappa (95% CI) | % Agreement | Kappa (95% CI) | % Agreement | Kappa (95% CI) | % Agreement | |
| 1 | 0.72 (0.61–0.81) | 81.03 | 0.46 (0.33–0.60) | 58.62 | 0.01 (−0.10 to 0.10) | 19.82 |
| 2 | 0.63 (0.46–0.77) | 81.89 | 0.50 (0.34–0.62) | 69.82 | 0.13 (0.00–0.26) | 50.86 |
| 3 | 0.71 (0.62–0.83) | 82.75 | 0.14 (0.0–0.26) | 42.24 | 0.04 (−0.03–0.12) | 24.13 |
| 4 | 0.84 (0.68–0.97) | 96.55 | 0.53 (0.19–0.78) | 91.37 | −0.05 (−0.15–0.16) | 78.44 |
| 5 | 0.68 (0.57–0.78) | 77.58 | 0.28 (0.17–0.42) | 48.27 | 0.05 (−0.03–0.15) | 23.27 |
| 6 | 0.65 (0.00–1.00) | 98.27 | 0.00 (0.00–0.00) | 99.13 | 0.00 (0.00–0.00) | 96.55 |
| 7 | 0.86 (0.64–1.00) | 98.27 | 0.93 (0.77–1.00) | 99.13 | −0.05 (−0.07 to −0.02) | 87.06 |
| 8 | 0.69 (0.60–0.78) | 77.58 | 0.30 (0.17–0.42) | 47.41 | −0.00 (−0.07 to 0.07) | 18.10 |
| 9 | 0.57 (0.44–0.70) | 75.00 | 0.30 (0.17–0.47) | 50.86 | −0.12 (−0.22 to −0.01) | 24.13 |
| 10 | 0.74 (0.60–0.86) | 81.89 | 0.42 (0.30–0.56) | 57.75 | −0.12 (−0.21 to −0.03) | 20.68 |
| 11 | 0.65 (0.22–1.00) | 97.41 | 0.43 (0.00–0.80) | 95.68 | −0.02 (−0.059–0.000) | 93.96 |
| 12 | 0.78 (0.67–0.90) | 87.06 | 0.35 (0.25–0.47) | 49.13 | −0.08 (−0.18 to −0.02) | 37.93 |
| 13 | NC | 100.00 | 0.47 (0.22–0.67) | 87.06 | 0.00 (0.00–0.00) | 89.65 |
| 14 | NC | 100.00 | NC | 100.00 | NC | 100.00 |
| 15 | 0.75 (0.64–0.85) | 85.34 | 0.36 (0.26–0.47) | 49.13 | −0.08 (−0.17 to −0.10) | 18.10 |
| Total | 0.71 (0.60–0.81) | 81.89 | 0.30 (0.17–0.43) | 48.27 | −0.03 (−0.09–0.03) | 12.93 |
Notes: NC, the calculation of these steps was not allowed by the statistical program; CI, confidence interval. Description of the steps: Group A=1 (shoulder and arm posture); 2 (forearm posture); 3 (wrist posture); 4 (pronation–supination of the forearm); 5 (partial score group A); 6 (arm muscle request); 7 (force or load in arms); 8 (total score group); Group B=9 (neck posture); 10 (trunk posture); 11 (legs posture); 12 (partial score group B); 13 (muscular requirement of trunk or legs); 14 (force or load in trunk or legs); 15 (total score group B); 16 (total score); Kappa=very poor (0.00–0.20); poor (0.21–0.40); moderate (0.41–0.60); substantial (0.61–0.80); almost perfect (>0.81).
The intra-rater 1 reliability was excellent for all steps of SI with ICC2,1 ranging between 0.91 and 0.99. The agreement was very good with ranging from −1.03% to 0.01%. The reliability from intra-rater 2 ranged from poor to almost perfect (ICC2,1 0.05 to 0.92; SEM from −0.06% to 1.98%. The inter-raters’ reliability ranged from poor to moderate (ICC2,1 0.00–0.54) with SEM between −0.17% and 1.51% (Table 3).
The reliability test and correlation of the SI Brazilian Portuguese version.
| Steps | Intra-rater 1 | Intra-rater 2 | Inter-rater | |||
|---|---|---|---|---|---|---|
| ICC2.1 (95% CI) | Agreement (SEM) | ICC2.1 (95% CI) | Agreement (SEM) | ICC2.1 (95% CI) | Agreement (SEM) | |
| 1 | 0.98 (0.98–0.99) | −0.03 | 0.84 (0.77–0.89) | 0.23 | 0.46 (0.30–0.59) | 0.35 |
| 2 | 0.99 (0.98–0.99) | −0.01 | 0.83 (0.76–0.89) | −0.06 | 0.53 (0.38–0.65) | −0.17 |
| 3 | 0.98 (0.98–0.99) | −0.01 | 0.92 (0.88–0.94) | 0.01 | 0.54 (0.39–0.65) | 0.11 |
| 4 | 0.94 (0.92–0.96) | −0.01 | 0.36 (0.19–0.50) | 0.06 | 0.08 (−0.10 to 0.24) | 0.08 |
| 5 | NC | NC | 0.05 (−0.12–0.23) | 0.02 | 0.00 (−0.17 to 0.18) | −0.01 |
| 6 | NC | NC | NC | NC | NC | NC |
| Total | 0.91 (0.87–0.93) | −1.03 | 0.73 (0.64–0.81) | 1.98 | 0.53 (0.38–0.65) | 1.51 |
Notes: NC, the calculation of these items was not allowed by the statistical program; CI, confidence interval; SEM (Standard Error of Measurement)=very good (<5%); good (>5% and =10%); doubtful (>10% and =20%); negative (>20%)43. Description of the steps=1 (the effort intensity); 2 (percentage of exercise duration); 3 (movement repetitions); 4 (hand/wrist posture); 5 (work completion speed); 6 (SI Total score); ICC (intraclass correlation coefficient)=poor (<0.40); moderate (0.40–0.75); strong (0.75–0.90); excellent (>0.90).
The English version of the Brazilian-Portuguese RULA showed appropriate internal consistency (Cronbach's α=0.88), whereas SI had low internal consistency (Cronbach's α=0.65).
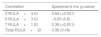
The construct validity between RULA and SI was poor for the total scores (Spearman rho=0.06; p=0.49) and for the partial scores regarding muscular requirement/repetition of movement (Spearman rho=0.04; p=0.59). There was a good correlation for the assessment of the wrist/hand-wrist posture (Spearman rho=0.61; p=0.00) and strength/intensity of exertion (Spearman rho=0.39; p=0.00) (Table 4).
Construct validity between versions in Brazilian Portuguese. RULA and SI.
| Correlation | Spearman's rho (p value) |
|---|---|
| 3 RULA×4 SI | 0.62 (<0.001) |
| 6 RULA×3 SI | −0.05 (0.6) |
| 7 RULA×1 SI | 0.39 (<0.001) |
| Total RULA×SI | 0.06 (0.49) |
Notes: Description of the steps=RULA 3 and SI 4 (wrist and hand posture); RULA 6 and SI 3 (muscular requirement/movement repetition); RULA 7 and 1 (force or load/intensity of effort); Spearman coefficient=weak correlation (0–0.3); moderate (0.3–0.7); strong (0.70–1.0).
The interpretability showed for total score to the highest (ceiling effect) and the lowest (floor effect) respectively 15.5% and 10.1% for the RULA, and 9% and 4% for SI. There was only a ceiling effect for the RULA (higher than 15%).
DiscussionCross-cultural adaptationRULA and SI cross-cultural adaptation process was conducted in accordance with Beaton et al.20 The first pre-test showed a low number of questionnaires returned due to high percentage of doubts in interpreting questions, which required a second pre-test.21 According to the respondents, the main problems found in the first pre-test of the pre-final version were incomprehension of the criteria for analysis and calculation methods. However, these problems were solved after the elaboration of additional instructions and previous training face-to-face.
The physical therapists in the second pre-test no longer reported difficulties in applying observational methods resulting in the final version suitable for testing the measurement properties.
Measure propertiesReliability RULA and SIRULA adapted version showed intra-raters reliability ranging from poor to almost perfect and inter-raters very poor. The steps with lower reliability for RULA were the body segments with more response options, such as shoulder, and the partial scores. SI demonstrated intra-raters reliability ranging from poor to excellent and inter-raters reliability ranging from poor to almost perfect. For SI the steps with poor reliability were the ones that needed to identify the work cycles, to evaluate the movement speed of the wrist.
A comparison of the internal consistency results of adapted versions with its original version was not possible, because it is not presented these analyses.8,18,19 However, others studies24,25 showed intra-rater reliability ICC2.1 ranged from 0.56 to 0.95 (moderate to excellent)24 or moderate to good inter-rater reliability ICC (0.59) for SI.25 Thus, our results showed that both instruments have reliability similar to other observational methods,8,14–16 although the lack of precision of these methods affected the analysis of outcomes.6 The internal consistency of RULA was positive as well as result was detected for the Brazilian Portuguese version of QEC (Cronbach's α=0.76).14,15 On the other hand, the SI adapted showed low value of Cronbach alpha coefficient (α), indicating that, some steps of this method measure different concepts, as expected.10
The reliability of observational methods can be influenced for five variables: the worker, the work, the method, the rater and the time.24 The variable that may have affected directly reliability were time (test-retest) and the experience of the raters,24 even though it that confirmed that experience rater level contribute to significant differences in the RULA scores.26 In contrast, the raters were good agreement for the majority of the steps in inter-raters assessment using RULA thus presenting an agreement of 100%. SI exhibits the risk classification through score (<3=7 points) and scores ranging from 0.05 to 1.05 points. Therefore, the agreement measurement exhibited by SEM27 in general was good, because it did not have relevance on the variation of the total rating possible for the method.
Construct validityThe correlation between RULA and SI was negative for total measured by means of the comparison between some steps of the methods that were the variables whose construct were similar, and by means of the hypothesis test. This is possible because the scores of the evaluation method are grouped by body segments, and characteristics such as use of force, repeatability load and exertion, as in the case of RULA and SI, so their construct validity may, in theory, be estimated by comparison of the step.8
The initial hypothesis that has not been confirmed yet was the correlation between the score of muscle request/RULA and SI repetition. The results showed a low and negative correlation between the methods, reaffirming that RULA evaluates mainly the upper limb's postures and SI the intensity of exposure. Therefore, we believe that the methods could be used complementarily.28 The hypotheses tested in this study that RULA would exhibit moderate correlation to high with SI, concerning the ratings of the wrist/hand-wrist posture and strength/intensity of exertion was confirmed. This was also observed in a study, which used different methods to assess exposure in an occupation with high repeatability, where SI and OCRA.29,30
Interpretability/floor or ceiling effectsRULA showed ceiling effect only a little above the threshold of 15%. This finding indicates that the method has certain difficulty in distinguishing the level of risk exposure between the high-risk tasks, and may interfere in the classification for decision-making regarding the immediate or delayed intervention. SI did not exhibit floor-ceiling effect, which indicates that the method can discriminate between the tasks with higher and lower risk, increasing the reliability of the method.10
LimitationsThe both methods require training for use; however, in this study it was not possible to identify how much time is required for this. It was not possible to identify if there is interference in relation to minimum experience from the professionals, suggesting hence that assessments be more consistent when the same rater holds them. Another possible limitation, concerning the videos reproduction is the absence of zoom with a camera in the region of the hand/wrist, which may have hindered the evaluation of this region. Although there were no complaints from the raters, future studies should consider this issue.
ConclusionRULA and SI have Brazilian Portuguese versions suitable for use with semantic and cultural equivalence. The RULA reliability ranged from very poor to almost perfect and SI ranging from poor to excellent. The internal consistency was appropriate for RULA, and low for SI. The construct validity between methods was poor for total scores but moderate of muscle request/movement repetition. There was a moderate correlation to the wrist/hand-wrist posture and the strength/intensity of exertion.
Conflicts of interestThe authors declare no conflicts of interest.
The following are the supplementary data to this article:


