


Estimates of prevalence of musculoskeletal pain in children and adolescents vary considerably and the impact of pain on children's life is often not considered.
ObjectiveTo determine the one-month prevalence of disabling musculoskeletal pain in children and adolescents. The secondary aims are to: 1) determine the body region with the highest prevalence; 2) understand the characteristics of the children with disabling musculoskeletal pain; and 3) describe the parents' perception of the prevalence.
MethodsThis cross-sectional study was conducted in public and private schools in the states of São Paulo and Ceará, Brazil. Children self-reported presence and impact of pain, pain intensity, psychosomatic symptoms, and quality of life. Parents completed parent-proxy versions and perception of the child's sleep quality. Descriptive statistics were used to summarise the data.
ResultsA total of 2,688 children and adolescents were included in this study. The prevalence of disabling musculoskeletal pain in the previous month was 27.1%. The back was the region most often affected (51.8%). Children with disabling musculoskeletal pain were older, heavier, had worse relationships with their family, perceived their backpacks as heavy, carried their backpacks more with one shoulder, had more negative psychosomatic symptoms, had poorer quality of life, and had higher pain intensity. Parents tended to underestimate the presence of pain in their children.
ConclusionThe one-month prevalence of activity limiting musculoskeletal pain in children and adolescents was 27.1% with the back being the most often affected body region. Parents tended to underestimate the presence of pain in their children.
The burden of musculoskeletal pain in children and adolescents is unclear.1 Individual studies provide estimates for prevalence from as low as 4% to as high as 40%.2,3 While the Global Burden of Disease (GBD) studies provide figures suggesting musculoskeletal disorders are a significant problem, it is important to understand that the GBD study presents modelled estimates, even if no primary data exist.4 The problem with limited data becomes an even greater concern when trying to understand disease burden at the national or sub-national level. In Brazil, for example, the estimates of the prevalence of musculoskeletal pain in children and adolescents range from 20% to 45%,5-8 and most studies were conducted in small cities. In addition, most of these studies investigated specific musculoskeletal conditions,5-8 and did not consider the pain's impact on activities of daily living for children and adolescents (e.g., absence from physical or leisure activities, and school absenteeism).
Investigating pain that has an impact (e.g., disabling pain) is important and will allow us to understand what proportion of children and adolescents have pain that negatively influences their lives (e.g., reducing their activities of daily living). This is, perhaps, an important proportion of children and adolescents who may need to seek care and receive better attention from the health system. Therefore, the primary aim of this study is to determine the one-month prevalence of disabling musculoskeletal pain in children and adolescents living in an urban setting in Brazil. The secondary aims of this study are to: 1) determine the body region with the highest prevalence of disabling musculoskeletal pain; 2) understand the characteristics of the children with disabling musculoskeletal pain; and, 3) describe the parents' perception of the prevalence of disabling musculoskeletal pain.
MethodsStudy designThis is a cross-sectional study approved by the Research Ethics Committee of the Universidade Cidade de São Paulo (CAAE: 18752219.0000.0064). This study was conducted in public and private schools in the state of São Paulo (cities of Itu, Salto, São Sebastião, and São Paulo) and Ceará (Fortaleza city), Brazil. Schools were selected by the researchers according to the municipal district councils’ authorisation (East and West zone of São Paulo city and inner cities), by convenience, and also to get a balance of socioeconomic status. We carefully chose schools from São Paulo city that consisted of 45.5% immigrants from other states.9 This provided good cultural representativeness from different states of Brazil. Data collection was performed between November 2020 and December 2021.
ParticipantsWe included any children and adolescents aged between 8 and 18 years able to read Brazilian-Portuguese and their respective parents and/or guardians. The minimum age of eight years old was chosen because it is the age at which the child usually has sufficient linguistic and cognitive development to report their symptoms.10 Only children and adolescents whose parents and/or guardians authorised participation through the consent form had their data included in the study. We did not consider children and adolescents with pain due to surgery or any specific pathology (e.g., cancer, infection, fracture, inflammatory conditions).
Definition of disabling musculoskeletal painWe measured the one-month prevalence of back, neck, arm, or leg pain using the Presence and Impact of Pain in Kids (PIP-Kids) questionnaire.11 Disabling musculoskeletal pain was defined as self-reported pain in any of those four regions that (i) resulted in school absence, (ii) interfered with normal activities, and/or (iii) interfered with recreational activities.
VariablesWe measured the prevalence of disabling musculoskeletal pain (primary outcome); pain intensity; psychosomatic symptoms; sleep quality (parent report), and quality of life. In addition, we asked specific questions about school and life habits (e.g., perception of the weight of the backpack, methods of carrying the backpack, participation in sports activities) and the child's relationship with their family.
We asked questions about sociodemographic variables to parents (or guardians) (including age, biological sex (female/male), education level, marital status, socioeconomic level, and perception of their own health status), and habits, body characteristics, and lifestyle of their children (e.g., child's height (in meters) and weight (in kilos) – used to calculate body mass index (weight/height*height), mode of transport to school, child's medical history, perception of the child's backpack weight, time that their child spends watching television or playing video games).
We also included questionnaires for parents to complete regarding their perception of the presence of disabling musculoskeletal pain in their child, perception of the presence of psychosomatic symptoms in their child, perception of their child's quality of life, and perception of their child's sleep quality.
Data measurementData collection – proceduresAll children and adolescents received an explanation of the study from the teachers and also received an envelope to be taken home and filled out by their parents and/or guardians. This parent's envelope contained the consent form for parents and/or guardians to sign authorising the participation of their children and themselves in the study. In addition, this envelope contained specific questionnaires to be completed by parents and/or guardians. If parents agreed to participate in the study, they had to sign the consent form, complete the parent's questionnaires, and send all the material back to school with their child. This procedure was done within one week of receiving the envelope. When this material was returned to the school (on a pre-specified date), children received the assent form and the questionnaires to be self-completed (self-reported – children answered the questionnaires by themself). The questionnaires were completed by children and adolescents during class time and teachers were asked to help with any interpretation issues.
Assessment of children and adolescentsThe child and adolescent questionnaire collected data on sports participation, relationship with family, perception of backpack weight as heavy, and how they usually carry a backpack. The main study variable (presence of disabling musculoskeletal pain) was assessed using the Presence and Impact of Pain in Kids (PIP-Kids) questionnaire.11 The PIP-Kids contains 10 items divided into two parts. Items 1–5 refer to the presence of musculoskeletal pain and questions 6–10 refer to the impact of pain.11
For this study, we defined disabling musculoskeletal pain as present when the child or adolescent answered “yes” to question 1 (Did your back, neck, arms (including hands), or legs (including feet) hurt at any time in the last month?) AND ‘yes” to one of the questions 8, 9, or 10 (8. Have you been absent from school due to pain in your back, neck, arms, or legs in the last month?; 9. Have you ever had pain in your back, neck, arms, or legs that interfered with your normal activities in the last month?; 10. Has back, neck, arm, or leg pain interfered with your recreational activities (e.g., sport, walking, cycling, etc.) in the last month?) of the PIP-Kids questionnaire.11
Children who reported the presence of pain were also asked to rate the intensity of their pain using the Numerical Pain Rating Scale (NPRS), previously translated and validated to Brazilian Portuguese.12 This questionnaire had an intraclass correlation coefficient (ICC) of 0.94 (95% CI: 0.90, 0.96) (reliability) and a strong correlation with disability-related measurements (r = 0.63; p<0.01).12
Psychosomatic symptoms were assessed using the Psychosomatic Symptoms Questionnaire.13 This questionnaire contains 9 items and final scores range from 0 to 18 with higher scores representing more complaints of psychosomatic symptoms. The instrument was previously translated and cross-culturally adapted to Brazilian Portuguese.13 This questionnaire had a standard error of measurement (SEM) of 2.29, a minimum detectable change (MDC) of 6.35 points out of 18 points, a Cronbach Alpha of 0.69 (internal consistency), and an Intraclass Correlation Coefficient (ICC) of 0.78 (95% CI: 0.87, 0.84) (reliability).13
The quality of life of children was assessed through the Pediatric Quality of Life Inventory Child and Adolescent. This questionnaire has a version designed for children aged 8 to 12 years old and a version for adolescents aged 13 to 18 years old. Each questionnaire consists of 23 items covering the following domains: 1) physical domain (eight items); 2) emotional domain (five items); 3) social domain (five items); and, 4) school domain (five items).14 Final scores range from 0 to 100 with higher scores representing better quality of life. This quality of life questionnaire was previously translated and cross-culturally adapted to Brazilian Portuguese and has excellent reliability; excellent internal consistency (Cronbach alpha of 0.88), and a strong positive correlation between children and parents for the assessment of the physical domain (r = 0.77; p<0.001).14
Assessment of parents (or guardians)The parent questionnaire collected data on the parents’ age, sex, highest educational level, marital status, socioeconomic level; child's height and weight, and perception of their own health status, child's medical history, habits, and lifestyle. The presence and impact of pain in children and adolescents from the parents’ perspective were also assessed through the 10 items of the Presence and Impact of Pain in Kids – Parent-Proxy Report questionnaire adapted to Parent-Proxy Report.11 The questionnaire is similar to the child's version of the PIP-Kids. We considered disabling musculoskeletal pain (perceived by parents) to be present if parents answered “yes” to question 1 and “yes” to at least one of questions 8, 9, or 10.
Psychosomatic symptoms in children and adolescents from the parents’ perspective were assessed through an adapted parent-proxy version of the Psychosomatic Symptoms Questionnaire.13 This adapted version has specific questions targeting parents' perspectives on the presence of psychosomatic symptoms in children and adolescents.13 Final scores range from 0 to 18 with higher scores representing more complaints of psychosomatic symptoms.
Parents’ perception of their child's quality of life was assessed through the Pediatric Quality of Life Inventory Parent-Proxy Report. Each questionnaire consists of 23 items covering the same domains of the child's version. This instrument has also been previously translated and cross-culturally adapted to Brazilian Portuguese and had its measurement properties tested.14
The perception of the sleep quality of the child (scored by parents) was assessed through the Pediatric Sleep Questionnaire. This questionnaire has already been translated and adapted into Portuguese from Portugal and also had its measurement properties tested previously.15 The instrument showed good internal consistency (Cronbach's alpha of 0.78) and good reliability with a Kappa ranging from 0.61 to 0.70.15 The questionnaire contains 22 items, uses a three-level response scale (0 = no; 1 = yes), and higher scores represent more sleep disturbance.
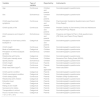
Table 1 presents each variable, type of variable (e.g., continuous, categorical), who reported (e.g., children, parents), and the instruments used.
Description of the variables included in the study.
The sample size calculation for this study was based on the estimated sample of a cohort study on disabling musculoskeletal pain in children and adolescents from our research group and previous literature on prevalence studies. According to the available literature, we estimated a prevalence of 20%.16-19 Enrolling 1900 children would provide a precise prevalence estimate with the 95% CI spanning from 18% to 22%.
Statistical methodsWe used descriptive statistics to summarise the characteristics of the sample. Mean and standard deviation (SD) were used for continuous data and, absolute frequency/percentage for categorical or dichotomous data. We estimated prevalence by the absolute frequency, percentage, and confidence intervals (CIs) of participants who self-reported disabling musculoskeletal pain. We compared the characteristics of children and adolescents with and without musculoskeletal pain by mean differences (continuous variables), odds ratio (categorical or dichotomous variables), and respective CIs. The characteristics of the sample to be compared include: age, child's weight, medical diagnosis, assessment of psychosomatic symptoms, quality of life, quality of sleep, and pain intensity score. We also compared the prevalence of disabling musculoskeletal pain reported by children and adolescents with the report from parents/guardians using a cross-tab. All analyses were performed in IBM SPSS software version 23.0 (IBM corporation, Somers, NY, USA and Excel (Excel for Mac 2011, Version 14.7.3; Microsoft), and PEDro CIs calculator (to compare children and adolescents with and without disabling musculoskeletal pain).
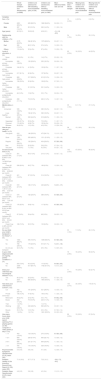
ResultsFrom 75 invited schools, 28 agreed to participate in this study, with 12,036 children and adolescents invited. From the total sample invited, 2688 (22.3%) children and adolescents were included in this study, and 728 children and adolescents reported disabling musculoskeletal pain. This equates to a 1-month prevalence of 27.1% (95% CI: 25.4, 28.8). Table 2 presents the sociodemographic, health-related, and other characteristics of children and adolescents with (n = 728; 27.1%) and without (n = 1960; 72.9%) disabling musculoskeletal pain. Of those children and adolescents with disabling musculoskeletal pain (n = 728), 14.0% reported arm pain, 20.4% neck pain, 42.3% leg pain, and 51.9% back pain (Table 3).
Characteristics of children and adolescents with (n = 728) and without musculoskeletal pain (n = 1960).
BMI, body mass index.
CIs, confidence intervals.
SD, standard deviation.
Impact and pain location of children and adolescents with disabling musculoskeletal pain (n = 728).
| Definition of disabling musculoskeletal pain | Children and adolescents with disabling musculoskeletal pain (n=728) | Missing values, n (%) | Prevalence estimate% (95% CI) |
|---|---|---|---|
| Impact of pain | |||
| Pain in back or neck or arms or legs in past month that resulted in school absence | 282 | 9 (1.2%) | 38.7 (35.3, 42.3) |
| Pain in back or neck or arms or legs in past month that inter- fered with normal activities | 371 | 4 (0.5%) | 51 (47.3, 54.6) |
| Pain in back or neck or arms or legs in past month that interfered with recreational activities | 453 | 3 (0.4%) | 62.2 (58.6, 65.7) |
| Pain location* | |||
| Back pain in past month | 377 | 4 (0.5%) | 51.8 (48.1, 55.4) |
| Neck pain in past month | 151 | 4 (0.5%) | 20.7 (17.9, 23.8) |
| Arm pain in past month | 102 | 4 (0.5%) | 14.0 (11.6, 16.7) |
| Leg pain in past month | 305 | 4 (0.5%) | 41.9 (38.3, 45.5) |
Children and adolescents with disabling musculoskeletal pain were mostly girls (n = 405, 55.6%), with a mean age of 12.1 (SD 2.6) years old. Children with disabling musculoskeletal pain were older, heavier, reported poorer relationships with their family, perceived their backpacks as heavier, carry their backpacks more by one shoulder, had more pain in back, neck, arms, and legs, had more negative psychosomatic symptoms, had less quality of life, had higher pain intensity, had more painful conditions diagnosed, and spent less time watching TV or playing games than children who did not self-report disabling musculoskeletal pain. Table 4 presents the sociodemographic data from parents (or guardians) and their perception of their child's health. Parents’ reporting on the perception of disabling musculoskeletal pain in their children was 12.3% (95% CI: 11.2, 13.7). Table 5 compares the child's and parent's perceptions of disabling musculoskeletal pain. Parents under-estimated the child's pain in 17.8% of the cases, where the child reported having disabling musculoskeletal pain but their parents perception is that there is “no” pain. The opposite problem was less common; in only 4.3% of cases the parent reported that their child had disabling musculoskeletal pain when the child said they did not (Table 5). The mean score of parents’ perceptions (for those with children with disabling musculoskeletal pain) on child's Psychosomatic Symptoms was 5.9 (SD 4.0) of 18 points, and the mean score on child's Quality of Life (Parent-Proxy Report) was 67.7 (SD 17.3) of 100 points. The mean score of the parents' perception of child's sleep quality was 5.6 (SD 3.6) of 22 points.
Parents and/or guardians of children and adolescents with disabling musculoskeletal pain (n = 728) and without musculoskeletal pain (n = 1960).
BMI, body mass index; CIs, confidence intervals; SD standard deviation.
Missing data of the main outcome (disabling musculoskeletal pain): 2.3% (n = 17).
Prevalence of disabling musculoskeletal pain in children and adolescents and their parents' perception.
Categorical and dichotomous data were represented by numbers and percentages.
Missing data: 1.7 % for parents and/or guardians’ data (n = 47).
The one-month prevalence of disabling musculoskeletal pain in children and adolescents was 27.1% (95% CI: 25.4, 28.8). From those with disabling musculoskeletal pain, the back (51.8%) was the most cited region, followed by legs (41.9%), and neck (20.7%). Children with disabling musculoskeletal pain reported having a poorer relationship with their family, their perception of backpack weight was reported as heavy, they carried their backpacks more by one shoulder, and had more pain in back, neck, arms, and legs. Children with disabling musculoskeletal pain had higher scores on the Psychosomatic Symptom Questionnaire and Pediatric Quality of Life Inventory Child and Adolescent compared to children and adolescents without disabling musculoskeletal pain. The parents' perceptions of their children's health showed that parents seemed to underestimate the presence of disabling musculoskeletal pain in their children by 17.8%.
The strength of our study is that we investigated disabling musculoskeletal pain in general, that is, any musculoskeletal pain that impacts the lives of children and adolescents, not limited to a specific musculoskeletal region or condition. In addition, we enrolled a representative sample of children and adolescents from São Paulo state in Brazil. The population of Sao Paulo consisted of 45.5% immigrants from other states, showing a good cultural representativeness from different states of Brazil.9 We also considered the perspective of the children and their parents/guardians, as most studies present data only from the parent's perspective. However, this study also presents some limitations. The instrument used considers a period of the 'last month' to report the symptoms, therefore, memory bias must be considered. To investigate the prevalence of disabling musculoskeletal pain, a self-reported instrument previously used to assess back pain in adolescents was used. However, there is no gold standard in the area to investigate this type of pain and its repercussions. We included just two states in Brazil, due to feasibility. We included different cities in Sao Paulo to try to improve external validation. Also, the study is cross-sectional, preventing an understanding of the causality of disabling musculoskeletal pain.
The prevalence of disabling musculoskeletal pain reported in our study is within the global prevalence estimates reported in the literature;2,3 but care needs to be taken in interpretation as the studies defined prevalence in different ways. A cross-sectional study conducted in the UK primary care system (n = 16,862, 3–17 years old), found an annual prevalence of 8% for at least one musculoskeletal problem.20 They also considered musculoskeletal pain in the same regions, except for headache. However, they consulted electronic records, instead of self-reported from the general population as in our study, and this could underestimate the prevalence of musculoskeletal pain. In Finland, a cohort study of 1756 children with a mean age of 11.8 years found a one-month prevalence of musculoskeletal pain of 38.9%.21 They found a prevalence very similar to our study, even if did not consider disabling musculoskeletal pain. However, the authors considered musculoskeletal pain when children and adolescents felt this pain at least once a week. In India, a cross-sectional study collected data through a structured questionnaire from 1329 children and adolescents (10 to 16 years old) and reported an annual prevalence of 18.8%.22 The data collection was also in public and private schools, however through a narrower range of ages. The authors, however, provided a corporal map to guide the report of musculoskeletal pain from children and adolescents. In Brazil, a cross-sectional study investigated the prevalence of musculoskeletal pain at different anatomical sites in 3269 children and adolescents (10 to 17 years old), and found a one-year prevalence of 13.1%.23 In this study the authors also showed to children and adolescents a corporal map to guide the self-report. Although the prevalence found in our study is consistent with previous studies, none of those aimed specifically to investigate disabling musculoskeletal pain, that is, pain that results in any type of impact on the child's life, and most have different recall periods for prevalence (e.g., annual).
In this study, the prevalence of pain was higher in the back and legs regions. A previous cohort study evaluated the prevalence of musculoskeletal complaints among children aged 11 to 14 years. The authors found that girls reported higher rates of musculoskeletal complaints than boys, particularly for back complaints.24 We also found that children and adolescents with disabling musculoskeletal pain also had higher rates of negative psychosomatic symptoms than children and adolescents without disabling musculoskeletal pain. One previous study performed a secondary analysis of a prospective longitudinal cohort study investigating whether adolescents with negative psychological symptoms and who were 13 years old were more likely to have musculoskeletal pain than 17 years old. Data from 3865 adolescents showed higher odds of later musculoskeletal pain in those populations (OR = 1.68; 95% CI: 1.28, 2.20).25
In our study, 17.8% of children and adolescents reported having disabling musculoskeletal pain while their parents disagreed. A previous cross-sectional study aimed to describe the impact of pain on daily life, perceived pain triggers, and the level of agreement between parents and children's perceptions of pain. In our study, the agreement between parents’ and children's perceptions was similar to this previous study. In other words, the authors of the previous study found that 17% of the parents underestimated their child's pain.26 One possible reason for this underestimate of musculoskeletal pain in children and adolescents is because parents did not believe the reports from their children and adolescents. A previous qualitative study identified this perception from children and adolescents with chronic pain, that family and doctors did not take their self-report of pain into consideration.27 Also, some children and adolescents can feel this pain in specific activities (e.g., sports in school), and do not report this pain to their parents.
Understanding the prevalence of musculoskeletal pain in children and adolescents will allow us to understand the current scenario of this condition, especially in Brazil. Prevalence studies are important to elucidate the burden of the condition and to support the identification of future priorities in healthcare and research. Prospective longitudinal cohort studies are still necessary to improve the understanding of the course of musculoskeletal pain in children and adolescents as well as the possible factors associated with its development and who may or may not recover.
ConclusionThe one-month prevalence of disabling musculoskeletal pain was 27.1% (95% CI: 25.4, 28.8), with the back being the most affected body region. In addition, the findings indicate that parents tend to underestimate the presence of pain in their children.
The authors would like to thank to São Paulo Research Foundation (FAPESP-Brazil) for all financial grant support and to Universidade Cidade de São Paulo (UNICID) for all resources and structure to conduct this study. This study was supported by the Sao Paulo Research Foundation (FAPESP 2017/17484-1); Dr Yamato is supported by the Sao Paulo Research Foundation (FAPESP 2019/10330-4); Dr Santos held a PhD scholarship from the Sao Paulo Research Foundation (FAPESP 2019/12049-0); Dr Leite held a PhD scholarship from the Sao Paulo Research Foundation (FAPESP 2020/03629-0); and Dr Espirito Santo held a PhD scholarship from the Sao Paulo Research Foundation (FAPESP 2021/08776-4).


