


Developmental coordination disorder (DCD) is a neurodevelopmental disorder characterized by deficits in performing motor tasks. Research suggests social skills are also altered.
ObjectiveTo investigate (1) whether the presence of DCD affects social responsiveness, (2) whether the co-occurrence of autism spectrum disorder (ASD) affects social responsiveness in children with DCD, and (3) whether there is an association between motor performance and social responsiveness in children with DCD.
MethodsBased on parental reports, children aged 5 to 15.5 years were assigned to one of three groups: DCD only (noASD, n = 67), DCD and suspected ASD (sASD, n = 13), and DCD and confirmed ASD (cASD, n = 22). Parental answers to the Social Responsiveness Scale (SRS-2) and the DCD-Questionnaire (DCD-Q) were compared to norm values using one sample t-tests, and between groups using ANOVA and MANOVA. Pearson correlation coefficients explored the relationship between the SRS-2 and DCD-Q in the total group and per group.
ResultsCompared to norm values, difficulties in all areas of social responsiveness were reported in children with DCD, regardless of group (p<0.001). Compared to the noASD group, more unfavorable SRS-2 total T-scores and poorer DCD-Q scores were observed in sASD and cASD groups. Only in the total group, motor performance showed significant weak to moderate associations with the SRS-2 total T-score and all subscales except for ‘social motivation’ (r=-0.306 to -0.405; p ≤ 0.02).
ConclusionSocial responsiveness difficulties are more common in children with DCD and are more severe in the ASD groups. Motor performance and social responsiveness are weak to moderately associated.
Clinical Trial Registration NumberNCT05092893 (https://clinicaltrials.gov/study/NCT05092893)
Developmental coordination disorder (DCD) is a neurodevelopmental disorder described in the Diagnostic and Statistical Manual of mental disorders fifth edition (DSM-5) as motor coordination problems that significantly interfere with daily living activities and participation.1 These early emerging coordination problems cannot otherwise be explained. Although DCD is considered a ‘motor’ disorder, other domains of functioning may equally be affected such as physical fitness, executive functioning, and socio-emotional development. Social skills of children with DCD are of particular interest as they may mediate the emergence of secondary consequences such as depression and anxiety.2
Research has suggested important alterations in social skills of children with DCD, yet the causal processes remain unclear. A classical hypothesis is that early coordination problems lead to avoiding, or inhibit, age-appropriate physical and social activities, which may reduce the opportunities to develop adequate socials skills and/or may impact negatively on a child's developing self-esteem creating a sense of isolation and exclusion.3 These children indeed seem to spend more time playing alone and are often onlookers instead of actively engaging in play.4,5 Even in general they exhibit a lower participation rate which may contribute to poorer peer relations, fewer (deep) friendships, and a tendency for more loneliness or being bullied.6-10 Overall, they seem to feel less competent in peer and other social relationships.11
The social challenges in children with DCD may however not merely be attributed to the coordination difficulties as the extent could be larger than in groups of children with more severe and more visible motor difficulties such as cerebral palsy.12 Additionally, not all children with DCD seem to experience social difficulties. In contrast, in clinical practice we often see children with DCD who have very strong communicative skills and actively use this as a social compensation strategy. Most importantly, also non-verbal social skills seem to be affected with children spending less time looking at the face/eye regions, showing a reduced tendency to follow gaze,13 and demonstrating poorer emotion recognition,14-16 similar to children with autism spectrum disorder (ASD).17 Indeed, DCD and ASD often co-occur with four to nine percent of children with DCD having co-occurring ASD18 and more than 90% of children with autism meeting the diagnostic criteria of DCD.19 Although DCD and ASD are two distinct disorders with their own unique characteristics, there seems to be an overlap in social and motor presentation. The magnitude of social responsiveness difficulties in children with DCD is unclear with some studies reporting no difficulties20 while others report ratios up to 36%.21
With this study we aim to investigate (1) whether the presence of DCD affects social responsiveness, (2) whether the co-occurrence of suspected or confirmed ASD affects the social responsiveness of children with DCD, and (3) whether there is an association between motor performance and social responsiveness in children with DCD. For this reason, we defined the following three research questions. The first research question is: “Compared to a normative sample of typically developing children, how do children with only DCD and children with a co-occurrence of DCD and suspected or confirmed ASD perform on the social responsiveness scale?”. Based on previous literature,21 our hypothesis is that the mere presence of DCD affects children's social responsiveness. We expect that both children with only DCD and children with co-occurrence of DCD and suspected and confirmed ASD will experience more social responsiveness difficulties compared to norm. The second research question is: “How does the social responsiveness performance differ between children with only DCD, children with DCD and suspected ASD, and children with DCD and confirmed ASD?”. Again, based on previous literature,21 our hypothesis is that we will find more social responsiveness difficulties in the children with DCD and suspected or confirmed ASD than in the children with only DCD, and more difficulties in children with confirmed ASD compared to children with suspected ASD. The third research question is: “Is there an association between motor performance and social responsiveness in children with DCD?”. Based on previous literature, we expect to detect a significant moderate relationship.22
MethodsThis observational cross-sectional study was approved by the Medical Ethics Committee of the Ghent University Hospital (B6702021000688) and was conducted fully online. Informed consent was obtained from all participants.
Sample size calculationAn a priori power analysis using G*Power23 was completed. Effects sizes were calculated based on preliminary data collected at our university, but not included in this data set, of a yet to be published study where the Social Responsiveness Scale - second edition (SRS-2) was used to verify inclusion and exclusion criteria. In that particular study three groups of 6-to-12 year-old children were recruited, i.e. typically developing children, children with DCD, and children with DCD and co-occurring ASD. We assumed two-tailed t-testing with α set at 0.05 and a desired power of 95%. Large effect sizes were established based on the preliminary data with Cohen's d = 1.68 for the first comparison (typically developing children versus DCD) and Cohen's d = 1.13 for the second comparison (DCD versus DCD+ASD) resulting in total sample size requirements of 22 and 44 participants respectively.
Participants and recruitmentStudy announcements were distributed in Belgium and the Netherlands by contacting physical therapists, rehabilitation centers, and parental support groups for children with DCD. Parents of children with confirmed DCD aged 5 to 15.5 years were encouraged to complete the online questionnaire on the Research Electronic Data Capture network (REDCap)24 hosted by Ghent University between November 2021 and January 2022. The included ages in this study correspond to the age range of the Developmental coordination disorder Questionnaire (DCD-Q). Children with an intelligence quotient (IQ) below 70 were excluded based on previous recommendations for children with DCD.25 Parents were requested to report any other co-occurring conditions, but the presence of such conditions did not result in exclusion as co-occurrence is common in DCD. Only children who were reported to be diagnosed with DCD after multidisciplinary assessment were included in the study, excluding all children without a confirmed diagnosis of DCD and those diagnosed after a monodisciplinary assessment.
Instruments online questionnaireInformation was obtained concerning the socioeconomic and developmental status of the child. Socioeconomic status was calculated based on the Hollingshead four-factor Index. Next, standardized questionnaires were used to measure the level of daily life motor problems (DCD-Q) and SRS-2.
Hollingshead four-factor indexThe Hollingshead four-factor Index26 was used as a measure of the socioeconomic status (SES). The index is calculated based on parental education and profession. With a range between 8 and 66, a higher score represents a higher SES.
SRS-2 questionnaire (DCD-Q)The DCD-Q is a parental 15-item questionnaire to detect the risk of DCD in children between 5 and 15.5 years of age.27 Parents were requested to compare their child's motor performance to their peers using a 5-point Likert scale resulting in a total sum score (range= 15 - 75) which was compared to age-specific Dutch cut-off scores. A total score of ≤46 (5 - 7y11m), ≤55 (8 - 9y11m), or ≤57 (10 – 15y6m) was considered an indication for DCD. The questionnaire demonstrates excellent internal consistency and test-retest reliability.28 It shows good sensitivity (85%) but lower specificity (71%).29 Moderate correlation has been detected in relation to the Movement Assessment Battery for Children (MABC).27
Social responsiveness scale - second edition (SRS-2)The SRS-2 is a parental 65-item questionnaire to detect difficulties in social responsiveness in children with ASD.30 In this study, the form for school-aged children was used. Based on sex and country specific normative scores (mean T-score= 50; SD= 10), T-scores were calculated for the total score and the five subscales: Social Awareness (recognizing social cues), Social Cognition (interpreting social cues), Social Communication (expressive social communication including motor aspects), Social Motivation (motivation to engage in interpersonal contact and hinder from anxiety or limited empathy), and Autistic Preoccupations (stereotypical behavior and limited interests). Scores were interpreted in four categories i.e. high degree of social responsiveness (T-score <40), normal degree of social responsiveness (T-score between 40 and 60), mild to moderate difficulties in social responsiveness (T-score between 61 and 75), and severe difficulties in social responsiveness (T-score >75). The SRS-2 shows excellent internal consistency and moderate inter-rater reliability (r = 0.24 - 0.82). Both sensitivity (90%) and specificity (88%) are excellent.
Statistical analysesIBM SPSS Statistics version 26 was used for data analyses. Participants were allocated to one of three groups: children with only DCD but no diagnosis of ASD (noASD), children with DCD and suspected ASD (sASD), and children with DCD and a confirmed diagnosis of ASD (cASD). The children were categorized based on parental report. Normality was established based on non-significant Kolmogorov-Smirnov tests for both total-scores and subscales in the total group and the three groups. Only for the subscale ‘Autistic Preoccupations’ in noASD a non-parametric distribution was suggested. Yet, based on the observation of the QQ-plot and histogram, the presence of normality in the other groups, and the large sample size, a normal distribution was assumed. To determine differences between social responsiveness in children with DCD and the normative typically developing sample, the mean and standard deviation (mean= 50; SD= 10) of the normative sample defined in the manual of the SRS-230 was used to conduct one sample t-tests per group. Next, multiple one-way ANOVAs with post-hoc Bonferroni analyses were conducted to determine any differences between the three groups regarding SES, gestational age (GA), age, and total IQ. Chi² and Fisher-Exact tests were conducted to investigate differences between the three groups regarding sex and the presence of co-occurring disorders. No significant differences were withheld between the three groups concerning mean SES, GA, birthweight, sex, and the presence of co-occurring disorders. One-way ANOVA with post-hoc Bonferroni analyses was used to determine differences in total-T-score over the three groups. Similarly, MANOVA with post-hoc Bonferroni analyses was conducted to compare the five subscales between the three groups. Seven mild univariate and no multivariate outliers were observed. The detected outliers were not excluded as they represent the heterogeneity in this group of children. Differences with p-levels smaller than 0.05 were considered significant. Lastly, Pearson correlation coefficients were computed to investigate the association between DCD-Q scores and SRS-2 scores.
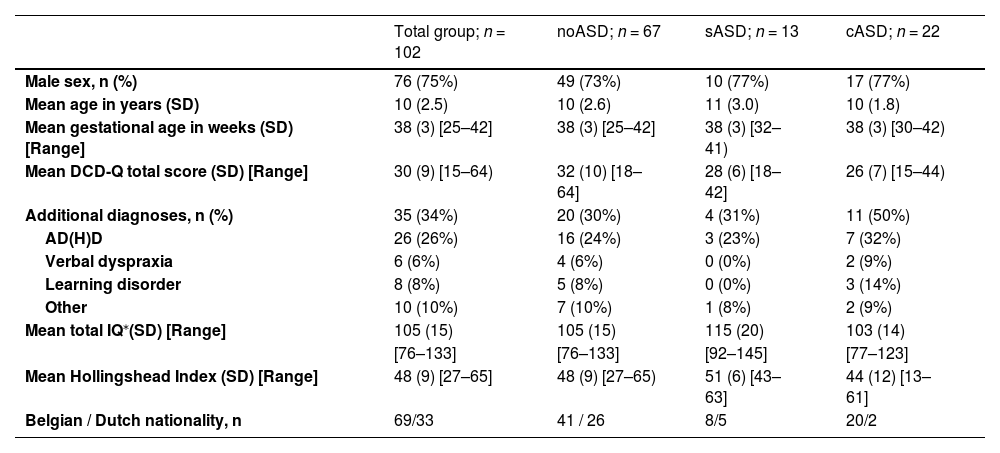
ResultsParticipants’ characteristicsA total of 137 questionnaires were fully completed of which 102 were withheld after the exclusion of children without confirmed DCD (n = 18), outside of the included age range (n = 12), with intellectual disability (IQ <70; n = 2), and in whom the DCD diagnosis was not set in a multidisciplinary setting (n = 3). Included participants received a confirmed diagnosis of DCD in the following multidisciplinary settings: a Center for Developmental Disabilities (37%), a rehabilitation center (37%), or in a private setting (26%). The DCD-Q yielded a false negative result in two participants. A total of 22 children had a co-occurring diagnosis of ASD confirmed in a Center for Developmental Disabilities (32%), a Rehabilitation Center (41%), or by a child psychiatrist (27%). Additionally, 13 children were considered to have suspected ASD, but the diagnosis had not (yet) been confirmed. Intelligence quotients were reported in 86% of the children with 25% of the children scoring in the above average zone. Of the children for whom no intelligence quotients were reported, two children repeated a year of school and both were diagnosed with or suspected to have ASD. Participant characteristics of the total group and the three subgroups are reported in Table 1.
Participant characteristics of the total group and three ASD-subgroups.
| Total group; n = 102 | noASD; n = 67 | sASD; n = 13 | cASD; n = 22 | |
|---|---|---|---|---|
| Male sex, n (%) | 76 (75%) | 49 (73%) | 10 (77%) | 17 (77%) |
| Mean age in years (SD) | 10 (2.5) | 10 (2.6) | 11 (3.0) | 10 (1.8) |
| Mean gestational age in weeks (SD) [Range] | 38 (3) [25–42] | 38 (3) [25–42] | 38 (3) [32–41) | 38 (3) [30–42) |
| Mean DCD-Q total score (SD) [Range] | 30 (9) [15–64) | 32 (10) [18–64] | 28 (6) [18–42] | 26 (7) [15–44) |
| Additional diagnoses, n (%) | 35 (34%) | 20 (30%) | 4 (31%) | 11 (50%) |
| AD(H)D | 26 (26%) | 16 (24%) | 3 (23%) | 7 (32%) |
| Verbal dyspraxia | 6 (6%) | 4 (6%) | 0 (0%) | 2 (9%) |
| Learning disorder | 8 (8%) | 5 (8%) | 0 (0%) | 3 (14%) |
| Other | 10 (10%) | 7 (10%) | 1 (8%) | 2 (9%) |
| Mean total IQ⁎(SD) [Range] | 105 (15) | 105 (15) | 115 (20) | 103 (14) |
| [76–133] | [76–133] | [92–145] | [77–123] | |
| Mean Hollingshead Index (SD) [Range] | 48 (9) [27–65] | 48 (9) [27–65) | 51 (6) [43–63] | 44 (12) [13–61] |
| Belgian / Dutch nationality, n | 69/33 | 41 / 26 | 8/5 | 20/2 |
AD(H)D, Attention Deficit (Hyperactivity) Disorder; N, number; no/s/cASD, group without, with suspected, or with confirmed Autism Spectrum Disorder; SD, Standard Deviation.
One sample t-tests were significant for the total score and all subscales in both the total group (Mean total SRS-2 = 75±18.5) and the subgroups indicating that children with only DCD (Mean total SRS-2 = 67±16.0), suspected ASD (Mean total SRS-2 = 83±15.0), and confirmed ASD (Mean total SRS-2 = 93±12.2), experience more problems in social responsiveness than the normative sample of typically developing children (Mean total SRS-2 = 50±10; all p<0.001). Fig. 1 depicts the distribution of children within the four severity categories based on total SRS-2 scores. Based on the total score, 64% of noASD children were categorized as having mild to severe social responsiveness difficulties. Similarly, mild to severe difficulties in noASD children were found on the subscales ‘social awareness’ (49%), ‘social cognition’ (52%), ‘social communication’ (55%), ‘social motivation’ (54%), and ‘autistic preoccupations’ (72%). Detailed categorization based on sub-scores can be found in Supplementary material.
Comparison between groups
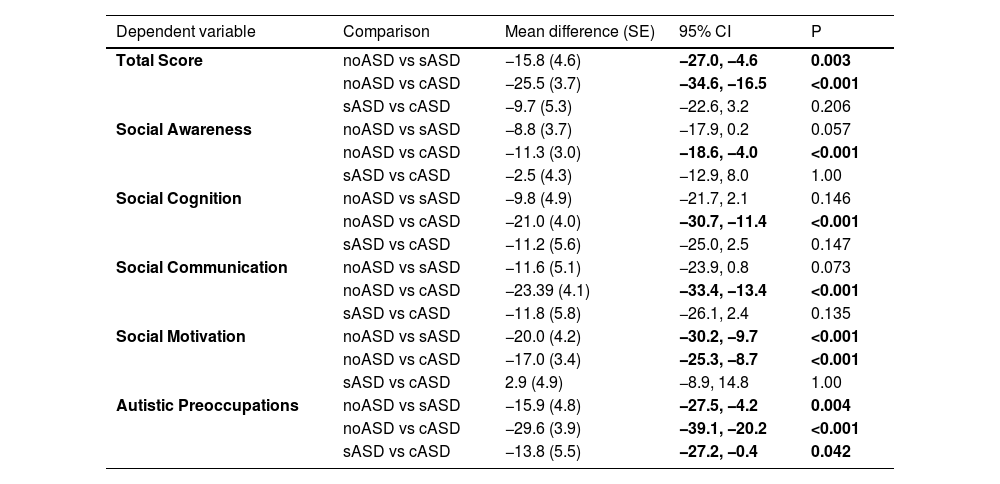
The SRS-2 total score was significantly different between the three groups (p<0.001). Post-hoc analyses yielded significantly higher SRS-2 total scores in the sASD and cASD groups compared to those with noASD (Fig. 2). No significant difference was found between sASD and cASD. The SRS-2 subscale scores demonstrated significant differences among the three groups [p<0.001; Wilk's Λ =0.525; partial η²= 0.275]. Post-hoc analyses revealed significantly higher scores on all subscales in those with cASD compared to noASD (Table 2). Compared to the noASD group, children in the sASD group scored significantly higher on the subscales of social motivation and autistic preoccupations. Compared to those with sASD, cASD children only scored significantly higher on the subscale of autistic preoccupations.
 and p ≤ 0.001(**). The white box denotes the No ASD group (no suspicion or diagnosis of autism spectrum disorder), the gray box the sASD group (suspected autism spectrum disorder), and the black box the cASD group (confirmed diagnosis of autism spectrum disorder). Abbreviations: AP, autistic preoccupations; SA, social awareness; Scog, social cognition; SCom, social communication; SMot, social motivation.")
Mean T-scores and 95% confidence intervals per subgroup for the total SRS-2 score and the five subscales. Significant results are indicated at level p ≤ 0.05(*) and p ≤ 0.001(**). The white box denotes the No ASD group (no suspicion or diagnosis of autism spectrum disorder), the gray box the sASD group (suspected autism spectrum disorder), and the black box the cASD group (confirmed diagnosis of autism spectrum disorder). Abbreviations: AP, autistic preoccupations; SA, social awareness; Scog, social cognition; SCom, social communication; SMot, social motivation.
Comparison between groups using ANOVA (total score) and MANOVA (subscales).
CI, confidence interval; SE, standard error. Significant results with p <0.05 are indicated in bold. No ASD, no suspicion or diagnosis of Autism Spectrum Disorder; sASD, suspected Autism Spectrum Disorder; cASD, confirmed diagnosis of Autism Spectrum Disorder.
DCD-Q scores confirmed the presence of DCD in the total group (mean= 30, SD= 9), noASD (mean 32, SD=10), sASD (mean=28, SD= 6), and cASD (mean= 26, SD= 7). One-way ANOVA yielded a significant difference regarding DCD-Q total scores over the three groups (p = 0.033). Post-hoc Bonferroni revealed that cASD children scored on average 5 points less compared to noASD (p = 0.043).
Association between motor development and social responsivenessPoorer motor performance was moderately related to more deviating total SRS-2 and subscale scores except for the subscale ‘social motivation’ (Table 3). The strongest association indicated that children with more ‘Autistic Preoccupations’ demonstrated lower motor scores. With the exception of the subscale ‘Autistic Preoccupations’ in those with noASD (r=−0.363, p = 0.003), none of the associations remained significant in the separate groups.
Correlation (Pearson coefficient) of DCD-Q total score with SRS-2 total and subscale T-scores.
| r | P | |
|---|---|---|
| Total score | −0.306 | 0.002 |
| Social awareness | −0.232 | 0.019 |
| Social cognition | −0.287 | 0.003 |
| Social communication | −0.260 | 0.008 |
| Social motivation | −0.175 | 0.078 |
| Autistic preoccupations | −0.405 | <0.001 |
Significant results with p <0.05 are indicated in bold.
The results confirm poorer social responsiveness performance in all domains in children with DCD even without co-occurring ASD and suggest a significant association between DCD-Q (motor development) and SRS-2 total scores (social development) and all of its subscales except for ‘social motivation’.
Although children with DCD experienced social difficulties in all domains of the SRS-2, the most prominent alteration was noted in the subscale ‘Autistic Preoccupations’ with respectively 72% of noASD children scoring within the mild to severe category. This subscale also showed the highest correlation with DCD-Q scores and was the only correlation that remained significant in those with noASD. Many of the items included in this subscale tend to overlap with typical characteristics in DCD. Children with DCD are inherently uncoordinated (item 14) and they tend to perform well on certain tasks but do worse on many other tasks (item 49). Additionally, they are often considered “weird” by peers resulting in being bullied (item 29),31 and are reported to move “differently” (item 8).32 Finally these children tend to flounder in planning and organizing their daily life activities which might lead to preferring a clear daily-life structure (item 24; having difficulties with changing routines). Indeed, impaired executive functioning in children with DCD is well-recognized33 and it is very likely that a clear daily-life structure alleviates this organizational load and reduces stress.
About half of the children also had unfavorable scores on other subscales. The difficulties in ‘Social Awareness’ can partly be related to a reduced tendency to follow gaze (item 45; focus on what others look or hear)13 and the problems children with DCD experience with personal hygiene (items 32; good personal hygiene).34 Next, the difficulties in ‘Social Cognition’ confirm poorer emotion recognition (item 15; understand facial expressions)14-16 and sensory modulation issues (item 30 and 42; getting upset in busy situations; hypersensitivity)35 in children with DCD. Lastly, issues with ‘Social Communication’ might relate to an increased tendency to loneliness and exclusion by peers (item 18; difficulties making friends),8 and their difficulties with motor imitation (item 21; being able to imitate others).33 Moreover, they may be linked to the higher prevalence of co-occurring speech-language disorder in this group of children. In this study, only 6% of those in the noASD group had received a diagnosis of verbal dyspraxia, but prevalence for speech-language problems can be as high as 70%.36
Nevertheless, the tiered increase in overall social responsiveness problems between noASD, sASD, and cASD children indicates the presence of children in the ‘grey’ zone of ASD. Similarly, Sumner et al. described more autism-related symptoms in children with DCD than typically developing children.17 As both DCD and ASD symptoms present themselves in a continuum, a binary vision does not represent the reality of clinical practice37 making the diagnosis of co-occurring disorders especially challenging. As many children with DCD clearly seem to experience similar social challenges, they should be able to receive similar support as children with ASD, even without a dual diagnosis. Motor-orientated interventions seem to benefit socio-emotional development in children with DCD, but adequate psychological support might be just as important as motor therapy to boost future quality of life.38-40 Yet, the value of specific psychological support for children with DCD has not been investigated. Similar to our findings in DCD, children with ADHD were also reported to have increased scores on the SRS-2, especially in the subscales ‘Social Communication’ and ‘Social Awareness’.41,42 However, it has been suggested that the specificity of the SRS-2 may not be sufficient in children with previously identified social developmental problems.43 More research is needed regarding the validity of the SRS-2 in children with neurodevelopmental disorders other than ASD.
Despite better average scores compared to sASD and cASD groups, the large ratio of noASD children showing severe social difficulties compared to the norm, urges to question if children with DCD might in fact be underdiagnosed with co-occurring ASD. In the study of Ketcheson et al.44 only 14% of children with ASD who scored at risk for DCD had received a formal diagnosis of DCD.44 Our results suggest that the opposite may also be the case because 64% of noASD children in our study scored within the clinical range on the SRS-2 which is almost double the previously reported 36%.21 This large difference might lie in the investigated sample as we included clinically diagnosed children with a mean age of 10 years compared to children diagnosed with probable DCD based on poor MABC- 2° revision performance of similar age.21 However, in the study of Mikami et al.,20 no social responsiveness difficulties were detected in 5-year-old clinically diagnosed children20 possibly signaling that these difficulties may increase as children age. This is plausible as social skills mediate the emergence of psychosocial problems which in turn, might limit social participation and practice. Yet, in our study, no age-effect was detected.
It is important to acknowledge that 36% of the noASD children demonstrated good social responsiveness. Subtypes of DCD have been proposed previously, describing children with predominant issues regarding self-esteem and peer relations.45 Moreover, scarcity of significant correlations between SRS-2 and DCD-Q scores within noASD, suggests that the social responsiveness difficulties are not just a secondary consequence of the motor problems. Several other features, known to be more prevalent in children with DCD, may add to the occurrence of social difficulties such as speech-language difficulties,46 low self-esteem,45 and poor executive functioning.33 Previously, an association has been described between social responsiveness and motor skills in a total group of 86 children with either ASD, DCD, or typical development, but not in the groups separately.22 This study has similar findings possibly signaling that larger sample sizes are necessary for subgroup analysis.
Limitations and strengthsThe strength of this study is the large binational sample size including participants from both Belgium and the Netherlands, which improves generalizability. By including an sASD group in our analyses, we acknowledge the continuum of neurodevelopmental symptoms, which is consistent with the clinical field. We note that the lack of an objective measurement of social responsiveness and IQ could be a limitation. Additionally, the presence of DCD and ASD was based only on parental report. However, only children who were diagnosed with DCD in multidisciplinary settings were included, increasing the reliability of correct diagnoses. As we recruited a convenience sample, it is possible that especially parents who experienced social challenges in their child completed the questionnaire, possibly inflating the detected differences. The SRS-2 is only one assessment instrument to measure the complex social-communicative construct of social responsiveness. As such, we acknowledge that given the complex dynamics, this study only reports on one specific aspect of social responsiveness.
Implications for clinical practiceThe coinciding difficulties in social responsiveness previously reported in children with ADHD, and now reported in children with DCD, underline the vast heterogeneity in the presence of neurodevelopmental conditions. It further stresses the need for multidisciplinary assessment and, if necessary, psychological support for children with DCD. Given the continuum between DCD and ASD, one should carefully consider the individual needs of every child. Psychologists should be trained to recognize and, most importantly, support individuals with DCD.
ConclusionOverall, these findings support our prediction that, in comparison to a normative sample of typically developing children, social responsiveness difficulties are more common in children with DCD, both with and without suspected or confirmed ASD. These findings further support our theory that children with DCD and suspected or confirmed ASD experience more social responsiveness difficulties than children with only DCD. Lastly, these results confirm the hypothesis of the presence of a significant weak to moderate correlation between motor performance and social responsiveness in children with DCD.
We would like to thank Jorn Ockerman for their help constructing the graphs. This research did not receive any specific grant from funding agencies in the public, commercial, or not-for-profit sectors.


