


The perception of personal barriers to physical activity varies according to the sociodemographic characteristics of individuals.
ObjectiveTo determine the predictors of the perception of barriers to physical activity in the adult population.
MethodA cross-sectional study with 1066 adult women and 1036 adult men. The sociodemographic variables (age, gender, marital status, socioeconomic level, level of education), the perception of barriers that do not allow performance of physical activity (i.e. lack of time, social support, energy, motivation, skill, resources, and fear of injury during practice); and the level of physical activity through the International Physical Activity Questionnaire in its short-form version were evaluated.
ResultsIndividuals from low socioeconomic level (1 and 2) have higher risks of perceiving barriers such as lack of motivation [OR 1.76 (95% CI (1.4–2.1))] and lack of resources [OR 1.37 (95% CI (1.1–1.6))]; individuals with partners did not perceive the lack of social support [OR 0.29 (95% CI (0.2–0.4))] and lack of motivation [OR 0.54 (95% CI (0.4–0.7))] as barriers to physical activity. Individuals with low schooling perceived lack of social support [OR 3.81 (95% CI (3–4.7))], lack of resources [OR 2.78 (95% CI (2.2–3.3))], and fear of injury [OR 2.70 (95% CI (2.2–3.3))] as barrier to physical activity.
ConclusionFactors such as socioeconomic level, marital status, level of education, and self-perception of health are predictors of barriers to physical activity.
Physical inactivity is associated with a higher frequency of chronic non-communicable diseases. According to the World Health Organization, it is recognized as the fourth risk factor for global mortality.1 Despite efforts by national and international organizations to increase physical activity (PA) levels among the population, the prevalence of physical activity is low in developing countries. The percentage of people complying with the recommendations of 150min per week of moderate activity is 31.1% globally.2 In Colombia, this level reaches 57.4%.3 In this sense, it is essential to develop public health interventions,4,5 given that physical activity is influenced by personal or internal factors such as the perception of barriers,6 which can determine people's lifestyles because they act as cognitive restrictions to physical activity.7
Within a sociological approach, perception of barriers is a construct of the intra- and inter-personal levels,4,8 recognized as a significant predictor of PA.7 Other authors consider lack of time (external barrier) and lack of motivation (internal barrier) as the most relevant barriers physical activity.9 The concept of internal or personal and external or environmental barriers has been defined in a number of studies. Internal barriers are related to the personal motivations of individuals, unlike external barriers, which refer to the infrastructure in the neighborhoods and communities.10,11 This interaction of perceived barriers of a personal and social nature is also explained by the social-cognitive theory, which specifies that a set of determinants affects the health-related practices of individuals, including the perception of personal and social facilitators and barriers that hinder or enable healthy behaviors.12,13
Sharifi et al.9 report that motivational internal barriers predominate in developed countries, while the perception of barriers for PA in developing countries is related to environmental factors such as lack of facilities, places, and programs for PA, considered external barriers.
Physical activity is inversely related to the perception of personal and environmental barriers, with this association varying according to the sociodemographic characteristics of individuals.14 Although the perception of barriers is strongly related to PA during leisure time rather than during commuting and home and work activities,5 this perception varies according to gender.
A study conducted by Arango et al.15 found that the relevant barriers to physical activity were lack of motivation and time (70% and 46.2%, respectively), especially in women and overweight participants.15 Therefore, the results obtained in this study may become a tool for physical therapists to define the relevant aspects for the organization, design, and implementation of collective intervention programs, previously identifying the health model that guarantees the integration of practical strategies and focuses on promoting health in order to encourage physical activity in the communities. Therefore the aim of this study was to determine the predictors of the perception of barriers for physical activity in the adult population.
MethodStudy designThis was a cross-sectional study with 1066 women and 1036 men from Barranquilla, Colombia.
Population and sampleThe sampling was probabilistic, random, and multi-staged, taking into account the following selection criteria: people between the ages of 18 and 69, who are residents of the city of Barranquilla, Colombia, and who provided their informed consent. The five locations considered as primary units for sampling in the district of Barranquilla were Riomar, North-Historical Center, Southwest, Southeast, and Metropolitan; later, the neighborhoods were considered as second stage units, the streets as third stage units, the housing conglomerates as fourth stage units, and finally any man or woman between 18 and 69 years of age as the fifth stage units.
Data collectionPrior to data collection, all study subjects signed the informed consent form. To collect the data of this study, a survey was applied with questions about sociodemographic variables (age, gender, socioeconomic level, marital status, and educational level), self-perception of the health status, and barriers to PA, offering the following options: lack of time, social support, energy, motivation, skills, resources, and fear of injury. For each barrier, the participants could answer yes or no.
The level of PA was obtained through the short version of the International Physical Activity Questionnaire (IPAQ). The IPAQ permitted categorizing the subjects by compliance or non-compliance to the recommendations for physical activity with health benefits, consisting of 150min per week of moderate intensity or 75min per week of vigorous intensity.16
In its development stage, the present study had the participation of health professionals who work as “Health Walkers” in the Chronic Non-Communicable Diseases Program, a part of the epidemiological surveillance team from the District Health Secretary's public health network. These “Health Walkers” facilitated the physical therapists’ access to the neighborhoods; the application of the assessment instruments was carried out by the physical therapists participating in the research study.
Data analysisThe model was built to determine the factors associated with the barriers of physical activity. For this model, we conducted a multivariate logistic regression analysis and the results were presented as odds ratio (OR) with 95% confidence intervals for each perceived barrier variable investigated that had statistical significance p<0.05.
In the model, the variable representing gender took a value (1 for women and 0 for men), and likewise for marital status (1 for with partner and 0 for without partner), educational level (1 for primary/secondary education and higher education and 0 for other cases), self-perception of health (1 for poor and regular and 0 for other cases), PA levels (1 for non-compliant with recommendations and 0 for compliant). The values for each variable related to perception of barriers (i.e., lack of time, social support, energy, motivation, skill, resources, and fear of injury) were 0 for “no” and 1 for “yes”. The values for socioeconomic level were 1, 2, and 3 for low-middle level and 4, 5, and 6 for high.
The analysis estimated the probability of an individual perceiving different barriers according to the characteristics presented in the study. Analysis of the information was carried out using the software SPSS statistical package (version 18.0, license number 10138194). This study was approved by the Ethics Committee of Universidad Simón Bolívar of Barranquilla, Colombia (Approval Number 00023).
ResultsTable 1 shows the sociodemographic characteristics of individuals participating in the study. A higher frequency was found for people from the group of single women from low socioeconomic levels and of those with only primary or secondary education. With respect to self-perception of health, 77.4% of individuals who participated perceived their health to be good or excellent. The mean age was 35.8 years (SD=14.3).
Sociodemographic characteristics of the participants.
| Frequency | Percentage | |
|---|---|---|
| Gender | ||
| Female | 1067 | 50.7 |
| Male | 1036 | 49.3 |
| Marital status | ||
| Single or living without a partner | 1099 | 53.3 |
| Married or living with a partner | 1004 | 47.7 |
| Socioeconomic level | ||
| Low (levels 1 and 2) | 1281 | 60.9 |
| Middle (level 3) | 383 | 18.2 |
| High (levels 4, 5 and 6) | 439 | 20.9 |
| Education level | ||
| Primary/secondary (complete or incomplete) | 1409 | 67 |
| Higher education | 694 | 33 |
| Self-perception of health | ||
| Very good | 364 | 17.3 |
| Good | 1263 | 60.1 |
| Fair | 439 | 20.9 |
| Poor | 37 | 1.7 |
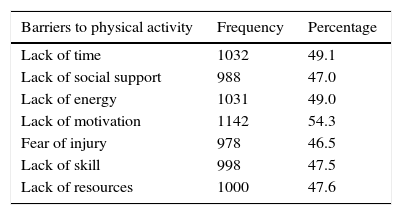
According to the data reported in Table 2, the most common barrier for PA was lack of motivation, followed by lack of time. The least frequent barrier for PA was fear of injury.
A higher percentage (60%) of individuals comply with the recommendations for PA to obtain health benefits.
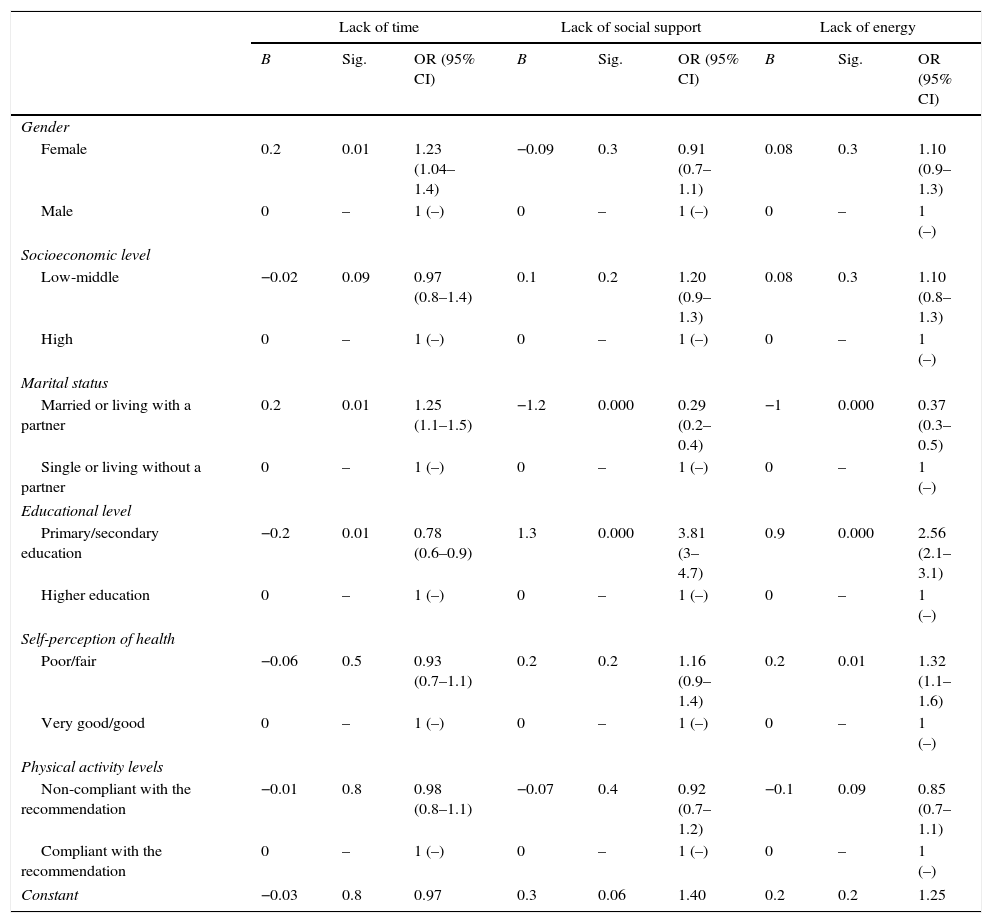
Table 3 shows that women have a higher risk of perceiving lack of time as a barrier to conducting PA [OR 1.23 (95% CI (1.04–1.4))]. Similarly, Table 4 shows people from low socioeconomic levels have a higher risk of perceiving lack of motivation [OR 1.76 (95% CI (1.4–2.1))] and lack of resources [OR 1.37 (95% CI (1.1–1.6))] as barriers to physical activity.
Factors associated with the perception of barriers to physical activity: lack of time, lack of social support, and lack of energy.
| Lack of time | Lack of social support | Lack of energy | |||||||
|---|---|---|---|---|---|---|---|---|---|
| B | Sig. | OR (95% CI) | B | Sig. | OR (95% CI) | B | Sig. | OR (95% CI) | |
| Gender | |||||||||
| Female | 0.2 | 0.01 | 1.23 (1.04–1.4) | −0.09 | 0.3 | 0.91 (0.7–1.1) | 0.08 | 0.3 | 1.10 (0.9–1.3) |
| Male | 0 | – | 1 (–) | 0 | – | 1 (–) | 0 | – | 1 (–) |
| Socioeconomic level | |||||||||
| Low-middle | −0.02 | 0.09 | 0.97 (0.8–1.4) | 0.1 | 0.2 | 1.20 (0.9–1.3) | 0.08 | 0.3 | 1.10 (0.8–1.3) |
| High | 0 | – | 1 (–) | 0 | – | 1 (–) | 0 | – | 1 (–) |
| Marital status | |||||||||
| Married or living with a partner | 0.2 | 0.01 | 1.25 (1.1–1.5) | −1.2 | 0.000 | 0.29 (0.2–0.4) | −1 | 0.000 | 0.37 (0.3–0.5) |
| Single or living without a partner | 0 | – | 1 (–) | 0 | – | 1 (–) | 0 | – | 1 (–) |
| Educational level | |||||||||
| Primary/secondary education | −0.2 | 0.01 | 0.78 (0.6–0.9) | 1.3 | 0.000 | 3.81 (3–4.7) | 0.9 | 0.000 | 2.56 (2.1–3.1) |
| Higher education | 0 | – | 1 (–) | 0 | – | 1 (–) | 0 | – | 1 (–) |
| Self-perception of health | |||||||||
| Poor/fair | −0.06 | 0.5 | 0.93 (0.7–1.1) | 0.2 | 0.2 | 1.16 (0.9–1.4) | 0.2 | 0.01 | 1.32 (1.1–1.6) |
| Very good/good | 0 | – | 1 (–) | 0 | – | 1 (–) | 0 | – | 1 (–) |
| Physical activity levels | |||||||||
| Non-compliant with the recommendation | −0.01 | 0.8 | 0.98 (0.8–1.1) | −0.07 | 0.4 | 0.92 (0.7–1.2) | −0.1 | 0.09 | 0.85 (0.7–1.1) |
| Compliant with the recommendation | 0 | – | 1 (–) | 0 | – | 1 (–) | 0 | – | 1 (–) |
| Constant | −0.03 | 0.8 | 0.97 | 0.3 | 0.06 | 1.40 | 0.2 | 0.2 | 1.25 |
Factors associated with the perception of barriers to physical activity: lack of motivation, skill, resources, and fear of injury.
| Lack of motivation | Fear of injury | Lack of skill | Lack of resources | |||||||||
|---|---|---|---|---|---|---|---|---|---|---|---|---|
| B | Sig. | OR (95% CI) | B | Sig. | OR (95% CI) | B | Sig. | OR 95% CI | B | Sig. | OR 95% CI | |
| Gender | ||||||||||||
| Female | 0.00 | 0.9 | 0.90 (0.8–1.1) | −0.07 | 0.4 | 0.93 (0.7–1.1) | −0.03 | 0.8 | 0.98 (0.8–1.1) | 0.1 | 0.1 | 1.14 (0.9–1.3) |
| Male | 0 | – | 1 (–) | 0 | – | 1 (–) | 0 | – | 1 (–) | 0 | – | 1 (–) |
| Socio-economic level | ||||||||||||
| Low-middle | 0.5 | 0.00 | 1.76 (1.4–2.1) | 0.02 | 0.7 | 1.10 (0.8–1.2) | 0.04 | 0.6 | 1.10 (0.8–1.2) | 0.3 | 0.00 | 1.37 (1.1–1.6) |
| High | 0 | – | 1 (–) | 0 | – | 1 (–) | 0 | – | 1 (–) | 0 | – | 1 (–) |
| Marital status | ||||||||||||
| Married or living with a partner | −0.6 | 0.00 | 0.54 (0.4–0.7) | −0.8 | 0.00 | 0.44 (0.3–0.5) | −1 | 0.00 | 0.35 (0.2–0.4) | −0.9 | 0.00 | 0.38 (0.2–0.4) |
| Single or living without a partner | 0 | – | 1 (–) | 0 | – | 1 (–) | 0 | – | 1 (–) | 0 | – | 1 (–) |
| Educational level | ||||||||||||
| Primary/secondary education | 0.3 | 0.00 | 1.38 (1.2–1.7) | 0.9 | 0.00 | 2.70 (2.2–3.3) | 1.1 | 0.00 | 3.27 (2.6–4.0) | 1 | 0.00 | 2.78 (2.2–3.3) |
| Higher education | 0 | – | 1 (–) | 0 | – | 1 (–) | 0 | – | 1 (–) | 0 | – | 1 (–) |
| Self-perception of health | ||||||||||||
| Poor/fair | 0.09 | 0.4 | 1.10 (0.8–1.3) | 0.1 | 0.1 | 1.16 (0.9–1.4) | 0.07 | 0.5 | 1.10 (0.8–1.3) | 0.2 | 0.01 | 1.32 (1.1–1.6) |
| Very good/good | 0 | – | 1 (–) | 0 | – | 1 (–) | 0 | – | 1 (–) | 0 | – | 1 (–) |
| Physical activity levels | ||||||||||||
| Non-compliant with recommendation | 0.1 | 0.09 | 1.16 (0.9–1.3) | −0.1 | 0.2 | 0.89 (0.7–1.1) | −0.1 | 0.1 | 0.85 (0.7–1) | −0.2 | 0.02 | 0.80 (0.6–0.9) |
| Compliant with recommendation | 0 | – | 1 (–) | 0 | – | 1 (–) | 0 | – | 1 (–) | 0 | – | 1 (–) |
| Constant | −0.5 | 0.00 | 0.59 | 0.3 | 0.06 | 1.40 | 0.4 | 0.01 | 1.57 | 0.2 | 0.2 | 1.24 |
Regarding marital status, individuals with partners did not perceive the lack of social support [OR 0.29 (95% CI (0.2–0.4))] and lack of motivation [OR 0.54 (95% CI (0.4–0.7))], as barriers to PA. However, being single increases the risk of perceiving lack of time as a barrier to being physically active [OR 1.31 (95% CI (1.1–1.5))].
For the participants who had primary/secondary education, lack of social support [OR 3.81 (95% CI (3–4.7))], lack of resources [OR 2.78 (95% CI (2.2–3.3))], and fear of injury [OR 2.70 (95% CI (2.2–3.3))] were observed as barriers to PA, while lack of time was not a barrier to PA [OR 0.78 (95% CI (0.6–0.9))].
In addition, for individuals with poor or regular self-perception of health, lack of resources and lack of energy [OR 1.32 (95% CI (1.1–1.6))] were seen as barriers to PA. Finally, for the group who comply with the recommendations for PA, lack of social support, lack of energy, fear of injury, lack of skill, and lack of resources did not represent barriers to PA.
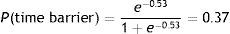
Tables 3 and 4 show the beta coefficients of the variables that were included in the logistics regression model. For the time barrier, the equation of the adjusted model is:
whereThe regression equation of the multivariate model for female (=1), socioeconomic level (=1), with a partner (=1), without higher education (=1), poor and regular self-perception of health (=1) and non-compliance with PA recommendations (=1), is:Discussion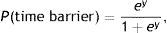


Through physical activity, it is possible to reach a balance between physical and mental health.10 Our findings show that people from socioeconomic strata 1 and 2 are at higher risk of perceiving lack of motivation and lack of resources as barriers, while individuals with partners did not perceive lack of social support and lack of motivation as barriers to PA and individuals with low education perceived lack of social support, lack of resources, and fear of injury as barriers.
Based on these results, it is possible to infer that lack of motivation and time are identified as the most common barriers to PA in the adults of Barranquilla. This data coincides with that reported by Sharifi et al.,9 whose findings demonstrated that lack of time and lack of motivation were the most important external and internal barriers, respectively, to PA in a group of obese and overweight women. Being an adult from a low socioeconomic level in the city is the risk factor most strongly related with the perceived barriers of lack of motivation and lack of resources. Similarly Ibrahim et al.17 report that individuals with lower economic income perceive greater personal barriers, like not having extra energy to exercise after work, along with limited talent and self-discipline for PA, among others.
In this study, the participants recognized lack of resources as a barrier to being physically active. Lack of information on the different domains of PA may also lead people to overlook their homes, workplaces, and neighborhoods as suitable settings for PA without considerable costs. In this sense, Bouma et al.18 recommend counseling on the perception of barriers including strategies such as PA knowledge and experience and increased intrinsic motivation, which is essential to achieving long-term positive responses.
In the study by Moore et al.,19 married individuals showed higher PA levels than those who were single. Their results agree with those of the present study, in which the perception of barriers was lower, thus increasing the possibility of being more physically active. Although the findings are diverse, having a partner is associated with diminished PA in young women, and widowhood and divorce tend to reduce it in men. Transitions in interpersonal relationships also have positive and negative effects on PA with health benefits.20
The percentage of adults in Barranquilla who comply with the recommendations of 150min per week of moderate activity exceeds 50% of the population, a value similar to the national average in Colombia (ENSIN 2010), surpassing the global average.3 Although in this study the most active individuals perceive fewer barriers to PA (except for lack of resources), other studies21 have found an inverse relation between being physically active and the perception of lack of time, explaining that the priorities of inactive people are different in the use of time.22
Regarding the prediction model, it must be highlighted how the interrelation of different variables and associations is statistically significant, with agreement among values of barriers and the perception of PA. It could be established that the factors that predict the perception of barriers to PA are mainly marital status and educational level because of their relationship with behaviors that promote health.23
Likewise, other authors24 propose that the main barriers related to social environments are lack of time, not knowing where to exercise, and high prices, etc. In the study by Serra Puyal et al.,25 the principal barrier to PA was lack of time, as presented in this study, and it corresponds to that described by Herazo et al.26 and Pinillos et al.27
The subjective measurement of the barriers to PA places a limitation on the current research against other studies using objective methods to identify them. Thus, future research is recommended to address the issue of barriers to other approaches.
It is imperative in the city to develop greater social support for PA through social support to be provided by government and private institutions to improve access to adequate spaces or equipment that facilitate active lifestyles, as well as safe physical and social environments. In this regard, future research should include projects in which physical therapists design and implement health interventions to fit the characteristics of the population, allowing them to overcome barriers to PA. These strategies will increase their confidence and motivate them to exercise according to global recommendations.
Conflicts of interestThe authors declare no conflicts of interest.
The study was funded by Universidad Simón Bolívar in Barranquilla and by the Health Department of the District of Barranquilla.


