


Cardiopulmonary exercise testing is the main tool assessing cardiorespiratory fitness. However, cardiopulmonary exercise testing devices are expensive and often cannot be used.
ObjectiveThe present study sought to develop cardiopulmonary exercise testing equations for estimating maximum oxygen uptake from ergometric testing combined with ventilometry.
Methods181 volunteers of both sexes were submitted to cardiopulmonary exercise testing on treadmill using an incremental protocol. Volunteers were randomized into two groups: regression group: composed of 68 women with age 24.7±6.0 years and 54 men aged 21.5±3.9 years; and a cross-validation group composed of 29 women with mean age of 23.8±4.7 years and 30 men with a mean age of 23.1±4.4 years. The estimating equations were developed using multiple stepwise linear regressions; comparison of means was done using a t test and reliability assessed by Cronbach's alpha.
Results8 independent variables exhibited a significant result for estimating VO2max: minute ventilation (E) at second ventilatory threshold (VT-II): (E _VT-II); heart rate at VT-II (HR_VT-II); body mass (BM); body mass index (BMI); fat percentage (F%); age; sex; velocity at VT-II (Vel_VT-II); test time of VT-II (T_VT-II) and final test velocity (Velfinal). Two equations presented more accurate results; for active subjects: Equation2 = 33.08 + 2.41*(Velfinal) - 0.32*(F%) + 0.40*(VE_VT-II) - 0.26*(BM) - 0.09*(HR_VT-II); for sedentary subjects: Equation3 for = 54.65 + 1.37*(T_VT-II) + 8.24*(sex) - 1.26*(BMI) + 0.37*(VE_VT-II) - 0.12*(HR_VT-II).
ConclusionThe present study demonstrated that the use of parameters collected during maximal ergometric test combined with ventilometry, improved the accuracy of equations for estimating maximum oxygen uptake.
Cardiorespiratory fitness is an important predictor of morbidity/mortality1–3 in addition to influencing aerobic performance. Cardiorespiratory fitness has been assessed by maximum oxygen uptake ( V˙ O2max) during cardiorespiratory exercise testing (CPET).4 However, CPET is not always available, and alternative tools need to be used. The ergometric test has been used as a suitable tool for predicting V˙ O2max. 5 However, many limitations have been reported.6,7
The prediction of V˙ O2max using the ergometric test may exhibit significant limitations since the percentage of error can be as high as 41%.8 This is due to the tendency to under- or overestimate V˙ O2max.1,3,9 This problem may be related to the type of ergometer, protocol and/or equation utilized to estimate V˙ O2max.5,6
Error is reduced by ventilatory-expired gas analysis during the CPET.10 The assessment of minute ventilation (V˙ E) is another way of improving exercise test accuracy for estimating V˙ O2max, in which ventilatory-expired gas analysis is not available.11 Neder and Stein11 demonstrated that the addition of ventilometry (i.e., V˙ E assessment) during the ergometric test improved the V˙ O2max estimates Viewing the V˙ E × time plot, it is possible to determine both the first and second ventilatory thresholds (VT-I and VT-II, respectively).12 It has been shown that the use of some parameters assessed in the VT-II can improve the accuracy of V˙ O2max predictive equations.2,7,11
Our study sought to develop equations for the estimation of V˙ O2max using parameters from VT-II and maximum effort. Our hypothesis is that the use of ventilometry can improve the accuracy of V˙ O2max estimation.
MethodsThis study was approved by the Ethics Committee of the Catholic University of Brasília (UCB), Brasília, DF, Brazil, protocol 045/2005. This is a cross-sectional study with convenience sampling drawn from a database of 228 subjects; after screening, 47 subjects were excluded because they did not meet the eligibility criteria. The final sample included one hundred and eighty-one subjects (96 women), all healthy, aged 18–36 years.
The subjects were randomized into two groups using the randomization function from the statistical software package SPSS version 19 (IBM, Chicago, Illinois) as follows: a) regression group (RG), consisting of 68 women and 54 men and b) cross-validation group (CVG), composed of 29 women and 30 men (Fig. 1). The RG was used to construct the estimation equations from multiple linear regression. The CVG was determinate for analyzing the validity in the estimation equations. Therefore, assumptions by Kohavi13 were followed regarding cross-validation and bootstrap for accuracy estimation and model selection. Thus, the CVG sample size was defined following the assumptions described by Mourão,14 which demonstrated that thirty patients could favor a normal distribution curve.

Initially, all the subjects were informed of the study aims, as well as the possible risks and benefits of the experiment. Next, subjects were provided with informed consent and underwent clinical examination and rest electrocardiogram (ECG); if a problem was identified, the individual was excluded from the study.
All subjects were submitted to the following anthropometric measurements: (a) body mass, obtained on a digital scale (Filizola®, São Paulo, Brazil), accurate up to 100 g; (b) height using a stadiometer (Seca—Country Technology® 67034, Benson Avenue—CA, USA), with the scale set to centimeters. The Jackson and Pollock15 protocol was used to estimate body density in men and the three-point skinfold method, as described by Jackson et al.,16 was used in women. Body fat was estimated using the Sire protocol.17
Incremental degree CPET protocolAn incremental degree CPET protocol was conducted using the Super-ATL® treadmill (Inbramed, Porto Alegre—Brazil) until the maximal effort (respiratory coefficient ≥1.1) as recommended by ATS/ERS CPET.18 Every incremental degree had a duration of 1 min. The initial velocity was 4 km/h with 0% incline. The velocity and inclination were increased every minute by 1 km/h and 0.5%, respectively. The maximal velocity was 16 km/h and the maximal inclination was 6%. This was the standard protocol in our laboratory that was later published.19 This protocol demonstrated that these adjustments could better fit a maximal test of 8–12 min in healthy subjects as has been suggested by the ATS statement.18
Ventilatory-expired gas analysis was obtained using a VO2000® gas analyzer (Aerosport Medgraphics, Saint Paul, Minnesota, USA), with gas samples collected every 10 s. The gas analyzer was calibrated before the tests with a known gas: 17% oxygen, 5% carbon dioxide gas and nitrogen balance. Heart rate was recorded in CM5 derivation, using a digital electrocardiogram (Micromed, Brasilia, Brazil). The treadmill, electrocardiogram and gas analyzer were linked to the Ergo-PC Elite® software (Micromed, Brasilia, Brazil).
VT-II was determined after CPET, considering it as a point for determining the sharp increase of 8 l/min in V˙ E, adopting the following parameters as tie-break criteria: (a) exponential increase in ventilatory equivalent for oxygen (VE/VO2) with stabilization or rise in ventilatory equivalent for carbon dioxide (VE/VCO2)11; and (b) decline in expired fraction carbon dioxide (FeCO2).12,20 The VT-II point was established by another proficient exercise physiologist (FPB).
The following statistical analysis were applied for the development and cross-validation of the estimating equations: (a) analysis of data distribution using the Kolmogorov–Smirnov test and Q-Q normality plots.18 During the application of the statistical analysis all theoretical presuppositions were reached: normality, linearity, homoscedasticity and independence of variables; (b) multiple stepwise linear regression using the method and independent variables: “forward”21; (c) comparison between measured and estimated V˙ O2max using the equations developed by the paired t-test; (d) Pearson’s correlation; (f) analysis of individual residual scores using the Bland & Altman method22 and standard error of the estimate (SEE) of 5 ml/kg−1 min−1 as well as reliability analysis using Cronbach’s alpha. We used this degree of SEE based on the criterion to accept equation validity for estimating V˙ O2max according to recommendations by Jette et al.23 and Gibson et al.24 The significance level adopted was p < 0.05. The results were presented using measures of central tendency and dispersion, mean and standard deviation (±SD). Statistical analyses were conducted using the statistical software package SPSS version 19 (IBM, Chicago, Illinois).
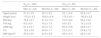
ResultsOne hundred and twenty-two patients completed the full protocol (more details in Fig. 1). The mean velocity achieved for men was of 14.4 ± 1.5 km/h with an incline of 3.4 ± 0.8%. Women achieved a mean velocity of 10.7 ± 1.4 km/h with an incline of 1.8 ± 0.3%. The average time of the CPET exercise phase was 8 ± 3 min. The anthropometric variables demonstrated heterogeneity between men and women in the RG and CVG (Table 1).
Anthropometric characteristics of young individuals aged 18–36 years submitted to the cardiopulmonary exercise testing on treadmill.
| RG (n = 122) | CVG (n = 59) | |||
|---|---|---|---|---|
| Men (n = 54) | Women (n = 68) | Men (n = 30) | Women (n = 29) | |
| Aged (years) | 21.5 ± 3.9 | 24.7 ± 6.0 | 23.1 ± 4.4 | 23.8 ± 4.7 |
| Height (cm) | 175.2 ± 6.2 | 162.6 ± 6.8 | 175.0 ± 6.1 | 162.6 ± 5.5 |
| BM (kg) | 70.6 ± 8.7 | 61.0 ± 13.1 | 70.5 ± 8.4 | 59.4 ± 9.2 |
| FM (kg) | 8.5 ± 6.0 | 16.2 ± 7.5 | 9.9 ± 5.5 | 15.2 ± 5.9 |
| LBM (kg) | 61.9 ± 8.7 | 45.2 ± 7.2 | 60.4 ± 5.8 | 44.8 ± 4.7 |
| F% | 10.3 ± 4.9 | 24.8 ± 7.7 | 12.3 ± 5.1 | 23.8 ± 7.2 |
| BMI (kg/m2) | 23.0 ± 2.5 | 22.9 ± 3.9 | 23.0 ± 2.3 | 22.5 ± 3.4 |
Data are expressed as mean ± standard deviation.
RG, regression group; CVG, cross-validation group, BM: body mass; FM, fat mass; LBM, lean body mass; F%, fat percentage; BMI, body mass index.
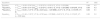
Statistical data analysis confirmed the hypothesis that the V˙ O2max of 122 subjects can be predicted using multiple linear regression. Straight lines were drawn from the dependent variable V˙ O2max, measured by the CPET, using maximal and submaximal exercise ergometric and physiological parameters (Table 2).
Estimating equations of maximum oxygen uptake for healthy individuals (n = 122) during cardiopulmonary testing, using the treadmill.
| Equations | R2 | SEE | |
|---|---|---|---|
| Equation1 | V˙O2max = 16.29 + 2.54*(Velfinal) – 0.32*(F%) + 0.35*(V˙E_VT-II) – 0.23*(BM) | 0.88 | 4.5 |
| #Equation2 | V˙O2max = 33.08 + 2.41*(Velfinal) – 0.32*(F%) + 0.40*(V˙E_VT-II) – 0.26*(BM) – 0.09*(HR_VT-II) | 0.89 | 4.3 |
| #Equation3 | V˙O2max = 54.65 + 1.37*(T_VT-II) + 8.24*(sex) – 1.26*(BMI) + 0.37*(V˙E_VT-II) – 0.12*(HR_VT-II) | 0.84 | 5.1 |
| Equation4 | V˙O2max = 51.46 + 1.33*(T_VT-II) + 9.78*(sex) – 0.5*(BMI) + 0.42*(V˙E_VT-II) – 0.13*(HR_VT-II) – 0.26*(BM) | 0.85 | 5.0 |
V˙ O2max, maximum oxygen uptake in ml/kg min−1; Sex, (1) woman and (2) men; BM, body mass in kilograms (kg); F%, percentage of fat by the three folds protocol described by Jackson, et al.16 and Jackson and Pollock15; Velfinal, final CPET velocity (km/h); V˙ E_VT-II, minute ventilation at the second ventilatory threshold (L); Vel_VT-II, velocity in the second ventilatory threshold (km/h); HR_VT-II: heart rate (bpm) at the secondary ventilatory threshold; T-VT-II, test time in the second ventilatory threshold. SEE, standard error of the estimate.
# Equations 2 and 3 presented better results for estimating V˙ O2max in active and sedentary subjects, respectively.
The independent variables that exhibited a significant collinearity coefficient (<1.0), in the estimated linear regression lines used in the stepwise method were: minute ventilation at VT-II ( V˙ E_VT-II); heart rate at VT-II (HR_VT-II); body mass (BM); body mass index (BMI); fat percentage (F%); age; sex (women = 1, men = 2); velocity at VT-II (Vel_VT-II); test time of VT-II (T_VT-II) and final test velocity (Velfinal). The other variables (height and total test duration) exhibited a collinearity coefficient of 1.0, and were automatically excluded from the construction of the linear regression lines. The forward selection method allowed the construction of eleven models using multiple linear regression, which yielded significant results, demonstrating good predicted V˙ O2max, with an R2 ranging from 0.76 to 0.89 for all the equations. However, the comparison of the estimated and measured V˙ O2max (RG vs. CVG, respectively), revealed that seven equations displayed statistically significant differences (p < 0.05). Next, analysis of residual scores confirmed their tendency to over or underestimated the measured V˙ O2max. Table 2 showed four equations that met the established criteria using the independent variables for a calculated p = 0.01. However, the equations 2 and 3 presented higher accuracy, lower SEE and lower residual dispersion (Figs. 2 and 3).
 Bland–Altman plot results of residual scores in the estimated V˙ O2max determined by equation 2 and measured V˙ O2max in the cross-validation group. (B) Regression line and confidence interval of 95% of estimated V˙ O2max determined by equation 2 and measured V˙ O2max in the cross-validation group. (C) Bland–Altman plot results of residual scores in the estimated V˙ O2max determined by equation 3 and measured V˙ O2max in the cross-validation group. (D) Regression line and confidence interval of 95% of estimated V˙ O2max determined by equation 3 and measured V˙ O2max in the cross-validation group. V˙O2max: maximum oxygen uptake.")
Bland–Altman and regression line for estimated V˙ O2max and measured V˙ O2max in the cross-validation group. (A) Bland–Altman plot results of residual scores in the estimated V˙ O2max determined by equation 2 and measured V˙ O2max in the cross-validation group. (B) Regression line and confidence interval of 95% of estimated V˙ O2max determined by equation 2 and measured V˙ O2max in the cross-validation group. (C) Bland–Altman plot results of residual scores in the estimated V˙ O2max determined by equation 3 and measured V˙ O2max in the cross-validation group. (D) Regression line and confidence interval of 95% of estimated V˙ O2max determined by equation 3 and measured V˙ O2max in the cross-validation group. V˙O2max: maximum oxygen uptake.
 Values of V˙ O2max measured and estimated in the regression group for men. (B) Values of V˙ O2max measured and estimated in the cross-validation group for men. (C) Values of V˙ O2max measured and estimated in the regression group for women. (D) Values of V˙ O2max measured and estimated in the cross-validation group for women. V˙O2max: maximum oxygen uptake.")
Maximum oxygen uptake measured and estimated for young healthy subjects. (A) Values of V˙ O2max measured and estimated in the regression group for men. (B) Values of V˙ O2max measured and estimated in the cross-validation group for men. (C) Values of V˙ O2max measured and estimated in the regression group for women. (D) Values of V˙ O2max measured and estimated in the cross-validation group for women. V˙O2max: maximum oxygen uptake.
The correlations for the validated equations were statistically significant (p < 0.01), and their respective values were obtained (r = 0.84, 0.83, 0.80, 0.80). The multiple linear regression lines for the validated equations made it possible to account for approximately 74% of V˙ O2max, as can be observed by the readjusted values of R2 = 0.87, 0.88, 0.84, and 0.85, for equations 1, 2, 3 and 4, respectively (Table 2). Data from both sexes were analyzed together and separately. Likewise, this was performed in the CVG. From the stepwise method, sex demonstrated a colinearity equal to 1 for equations 1 and 2 in relation to other independent variables. Thus, sex was not used in those equations. However, for equations 3 and 4, sex demonstrated a statistical significance for the regression line construction. Therefore, sex was used as the independent variable in the equations 3 and 4. The reliability of equations 3 and 4 for men and women showed a Cronbach’s alpha of 0.90 and 0.88, respectively.
The results of residual scores underestimated the sample by 13.5% and overestimated it by 10.8%. These results were determined using SEE of 5 ml/kg−1 min−1 according previous recommendations.23,24 However, the residual scores of equations 2 and 3 showed less variation in the estimation, overestimating them by 9.8% and 10.6% and underestimating by 13.1% and 10.6%, respectively (Fig. 2). Equation(2) exhibited lower residual score variations in the Bland–Altman plot for both RG and CVG when analyzed with measured V˙ O2max (Fig. 3). The measured and estimated V˙ O2max values of the 4 equations in RG and CVG are presented in Table 2.
The SEE demonstrates that equations 2 and 3 exhibited consistent results for the estimation of V˙ O2max for active and sedentary subjects, respectively, and the 4 models obtained a mean SEE of 4.9 ml/kg−1 min−1 for the CVG.
DiscussionThe present study demonstrated that it was possible to estimate V˙ O2max using ventilometry with excellent reliability. The present results showed that independent variables used in the construction of the multiple linear regression line can explain approximately 80% of the variability of the dependent variable V˙ O2max. It was demonstrated that there were eight major variables to estimate V˙ O2max: Velfinal, T_VT-II, VE_VT-II, BMI, Sex; BM; F% and HR_VT-II.
Typically, studies have established a linear relationship between imposed workload and heart rate to estimate V˙ O2max.25–28 Other authors have described a relationship between the exercise test’s velocity and time for the estimation of V˙ O2max.29–31 However, the proposed equations in the present study demonstrated that V˙ E also provides a relevant contribution for estimating V˙ O2max.
Roy et al.29 compared V˙ O2max estimation by means of the StairMaster test with the V˙ O2max measured by CPET using the Bruce protocol in 10 trained and 10 untrained female students, with a mean age of 21 ± 1 years. Their findings showed that there was no difference between estimated and measured V˙ O2max when all subjects were analyzed together. However, a significant difference was found in the untrained group when it was analyzed separately, with SEE = 6.7 ml/kg−1 min−1. In conclusion, the authors reported that the StairMaster test was accurate for trained individuals, but tends to significantly underestimate untrained individuals, by a mean of 7 ml/kg−1 min−1. Almeida et al.,8 demonstrated a similar impact of the level of physical fitness for the accuracy of the estimation equation.8 Corroborating these results, it was observed in the present study that two distinct equations were necessary to estimate V˙ O2max for trained and untrained subjects.8 The currently proposed equations showed a lower SEE than the Roy et al.,29 average of 4.9 ml/kg min−1.
Fudge et al.30 reported similar results for V˙ O2max estimation to what was found in the present study. These authors estimated V˙ O2max from exercise testing using an accelerometer in 16 trained men, with a mean age of 23 ± 3 years. The incremental test protocol had a one-minute interval between the stages, similar to the protocol used in the present study. The equations proposed by Fudge et al.30 showed a SEE between 1.9 and 6.4 ml/kg min−1, and an R2 between 0.42 and 0.85. Their findings corroborate with the results from the present study and with other studies estimating V˙ O2max.29,30,32 Although the aforementioned studies29,30 had used different ergometers, it becomes clear that the anthropometric and ergometric variables are a common point in the equations.
The current study showed that the addition of physiological ( V˙ E and HR) and anthropometric (BM, F% and BMI) parameters increased the accuracy of the presented equations. Peterson et al.6 investigated the accuracy of the American College of Sports Medicine (ACMS) equation in 171 subjects aged 65–90 years. Their study demonstrated that the ACMS equation overestimated V˙ O2max. These authors described that age, sex, BMI and physical fitness level, added to treadmill settings, better account for the curve of oxygen uptake by the straight multiple linear regression.6 This corroborates with the present results, which the combination of physiological, anthropometric and treadmill variables better account for the curve of oxygen uptake in healthy young individuals.
An important study carried out by Almeida et al.8 aimed to determine the estimation equation of V˙ O2max for the Brazilian population. These authors have developed an equation using, sex, age, BMI and physical activity, and found an R2 of 0.68 and p < 0.01. The current study demonstrated that the addition of more parameters can improve the R2 regression coefficient to R2 > 0.80 for a SEE < 5 ml/kg min−1.
The advantage of the present equations is demonstrated from the higher levels of validity for estimating V˙ O2max when adding of ventilometry. The study limitations are related to external validation for the daily application, that is, type of ergometer, since the equations can only be used for a treadmill test. Moreover, devices for measuring V˙ E are not always available.11 Another point is that the present equations assessed a narrow range of age group (young adults) and it cannot be extrapolated to elderly subjects.
ConclusionsThe present study demonstrated that the use of parameters collected during maximal ergometric test combined with ventilometry, improved the accuracy of equations for estimating V˙ O2max. Moreover, it was recommended that equation 2 be used to estimate V˙ O2max in active subjects, and equation 3 be used in their sedentary counterparts.
Conflicts of interestThe authors declare no conflicts of interest.
The following is Supplementary data to this article:


