

This a priori statistical analysis plan describes the methods of analysis for the Trial Of Prevention Strategies for low back pain (TOPS).
ObjectivesTOPS aimed to investigate the effectiveness and cost-effectiveness of exercise and education classes compared with a minimal intervention control in preventing recurrence of low back pain (LBP) in people who have recently recovered from an episode of LBP.
MethodsTOPS is a superiority, pragmatic, parallel-group randomized controlled trial with allocation concealment, blinded outcome assessors, and intention-to-treat analysis. Participants were randomized to a physical therapist-led exercise and education program for 12 weeks or minimal intervention. The primary outcome was days to recurrence of an episode of LBP. The three key secondary outcomes were days to recurrence of an episode of LBP resulting in (1) activity limitation, (2) care seeking for LBP; and (3) work absence of at least 1 day. Differences in survival curves for the primary (days to recurrence) and secondary outcome (days to LBP with activity limitation, days to care seeking due to LBP, and days to work absence due to LBP) will be compared using Cox regression. Hazard ratios (HRs) and median survival times with 95% confidence intervals (CI) will be calculated. The number of adverse events, including serious adverse events will be reported and the proportion of adverse events between groups will be compared using a Chi-squared test.
DiscussionThis paper will provide a detailed description of the planned analyses for the TOPS trial.
Trial registrationAustralian New Zealand Clinical Trials Registry (ACTRN12615000939594).
Low back pain (LBP) is the largest contributor to years lived with disability in both developed and developing countries.1,2 Whilst the majority of individuals experiencing an acute episode of LBP recover within 6 weeks,3 around 70% of those who recovered will have a new episode of LBP within 12 months.4 Because episodes of recurrence of LBP tend to be longer and more costly than first episodes, recurrence represents an important contributor to the financial impact of LBP.5
Exercise is the only effective intervention to prevent recurrence of LBP. According to a systematic review, there is moderate quality evidence that exercise combined with education can reduce the risk of recurrence by up to 45%.6 However, there are some concerns with the internal validity of the findings of the trials included in that review. For example, most trials of LBP prevention included in that review are at high risk of bias (e.g. due to lack of allocation concealment). Lack of generalizability of findings is another concern since some trials were conducted in specific populations (e.g. military conscripts,7 nurses8), and their outcomes might not be transferable to the general population.
The Trial Of Prevention Strategies for low back pain (TOPS) is a pragmatic randomized controlled trial investigating the effectiveness of exercise and education compared to a minimal intervention in preventing recurrence of LBP in people recently recovered from an episode of LBP. TOPS recruited participants from January 2016 to January 2019. The purpose of this statistical analysis plan is to pre-specify the statistical methods that will be used to analyze primary and secondary outcomes, adverse events, economic evaluation, and process measures.
Trial overviewTrial designTOPS is a superiority, pragmatic, parallel-group randomized controlled trial with allocation concealment and blinded outcome assessors. The study was approved by the University of Sydney Human Research Ethics Committee (2015/728), and prospectively registered with the Australian New Zealand Clinical Trials Registry (ACTRN12615000939594). The protocol for the study has been published elsewhere.9 The study was partially funded by a WorkCover New South Wales Research Grant and by a Defence Health Foundation Grant.
Study populationWe recruited participants aged 18 years and older that had recovered from a previous episode of non-specific LBP within the previous month. Participants were recruited from primary care practitioners (general practitioner or physical therapist) and community settings. We used banners and flyers to recruit participants from community settings (e.g. hospitals, community centers). Methods for recruiting participants from primary care practitioners were described in the trial protocol.9
Non-specific LBP was defined as pain in the area between the 12th rib and buttock crease, not attributed to a specific diagnosis (e.g. axial spondyloarthritis, vertebral fracture, etc.) and not accompanied by radicular pain attributable to a true nerve compression. Recovery was initially defined as 30 consecutive days with pain no greater than 1 on a 0 to 10 scale. These inclusion criteria were relaxed due to difficulties in recruiting participants; we loosened the definition of recovery to seven consecutive days with average pain no greater than 2 on a 0 to 10 scale.10
Participants were excluded if they had any of the following: (1) previous spinal surgery; (2) any co-existing medical condition that would severely restrict or prevent participation in the exercise program (using the Physical Activity Readiness Questionnaire for Everyone (PAR-Q+)11); (3) not employed; (4) insufficient English or cognitive disability to provide consent and complete outcome measures; (5) currently participating in an exercise program similar to the one delivered by the trial, or a structured moderate intensity aerobic exercise program for at least 150min/week, or a structured strength training exercise program at least two times/week; (6) unable to collect valid baseline physical activity data (wearing the accelerometer for at least 10h/day for at least 4 consecutive days of the 7-day wearing period); and (7) currently pregnant.
Randomization and allocationA randomization sequence was developed prior to the start of the trial. The randomization schedule was developed using a permuted blocking method with random block sizes stratified by history of LBP (more than two previous episodes: yes or no). Consecutively numbered, sealed, opaque envelopes were used to keep allocation concealed. Participants were allocated at a 1:1 ratio to either exercise and education or minimal intervention by an investigator at the end of the baseline assessment. Participants were considered as enrolled in the study at the point of randomization.
BlindingIt was not possible to blind participants or intervention providers due to the nature of the intervention. Participants were told that the study compares two methods for preventing recurrence of LBP, in an effort to blind participants to the research question. Researchers collecting follow-up data and conducting the analyses were blinded to treatment allocation.
InterventionsRegistered physical therapists experienced in the conduct of exercise programs for LBP from 10 sites across Sydney and 1 site in Wollongong, two major cities in the state of New South Wales, provided both treatments.
Participants in the minimal intervention group received the ‘Guide to Positively Managing Back Pain’ booklet, and one half-hour appointment with the intervention provider, who took the participant through the contents of the booklet. The content of the ‘Guide to Positively Managing Back Pain’ includes advice on self-management and prevention of LBP as well as a brief overview of exercise to treat and prevent LBP. Participants also had the opportunity to contact the intervention provider over the phone on one occasion to ask any questions about the book or its contents.
Participants in the exercise and education group received a comprehensive and individualized exercise and education program for 12 weeks. At the first appointment, participants underwent a comprehensive assessment session to determine their cardiovascular fitness, muscular endurance, flexibility, mobility, and neuromotor fitness.9 The results of the assessment were used to tailor the exercise program, which included: a supervised exercise program (1 session per week for 8 weeks), and home exercises. Home exercises were implemented and monitored during three 30min appointments at weeks 4, 8, and 12. Exercises performed during classes and at home were tailored to the participants’ needs.
OutcomesParticipants were followed up for primary and secondary outcomes every two weeks by email or text message. Data were managed by a researcher blinded to group allocation, and all data were entered into RedCap. More details on how follow-up measures were collected are provided in the trial protocol.9
Primary outcomeDays to recurrence of an episode of LBP, defined as LBP lasting for at least 24h with a pain intensity of 3 or more on a 0–10 numeric pain rating scale.
Secondary outcomesDays to recurrence of an episode of LBP resulting in (1) activity limitation (moderate or greater activity limitation, (2) care seeking for LBP (consultation to any health care provider); and (3) work absence of at least 1 day. Activity limitation was measured using an adaptation of item 8 of the Short-Form 36 questionnaire (“Have you had any back related activity limitation lasting at least 24h which you would describe as being moderate or greater?”).12
Adverse eventsAdverse events were defined as any untoward medical occurrence, whether or not it is considered related to the trial intervention. A serious adverse event was defined as one that is life-threatening or required hospitalization or will result in permanent significant disability or incapacity. Adverse events were measured via questionnaire at 2 weeks post-randomization with the following question: “Have you had a new medical condition or an exacerbation of an existing condition since beginning the study, e.g. dizziness?”.
Cost outcomesCost outcomes were obtained from cost diaries mailed out to participants who reached the primary outcome. Participants were asked to record their costs over a period of 3 months following their recurrence, which included: (1) hours taken off normal paid work; (2) use of healthcare services (e.g. general practitioner or physical therapist, including number of consultations); (3) use of community services (e.g. gym); (4) use of prescription medicine (name, pharmacological class, dose, daily dosage and number of days); (5) use of over-the-counter medication or other out-of-pocket costs (e.g. purchase of heat wraps or lumbar supports).
Process measuresObjectively-measured physical activityWe recorded objectively measured physical activity using a wearable accelerometer (Actigraph GT3X-Plus) at baseline and at 6 and 12 months post-randomization. The Actigraph GT3X+ is the most researched accelerometer, and has been shown to be a valid method to assess physical activity.11 Participants were instructed to wear the device on the right side of their waist, for seven consecutive days, all day (except during water-based activities, e.g. during bathing). Participants were not required to wear the device to bed at night. Data were collected at a sampling frequency of 30Hz and reintegrated to 60-second epochs during analysis.
The main output from ActiGraph GT3X+, activity counts, represents the total volume of physical activity performed,13 and is computed as total counts accumulated in a valid day divided by the wear time of that day.14 Periods of 90-min or more of consecutive zeros are considered non-wear time.15 Total activity counts are converted to sedentary time or light, moderate, and vigorous physical activity using established cut-offs.16
Back pain beliefsBack pain beliefs were assessed with the Back Beliefs Questionnaire (BBQ) at baseline and at 6 and 12 months post-randomization. The BBQ measures beliefs about the consequences of LBP.17 Each of the 14 items of the questionnaire is scored on a 5-point Likert Scale (ranging from completely disagree to completely agree). Five of these questions are distractors, and therefore only 9 questions are used to compose the total score, which ranges from 9 to 45. Higher scores indicate more pessimistic beliefs about the consequences of LBP.18
AdherenceIntervention providers recorded attendance for all participants using a study diary. In the exercise and education intervention group, good adherence was achieved when participants attended at least 80% of the face-to-face sessions. In the minimal intervention group, good adherence was achieved when participants attended the one face-to-face appointment.
CredibilityAt 14 weeks post-randomization, participants completed the Credibility and Expectancy questionnaire (Credibility range: 0–40; expectancy range: 0–20; higher scores indicate higher treatment credibility and expectancy of improvement).19
SatisfactionWe measured participant satisfaction at 14 weeks post-randomization using a 5-point Likert scale (ranges from extremely dissatisfied to extremely satisfied).
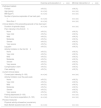
Additional data collectedAt baseline, we collected information about (1) participant details (sex, age, body mass index, number of previous episodes of LBP); (2) clinical details of the episode of LBP preceding enrolment (duration of episode, pain intensity in the first 24h, presence of leg pain, activity limitation in the first 24h, whether the episode was compensable, and led to care seeking; (3) current clinical status (current pain intensity, activity limitation over the past week, feelings of depression, risk of recurrence expectation) (Table 1). For participants reaching the primary outcome (e.g. reporting a recurrence as per our criteria), we also collected information on their pain intensity (0–100) during the event, and pain location using a body diagram.
Participant characteristics at baseline (n=xx).
| Exercise and education (n=xxx) | Minimal intervention (n=xxx) | |
|---|---|---|
| Participant details | ||
| Female | n/N (%) | n/N (%) |
| Age (years) | xx.x (xx) | xx.x (xx) |
| BMI (kg/m2) | xx.x (xx) | xx.x (xx) |
| Number of previous episodes of low back pain | ||
| 1 | xx.x (xx) | xx.x (xx) |
| More than 1 | xx.x (xx) | xx.x (xx) |
| Clinical details of the preceding episode of low back pain | ||
| Duration of episode (days) | xx.x (xx) | xx.x (xx) |
| Pain intensity in the first 24h | ||
| None | n/N (%) | n/N (%) |
| Very mild | n/N (%) | n/N (%) |
| Mild | n/N (%) | n/N (%) |
| Moderate | n/N (%) | n/N (%) |
| Severe | n/N (%) | n/N (%) |
| Very severe | n/N (%) | n/N (%) |
| Leg pain | n/N (%) | n/N (%) |
| Activity limitation in the first 24h | ||
| None | n/N (%) | n/N (%) |
| Very mild | n/N (%) | n/N (%) |
| Mild | n/N (%) | n/N (%) |
| Moderate | n/N (%) | n/N (%) |
| Severe | n/N (%) | n/N (%) |
| Very severe | n/N (%) | n/N (%) |
| Compensation claim | n/N (%) | n/N (%) |
| Care seeking | n/N (%) | n/N (%) |
| Current clinical status | ||
| Current pain intensity (0–100) | xx.x (xx) | xx.x (xx) |
| Activity limitation over the past week | ||
| None | n/N (%) | n/N (%) |
| Very mild | n/N (%) | n/N (%) |
| Mild | n/N (%) | n/N (%) |
| Moderate | n/N (%) | n/N (%) |
| Severe | n/N (%) | n/N (%) |
| Very severe | n/N (%) | n/N (%) |
| Feeling depressed (0–100) | xx.x (xx) | xx.x (xx) |
| Risk of recurrence expectation (0–100) | xx.x (xx) | xx.x (xx) |
| Process measures | ||
| Physical activity at baseline (counts/min) | ||
| Back Beliefs Questionnaire (9–45) | xx.x (xx) | xx.x (xx) |
Continuous variables will be presented as means and standard deviations for normally distributed variables and median, minimum, maximum, and interquartile range for non-normally distributed variables (xx.x (xx)). Frequencies and proportions will be used to summarize categorical variables (n/N (%)).
TOPS was powered to detect, with 80% power, a 40% relative reduction in recurrence rates between the treatment and control groups. This treatment effect estimate is consistent with data from systematic reviews that show a 45% relative risk reduction in recurrence rates when exercise combined with education is compared to minimal intervention.6 To achieve the pre-specified power, 160 participants (80 per group) were required, allowing for 1% loss to follow-up and 1% treatment non-compliance per month in both groups.
Statistical analysisAnalysis principlesAn analyst blinded to treatment allocation will perform primary and secondary analyses. We will analyze data following intention-to-treat principles (i.e. participants will be analyzed in the group to which they were randomized to, regardless of whether the participant received the allocated intervention) (Fig. 1). We will evaluate data normality of baseline characteristics and process measures by visual inspection of histograms. Continuous variables will be presented as means and standard deviations for normally distributed variables; median, minimum, maximum, and interquartile range for non-normally distributed variables. Frequencies and percentages will be used to summarize categorical variables. Percentages will be calculated using the number of participants for whom data are available as the denominator. For the primary outcome, process measures, and utilization cost data, a p<0.05 will be considered statistically significant. For secondary outcomes, a p<0.01 will be considered statistically significant to account for multiple statistical tests. Effect sizes of 40% risk reduction as per power analysis will be considered of interest.
Data integrity.")
We will draw a random sample of 10% of participants’ data files that were initially recorded in paper files (e.g. cost diaries) and cross check these values against the electronic database. If the rate of error is greater than 5%, another 10% sample will be drawn and checked. The acceptable error rate for this new sample is then 4%. If the error rate is again higher than the acceptable rate (4%), then another 10% sample will be drawn for checking and the next acceptable error rate is reduced by another 1%. This process continues until the observed error rate is below the acceptable threshold. Outcome data were collected via online questionnaires, and therefore cross-checking was not necessary. All variables will be inspected for implausible values.
Blinding of analysisResearchers involved in the preparation of the analysis plan did not have access to unblinded data and outcomes. Data quality checks and quantification of missing data will be performed in the entire dataset not broken down by treatment allocation. Once all the data are checked for quality, information on the group allocation will be merged into the dataset in a blinded fashion using dummy group names (e.g. group A and group B). Analysis and interpretation of data will be conducted in a blinded fashion, and group allocation will only be unmasked after the statistical report has been completed and interpretation agreed upon.
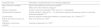
Evaluation of demographics and baseline characteristicsBaseline characteristics will be presented in a table stratified by treatment group (Table 1), Hypothesis testing of baseline characteristics between groups will not be performed in accordance with the recommendations of the CONSORT statement.20Table 2 describes the prognostic factors which will be treated as potential confounders of the effect of the intervention. These confounders were selected based on the available literature on prognostic factors for the development,21,22 recurrence,4 and recovery23–25 of LBP. Potential confounders that are unbalanced despite randomization will be included in the Cox regression for primary and secondary outcomes.
Potential confounders of treatment effect that will be entered in the statistical model for primary and secondary outcomes as confounders if they are unbalanced despite randomization.
| Prognostic factor | Description of prognostic factor in the dataset (categories) |
|---|---|
| Age (continuous variable) | Age will be treated as a continuous variable21 |
| Sex | “Male” will be the reference category21 |
| Number of episodes | Number of previous episodes of LBP (up to 2 vs >2 episodes)4 |
| High disability at baseline | Activity limitation in the first 24h of the previous episode (Severe/very severe vs none/very mild/mild/moderate)23–25 |
| Compensation | Previous episode compensable (Worker's comp/third party, etc.) (Yes/No)23–25 |
| Risk of recurrence (continuous variable) | Risk of recurrence (0–100)23 |
| Depression (continuous variable) | Feelings of depression (0–100)22 |
Differences in survival curves for the primary (days to recurrence) and secondary outcome (days to LBP with activity limitation, days to care seeking due to LBP, and days to work absence due to LBP) will be compared using Cox regression. Hazard ratios (HRs) and median survival times with 95% confidence intervals (CI) will be calculated. Kaplan–Meier survival plots will be constructed to display survival curves up to 12-months post-randomization (time point where data were censored for all participants). For primary and all secondary time-to-event outcomes, we will test the proportional hazards model assumption using the time-dependent covariate method and observation of Kaplan Meier survival plots. Time-to-event outcomes were censored at 12 months from date of randomization for all participants. This is a deviation from the initial protocol where we noted that we would follow-up participants until recurrence or study completion. We realized that this length of follow-up was intrusive for participants who remained recurrence-free for a number of years. To reduce the impact on participants we stopped follow-up at 12 months and informed the ethics committee of this change.
Process measuresObjectively measured physical activity, back pain beliefs, and credibility will be presented as means and standard deviations for normally distributed variables; median, minimum, maximum, and interquartile range for non-normally distributed variables. An independent t test will be used to draw comparisons between groups. Adherence to trial interventions will be presented as the proportion of participants who fulfilled the criteria for good adherence in each group. A chi-squared test will be used to draw comparisons between groups. We will present satisfaction scores as the proportion of participants in each group who were satisfied or extremely satisfied with the intervention. A chi-squared test will be used to draw comparisons between groups. A p<0.05 will be considered statistically significant for all process measures.
Economic evaluationWe will perform a cost-effectiveness analysis regardless of the effect of the intervention on the primary outcome. The cost-effectiveness analysis will be conducted from the societal perspective and reported in Australian Dollars. The time horizon of the economic evaluation is 3 months, which corresponds to the period of time participants who had a recurrence filled their cost diary. Methods used to derive costs with health care services, medications, community services, other out-of-pocket costs, work absenteeism and presenteeism have been described elsewhere.9 The reference year for the derivation of cost measures will be 2017, the year when most participants were recruited. An incremental cost-effectiveness ratio (between-group differences in costs divided by the between-group differences in treatment effectiveness measured by the primary outcome) will be calculated. Cost-effectiveness ratios will be estimated using bootstrapping methods (5000 replications). Acceptability curves and net monetary benefit will also be estimated. Sensitivity analyses on the most important cost drivers will be performed to assess the robustness of the results.
Adverse eventsAdverse events reported will be coded either as adverse events or serious adverse events according to the International Classification of Diseases (ICD-10) using three-digit codes. Data will represent the frequency and proportion of participants who experienced an adverse event or serious adverse event. The frequency and proportion of participants who had an adverse event and serious adverse event will be compared between groups using the chi-squared test.
Methods for handling missing dataData for primary and secondary time-to-event outcomes from participants who dropped-out or were lost to follow-up will be censored from the time point at which they withdrew. Multiple imputation methods will be used to replace cost data.
Subgroup analysisNo subgroup analysis is planned.
Conflicts of interestTW-R runs a business providing exercise classes for the prevention and management of low back pain.
GEF is supported by Coordenação de Aperfeiçoamento de Pessoal de Nível Superior (CAPES) with a PhD scholarship, Ministry of Education, Brazil.
CGM is supported by a Principal Research Fellowship from Australia's National Health and Medical Research Council. CL is supported by an NHMRC fellowship.
We thank Charles New, Margreth Grotle, Maurits van Tulder, and Rachelle Buchbinder for providing assistance in developing the trial protocol.


