

Oxygen uptake efficiency slope (OUES) is a method for investigating cardiorespiratory fitness and is proposed as an alternative to overcome the limitations of traditional measures such as peak oxygen consumption (VO2peak) for patients who do not achieve a maximum response, such as in Parkinson's disease (PD).
ObjectiveTo assess the performance of individuals with PD during the six-minute walk test (6MWT) using the OUES.
MethodsThis is an observational cross-sectional study including 12 individuals with PD and 12 healthy controls. Participants performed the 6MWT along with an analysis of exhaled gas kinetics. The OUES was determined from the last 16 s of the walk test. Multiple linear regression analyses were computed to explore associations between the independent (OUES) and the dependent variables (VO2peak) controlled by group.
ResultsThe OUES was associated to VO2peak on the 6MWT (β=0.24, p<0.01) in individuals with PD. The PD group had low performance on the 6MWT with a shorter distance walked (mean difference: -113.1 m; 95% CI: -203.2, -59.1) and worse cardiopulmonary condition with lower OUES values (mean difference: -0.52 [l/minO2]/[l/minVE]; 95% CI: -0.83, -0.21) found in this same group.
ConclusionsOur results suggest that OUES is related to VO2peak during the 6MWT, and therefore it could be used as a submaximal test evaluation tool which provides cardiopulmonary reserve data in individuals with PD.
Oxygen consumption at peak exercise (VO2peak) is a well-recognized gold standard measure of exercise capacity in healthy1 and specifically in ill individuals such as those with Parkinson's Disease (PD).2 Despite its accuracy in individuals with PD,3 there is conflicting data on VO2peak responses during maximal and submaximal exercise. Some studies have reported no differences between individuals with PD and healthy controls,4,5 whereas others have reported impaired VO2peak responses in PD.3,6,7
The oxygen uptake efficiency slope (OUES)8 proposes a submaximal analysis of the values obtained on a cardiopulmonary test resulting from the linear relation between VO2 and the ventilator equivalent (VE) logarithm.9 In other words, OUES reflects the absolute increase rate in VO2 per 10-fold increase of ventilation. This measurement may provide additional information on cardiopulmonary reserve function, since it expresses the ventilatory requirement for a given VO2, representing how effectively oxygen is extracted and taken into the body.8,10–12 Therefore, the OUES method might be an attractive alternative in understanding cardiorespiratory fitness (CRF) since it integrates cardiovascular, muscular, and respiratory function into a single index.13
This index has shown excellent intra-test reliability, good test–retest reproducibility,14 and is highly correlated to VO2peak.8 Its main advantage is in being independent from exercise intensity; for example, associations between maximal oxygen consumption (VO2max) with OUES at 75%, 85%, and 90% of exercise intensities did not vary in different populations.15–17 This fact suggests the possibility of using this variable at submaximal exercise levels and in populations with limitations for intense workouts. An additional advantage of OUES is its mathematical determination which minimizes interobserver variability.16
Since its inception, a growing body of evidence has shown the prognostic value of OUES as a useful index for aerobic fitness assessment in older adults,18 healthy adults,13 and children,19 as well as in adults with a variety of health conditions such as obesity,17 heart20 and lung diseases,21 chronic kidney disease,22 down syndrome,15 multiple sclerosis,23 and stroke24; however, to date there are no available data for individuals with PD. Thus, it is essential to expand the knowledge and clinical applicability of OUES as an alternative method to overcome the limitations of VO2peak16,25 and to provide new insights about cardiorespiratory functions during a submaximal exercise in PD.
This study has the following objectives: to verify if OUES is related to VO2peak in individuals with and without PD, and to compare the OUES values between participants with and without PD.
MethodsStudy designThis is a cross-sectional study performed at the Cardiopulmonary Physical Therapy Laboratory of the Universidade Federal de Pernambuco (UFPE) in Recife, PE, Brazil.
SettingThe study was conducted between May 2016 and March 2017. Participants of both sexes were recruited by convenience from the Neurology Department of the UFPE. This study meets the postulates of the Declaration of Helsinki and the terms recommended by the National Health Council (Resolution 466/2012) for research involving human beings. All volunteers were properly informed about the objectives, methods, and risks and benefits of the study, and those who agreed to participate signed an informed consent form. The study was approved by the Research Ethics Committee of the Health Sciences Center of the UFPE, under the registration number: 51,283,415.0.0000.5208.
ParticipantsParticipants with PD diagnosis confirmed by a neurologist specialized in movement disorder according to the UK Parkinson's Disease Society Brain Bank clinical diagnosis criteria,26 at PD stage between 2 and 3 determined by Hoehn and Yahr classification (which ranges from 1 to 5, with higher scores indicating more severe disease),27 and aged between 40 and 80 years were included. Exclusion criteria were: history of additional prior neurological condition; presence of orthopedic and/or rheumatic problems limiting walking performance (for example, but not restricted to severe arthritis, spinal stenosis, or pain); cardiac problems which interfere with ability to safely exercise [i.e. uncontrolled congestive heart failure, complex cardiac arrhythmias, chest pain or pressure, resting tachycardia (> 150 beats/min), uncontrolled blood pressure (BP) (resting systolic BP > 180 mmHg or < 90 mmHg or diastolic BP > 100 mmHg)]; pre-existing lung diseases and clinical instability characterized by infections. Individuals in the control group without any neurological disease, osteomyoarticular limitations, cardiorespiratory comorbidities, or clinical and hemodynamic instabilities were matched for sex and age with PD participants.
OutcomesThe participants were assessed using the 6-minute walk test (6MWT), and sociodemographic data (sex and age) and anthropometric characteristics (weight, height, and body mass index [BMI]) were recorded. All participants were instructed to continue taking any medication and the exercise tests were performed in the period of medication when the individuals were experiencing the benefit from the anti-Parkinson medications.
Six-minute walk test and analysis of respiratory gas kineticsThe 6MWT was performed following the American Thoracic Society guidelines using a 30-meter corridor, where the participants were requested to walk as fast as possible during 6 min.28,29 Heart rate and oxygen saturation were monitored by a portable oximeter. The evaluator offered encouraging words every minute to the patients.28 The meters traveled were considered according to the meter-by-meter markings on the ground. The total distance covered was calculated at the end of the test.28
An analysis of expired gasses was combined with the 6MWT. The exhaled gas kinetics such as VO2, carbon dioxide production (VCO2), and respiratory exchange ratio (RER)30,31 were measured breath-by-breath using a METAMAX 3B device (CORTEX Biophysik, Leipzing- Germany). The mean of the data points from the last 30 s of the test were used to determine VO2peak, VCO2, RER, and VE.32
A linear regression analysis was performed to define OUES based on the following equation:

In which: “a” corresponds to the OUES value, which results from the ratio of VO2 increase in response to the increase of VE, which is represented by “b”. OUES was expressed as the highest value reached during the last 16 s of the test.11
Sample sizeA pilot study was conducted with 10 individuals (5 for each group) for sample calculation using the OUES measurement as the outcome. The sample size was estimated at 18 (nine per group) from a mean OUES of 1.00 ± 0.30 (l/minO2)/(l/min VE) in the PD group and 1.62 ± 0.50 (l/minO2)/(l/min VE) in the control group. A power of (1 - β) of 90% and an α of 5% were considered. The G*Power 3 statistical program was used to perform the sample size calculation.
Statistical analysisThe descriptive analysis was performed through measures of mean and standard deviation (SD) for continuous variables, and as frequency for categorical variables. The distribution of normality was verified through the Shapiro-Wilk test. The Levene test was used to test the homogeneity of the variances. Comparisons between PD and control groups were assessed through the Student's t-test or Mann-Whitney Test. Chi-squared test was used for categorical variables.
A bivariate analysis between VO2peak and OUES was tested through the Pearson's correlation (r) separated by the PD and the control group. Correlations were considered small if they ranged between 0.30 to 0.50; moderate when they ranged from 0.50 to 0.70, and high when above 0.70. Next, linear multiple regression was used to test the association between VO2peak (dependent variable) and OUES (independent variable) controlled by group (confounder) to simultaneously test the influence of PD on this relationship. A potential effect modification by group was assessed by adding a multiplication interaction term and assessing statistical significance, but because a significant interaction was not found, the group was entered as a confounding variable. Regression diagnostics were performed to confirm that linear regression assumptions were met: normality (Kolmogorov–Smirnov); linearity (scatterplots); homoscedasticity (standardized residual dispersion plots and standardized predictive); independence of residuals (Durbin–Watson statistic); and non-collinearity (collinearity diagnostics); and influential cases (Cook's distance). The Statistical Package for Social Sciences (SPSS) version 20.0 program (Chicago, IL, USA) was used considering a significance level of 5% (α=0.05).
ResultsA total of 28 of a potential 30 participants were evaluated. Four were excluded due to the presence of orthopedic (n = 2) or respiratory comorbidities (n = 2), thus resulting in 24 individuals with 12 in the PD group and 12 in the control group.
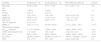
Table 1 shows the general characteristics of the participants. Those with PD showed lower values for the 6MWT distance and physiological variables such as VO2peak, OUES, VCO2, and VE than the control group (Table 1).
General characteristics of the participants.
| Variables | PD group (n = 12) | Control group (n = 12) | Mean difference (95% CI) | p-value |
|---|---|---|---|---|
| Age, years | 63.33 ± 10.43 | 61.41 ± 11.25 | 1.91 (−7.26, 11.10) | 0.6 |
| Sex | ||||
| Male | 7 (58.3) | 7 (58.3) | – | 1.0 |
| Female | 5 (41.7) | 5 (41.7) | – | |
| Height, m | 1.62 ± 0.54 | 1.66 ± 0.90 | −0.03 (−0.09, 0.02) | 0.2 |
| Weight, kg | 69.83 ± 11.07 | 77.08 ± 12.74 | −7.25 (−17.4, 2.9) | 0.1 |
| BMI, kg/m2 | 24.70 ± 5.74* | 25.87 ± 7.37* | −1.56 (−5.0, 1.8) | 0.3a |
| Years of diagnosis | 8.14 ± 6.13 | – | – | – |
| 6MWD, m | 370.5 ± 111.14* | 501.66 ± 46.23* | −131.2 (−203.2, −59.1) | <0.01a |
| Physiological variables | ||||
| VO2Peak, ml/kg/min | 711.73 ± 149.26 | 1078.2 ± 186.4 | −366.5 (−509.9, −223.1) | <0.01 |
| OUES, (l/min O2)/(l/min VE) | 1.12 ± 0.23 | 1.65 ± 0.46 | −0.52 (−0.8, −0.2) | <0.01 |
| VCO2, ml/min | 645.4 ± 153.7 | 984.4 ± 204.70 | −339.0 (−492.2, −185.9) | <0.01 |
| VE, ml/min | 23,297.9 ± 5211.5 | 32,808.0 ± 10,051.11 | −9510.1 (−16,288.3, −2732.0) | <0.01 |
| RER | 0.91 ± 0.12 | 0.91 ± 0.09 | 0.002 (−0.08, 0.09) | 0.9 |
Values expressed as mean ± SD or n (%).
PD: Parkinson's disease; BMI: Body Mass Index; 6MWD: 6-minute walking distance; OUES: oxygen uptake efficiency slope; VO2Peak: peak oxygen consumption; VCO2: Carbon dioxide production; VE: Ventilation per minute; RER: Respiratory exchange Ratio.
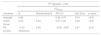
There was a moderate correlation between VO2peak and OUES (Fig. 1). The linear multiple regression showed that VO2peak was associated to OUES (β=0.24, p-value <0.01), independent of the presence of PD, with this model representing 65% of VO2peak variance (p-value <0.01) (Table 2).

Multiple linear regression model between VO2Peak and OUES.
VO2Peak: peak oxygen consumption; PD: Parkinson's disease; OUES: oxygen uptake efficiency slope.
The present study pointed out that OUES was associated to VO2peak during the 6MWT in individuals with PD. The PD group additionally showed lower OUES values when compared to controls. Thus, it could be used as a submaximal test evaluation tool which provides cardiopulmonary reserve data in individuals with PD.
This study indicates that VO2peak may be predicted based on OUES values and PD, as this model explained a large proportion of the variance in VO2peak (65%). Previous reports from different populations support our findings. For instance, Heine et al.23 found a moderate to high concurrent validity of OUES with VO2peak in patients with multiple sclerosis.23 Correlations between VO2peak and OUES were also high in patients at 3, 6, and 12 months post-stroke. Thus, these findings reinforce the viability of this parameter to measure CRF in adults with PD.
This study also showed that the PD group might have more ventilatory inefficiency compared to the control group. However, due to the novelty of our study, comparability with other studies of patients with PD which have used OUES as a CRF measure is difficult. Previous studies conducted in individuals with PD and using VO2peak also identified impaired exercise capacity and a blunted metabolic/cardiovascular response after submaximal and maximum exercise tests.6,7 For example, Kanegusuku et al.6 reported that individuals with PD presented lower VO2peak values than controls submitted to a cycle ergometer exercise test protocol. In a large cross-sectional study with 589 patients with PD, those with PD presented a 31% lower estimated VO2max.5
The mechanisms related to this impaired exercise response in patients with PD were not studied in the present study. However, some previous literature indicates this impairment could be a consequence of dysautonomia often found in PD.33–35 Another possible mechanism involved is related to alterations in respiratory center activity, with evidence of impairment in the activation and coordination of the muscles involved in central airway control.36–38 In addition to the classical motor impairments presented by the disease, postural changes such as kyphosis accentuation and rigidity/stiffness of the thoracic spine and ribs, with consequent flexibility loss in the muscles of that region may lead to imbalance in controlling this musculature.39,40 Stiffness in the thoracic muscles, bradykinesia and tremors are factors which can severely compromise a patient's breathing, thus affecting their ventilator efficiency.41,42
The 6MWT was chosen as a measure of submaximal exercise and walking capacity in this study. Despite its safety,43 studies have shown that the acute physical demands of the 6MWT are of moderate-to-vigorous intensity.44,45 The patients with PD in this study presented a lower distance on the 6MWT than the control group. This is consistent with previous studies which demonstrated low walking/functional capacity in this population.46–48 In addition, this fact reinforces the usefulness of the OUES measurement in this population, since there is strong evidence that it provides an effort-independent estimation of cardiorespiratory reserve in individuals unable to perform maximal exercise.9
Study limitationsThe results of the present study cannot be generalized to a general population of individuals with PD, since our sample was only composed by patients in the 2 to 3 HY stage to avoid wide motor fluctuations present in the earlier stages (HY 1) and the most severe stages (HY 4 or 5).49
Moreover, we did not match our groups according to physical activity level. Thus, it is possible that the differences found in metabolic responses could be due to the differences in physical activity levels between them, since a previous report showed that individuals with PD are less active than healthy controls.50 However, a recent study by Mavrommati et al.7 demonstrated that aerobic capacity and cardiovascular responses remained unchanged even after an exercise program in PD, reinforcing that the disease itself might have more negative impact on cardiorespiratory and metabolic systems than the individual's physical activity level.7
Therefore, further research should confirm these CRF determinants in a PD sample with a wide range of motor symptoms or disability and physical activity levels. Furthermore, the low OUES values by patients with PD found in this study emphasize the importance for careful follow-up and monitoring of the functionality and cardiopulmonary condition of these patients. Verifying this impairment over time can minimize possible future deleterious effects through the inclusion of these individuals in rehabilitation programs.
Regardless of these limitations, this study shows an alternative and feasible measurement which should be incorporated into clinical practice. Despite VO2peak being considered a gold standard measurement in CRF assessment, its use is limited for several factors such as patient's motivation, physical fitness, examiner experience, skeletal muscle structure, and pulmonary function.51,52 All of these factors could influence its accuracy. OUES does not require maximal effort and can be used as a CRF measurement even in a submaximal exercise test such as 6MWT. Moreover, OUES integrates several features such as development of metabolic acidosis, muscle mass, oxygen extraction and utilization, and physiological pulmonary dead space.53 Thus it is an index which not only reflects the cardiovascular and musculoskeletal function, but also incorporates respiratory function.53 These data highlight its promising role in non-maximal cardiopulmonary exercise tests even more in patients with PD where maximal exercise tests would not be interpretable.
ConclusionsOUES during the 6WMT may be used as a submaximal test evaluation tool to provide cardiopulmonary reserve data in individuals with PD. Individuals with PD performed worse during a submaximal test compared to a population without the disease.
This study was funded by CNPQ (Edital Universal: 432865/2016-0 and 428841/2018-0). L.A and J.F. were recipients of a CNPq post-doctoral fellowship (Grant number: PDJ-150454/2018-0 and PDJ-153257/2018-0, respectively).


