


Measuring maximal respiratory pressure is a widely used method of investigating the strength of inspiratory and expiratory muscles.
ObjectivesTo compare inspiratory pressures obtained at functional residual capacity (FRC) with measures at residual volume (RV), and expiratory pressures obtained at FRC with measures at total lung capacity (TLC) in individuals with different health conditions: post-COVID-19, COPD, idiopathic pulmonary fibrosis (IPF), heart failure (CHF), and stroke; and to compare the mean differences between measurements at FRC and RV/TLC among the groups.
MethodsInspiratory and expiratory pressures were obtained randomly at different lung volumes. Mixed factorial analysis of covariance with repeated measures was used to compare measurements at different lung volumes within and among groups.
ResultsSeventy-five individuals were included in the final analyses (15 individuals with each health condition). Maximal inspiratory pressures at FRC were lower than RV [mean difference (95% CI): 11.3 (5.8, 16.8); 8.4 (2.3, 14.5); 11.1 (5.5, 16.7); 12.8 (7.1, 18.4); 8.0 (2.6, 13.4) for COVID-19, COPD, IPF, CHF, and stroke, respectively] and maximal expiratory pressures at FRC were lower than TLC [mean difference (95% CI): 51.9 (37.4, 55.5); 60.9 (44.2, 77.7); 62.9 (48.1, 77.8); 58.0 (43.9, 73.8); 57.2 (42.9, 71.6) for COVID-19, COPD, IPF, CHF, and stroke, respectively]. All mean differences were similar among groups.
ConclusionAlthough inspiratory and expiratory pressures at FRC were lower than measures obtained at RV/TLC for the five groups of health conditions, the mean differences between measurements at different lung volumes were similar among groups, which raises the discussion about the influence of the viscoelastic properties of the lungs on maximal respiratory pressure.
Maximal respiratory pressure (MRP) measurement is widely used to evaluate respiratory muscle strength through maximal inspiratory pressures (PImax), and maximal expiratory pressures (PEmax). This is a simple, non-invasive, and well-tolerated method, which can be useful to monitor muscle weakness, investigate dyspnea without apparent cause, and in the evaluation of respiratory muscle training, among others.1-5
The pressure developed by the inspiratory muscles plays a key role in the ventilatory process, intrinsically linked to the capacity to respond to increased metabolic demands.6 Therefore, the assessment of MRP may be valuable for assessing and monitoring individuals with health conditions that are usually followed by exercise intolerance and dyspnea,7-12 as well as the increased risk of aspiration pneumonia.13
PImax is usually performed at residual volume (RV), and PEmax at total lung capacity (TLC).1 However, pioneer studies reported that pressure developed by the muscles is greatly influenced by the lung volume in which the maneuver is obtained. Since Rohrer in 1916,14 many authors have suggested that the MRP relation to the lung volume is threefold: the elastic recoil pressure of the respiratory system influences the final pressures values,15-17 the changes in the length-tension relationship of the respiratory muscles in different lung volumes,15,17,18 and the influence of the muscles radius of curvature in pressure-generating capacity.17,18
MRP obtained at functional residual capacity (FRC) would minimize the influence of the elastic recoil pressure of the respiratory system in the final pressure values.16,19 Studies have been performed using measurements obtained at FRC,20-26, but they identified FRC through visual inspection, body plethysmography or using spirometers. A digital manometer capable of identifying the FRC moment to perform MRP has been recently validated, which provides a good balance between cost and accuracy.27,28
For these reasons, the aims of the study were: i) to compare PImax and peak inspiratory pressure (PIpeak) obtained at FRC with measures obtained at RV, as well as PEmax and peak expiratory pressure (PEpeak) obtained at FRC with measures obtained at TLC in each group of individuals: post-coronavirus disease 2019 (post-COVID-19), with chronic obstructive pulmonary disease (COPD), with idiopathic pulmonary fibrosis (IPF), with chronic heart failure (CHF), as well as individuals affected by stroke and, ii) to compare the mean differences between the measurements at FRC and at RV/TLC among the five groups. We hypothesized that measures obtained at FRC would be lower than measures obtained at RV for inspiratory pressures and measures obtained at TLC for expiratory pressures; we also hypothesized that the differences between measurements obtained at these different lung volumes would differ among health conditions.
MethodsStudy design and sampleThis was a cross-sectional study. The inclusion criteria for post-COVID-19 individuals were: individuals who were diagnosed with COVID-19 discharged from the hospitalization three months before the assessment; for individuals with COPD: diagnosis of COPD confirmed by lung function test29; for individuals with IPF: clinical diagnosis and by computed tomography; for individuals with CHF: clinical diagnosis of CHF with reduction of left ventricle ejection fraction (LVEF< 50%), New York Heart Association (NYHA) functional classification between I and III30; and, for individuals with stroke: last episode of stroke diagnosed >6 months and <5 years prior. For people with CHF and stroke: normal lung function according to predicted values.31 All individuals should be clinically stable (no fever and/or cold during the two weeks before the tests, as well as no hospitalization in the past four weeks), body mass index between 18.5 and 34.9 kg/m2,32 age 18 and above, and self-reported absence of contraindications for the performance of MRP tests.1 The exclusion criteria for all individuals were: inability to understand or perform any procedures, the self-related presence of any other studied health conditions or exhaustive exercise in the last 48 h before tests.
The Ethics Committee of the Universidade Federal de Minas Gerais approved the study (Protocol numbers 2.422.863 and 4.004.018), and written informed consent was obtained from all individuals.
OutcomesMRP were measured using the manometer TrueForce (LabCare/LEB – UFMG, Brazil), which can obtain MRP at FRC, RV, and TLC.27,28 This instrument obtains information through a data acquisition unit composed of pressure and flow sensors. The pressure sensor is designed to measure differential pressure into a range of ± 5 psi (± 351.5 cmH2O), with a 12-bit resolution, and accuracy of 0.25%. The flow sensor presents range of ± 200 L/min, typical accuracy of 1.5%, a sample rate up to 2 kHz, with a resolution of 14-bits. It enables volume to be calculated in real-time, which permits the maneuvers at FRC. Both sensors communicate with the microcontroller at a 200 Hz sample rate and are already pre-calibrated from the manufacturer (recalibrated once to confirm it). After that, the sensors are self-corrected according to the ambient temperature.27 PImax and PEmax, calculated by the area of one second around the peak pressure value, and PIpeak and PEpeak, the highest pressure achieved, were analyzed through the developed software program (Manovac-FRC software program), running from a laptop. The instrument is portable and communicates with the computer via Bluetooth protocol. The interface used was a flanged silicone mouthpiece with a 2 mm air leak orifice.1
Pulmonary function test was obtained using a calibrated spirometer (Koko®, PFT type, nSpireHealth INC., CO, USA) according to standardized recommendations,33 and data were compared with those predicted for the Brazilian population.31
The GOLD classification of airflow limitation severity was used to characterize the individuals with COPD as follows: mild (forced expiratory volume in the first second - FEV1 ≥ 80% predicted), moderate (50% ≤ FEV1 < 80% predicted), severe (30% ≤ FEV1 < 50% predicted), and very severe (FEV1 < 30% predicted).29
The NYHA functional classification is based on severity of symptoms and physical activity, and it was used to classify the individuals with CHF as: Class I (no limitation of physical activity), class II (slight limitation of physical activity), or class III (marked limitation of physical activity).30
ProceduresParticipants attended one data collection session, performed by the same trained evaluator. First, they underwent the initial evaluation to obtain clinical, demographic and anthropometric data, including previous physical activity in the last 48 h, and vital signs. The individuals then performed spirometry and completed the MRP tests at FRC, RV, and TLC in a randomized order (https://random-number-generator.com/pt/). Initially, the tests at FRC were obtained with the individuals remaining in a sitting position with their trunk and lower limbs supported, and head in a neutral position. A nose clip was used. The individuals were instructed to breathe following this pattern: inspiration just above tidal volume, and expiration similar to relaxing the chest (as in a sigh).27,34,35 After performing the number of respiratory cycles required by the instrument algorithm, a yellow light indicate that a breathing pattern was identified, and the FRC range - in which the effort should be performed - was determined. Then, a green light alerted the evaluator to request a maximal inspiratory or expiratory effort, while occluding the occlusion orifice. The evaluator also needed to press the cheeks of the individuals in the case of expiratory effort.1 Individuals should perform at least five maneuvers with a 1-minute interval between them. At least three of these five efforts should follow the acceptability criteria: without air leakage, the pressure maintained for at least 1.5 s, and volume of the maneuver within limits of FRC, and they were reproducible if the variation were < 10%.1 The last maneuver could not be the greatest, which would suggest a learning effect.36 The highest values of PImax, PIpeak, PEmax, PEpeak were selected.
Next, the individuals performed PImax at RV and PEmax at TLC after resting for 10 min, once their vital signs - peripheral oxygen saturation, blood pressure, and heart rate, had returned to baseline. These tests were obtained according to the ERS recommendations,1 in which maximal inspiratory effort was performed from RV, and maximal expiratory effort from TLC. Vital signs and perceived exertion to breathe according to the modified 0–10 Borg dyspnea Scale37 were evaluated before and immediately after each test.
Data analysesThe Shapiro-Wilk test was used to evaluate data distribution, which was presented as measures of central tendency (mean or median), and dispersion (standard deviation or interquartile range). Mixed factorial analysis of covariance (ANCOVA) with repeated measures was used to compare measurements obtained at different lung volumes within and among groups. "FRC and RV" (from the PImax and PIpeak measures) and "FRC and TLC" (from the PEmax and PEpeak measures) were considered intragroup factors and the "health conditions” as intergroup factors. The variable “age” was included in the model as a covariate, as it differed significantly among “health conditions”, and because it is closely related to the measures of PImax and PEmax. The Bonferroni test was used as a post hoc analysis. The level of significance was set at 5%. Data analysis was performed with the Statistical Package for the Social Sciences, version 23 (SPSS Inc, Chicago, USA).
ResultsNinety-four individuals were recruited and 75 were included in the final analyses. The flowchart of participants is presented in Fig. 1. Table 1 presents demographic, anthropometric, and clinical data of the individuals evaluated, divided by the five health conditions (post-COVID-19, COPD, IPF, CHF, and stroke). Individuals with COPD ranged from mild to severe airflow limitation [FEV1% predicted mean= 55 (24)], and individuals with CHF were classified with the NYHA classification as class I (1.6%), class II (10.7%), and class III (4.3%).

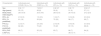
Demographic, anthropometric, and clinical data of the participants.
Data shown as mean (SD) except where otherwise indicated. M, Male; F, Female; COVID-19, Coronavirus disease 2019; COPD, Chronic obstructive pulmonary disease; IPF, Idiopathic pulmonary fibrosis; CHF, Chronic heart failure; FEV1, Forced expiratory volume in first second; FVC, Forced vital capacity; FEV1/FVC, Ratio of FEV1 to FVC; LVEF, Left ventricular ejection fraction.
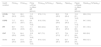
Table 2 shows the comparisons between PImax and PIpeak obtained at FRC and at RV in individuals with the different health conditions (comparisons within groups). For all groups, the mean PImax and PIpeak performed at FRC were lower than maneuvers obtained at RV. Table 3 shows the comparisons between PEmax and PEpeak obtained at FRC and at TLC (comparisons within groups). For all groups, the mean PEmax and PEpeak performed at FRC were also lower than maneuvers obtained at TLC. Tables 2 and 3 also present PImax and PIpeak measured at FRC accounted as % of measures obtained at RV, and PEmax and PEpeak at FRC as % of measures obtained at TLC.
Comparisons between PImax and PIpeak obtained at FRC and RV within individuals with different health conditions.
Data shown as mean (SD). COVID-19, Coronavirus disease 2019; COPD, Chronic obstructive pulmonary disease; IPF, Idiopathic pulmonary fibrosis; CHF: Chronic heart failure. PImax, maximal inspiratory pressure; RV, residual volume; FRC, functional residual capacity; Mean diff., mean difference; 95% CI, 95% confidence interval in brackets; PIpeak, peak inspiratory pressure; PImaxFRC (% PImaxRV), PImax obtained at FRC as% of PImax obtained at RV; PIpeakFRC (% PIpeakRV), PIpeak obtained at FRC as% of PIpeak obtained at RV. Pressures reported as cmH2O.
Comparisons between PEmax and PEpeak obtained at FRC and TLC within individuals with different health conditions.
Data shown as mean (SD). COVID-19, Coronavirus disease 2019; COPD, Chronic obstructive pulmonary disease; IPF, Idiopathic pulmonary fibrosis; CHF: Chronic heart failure; PEmax, maximal expiratory pressure; TLC, total lung capacity; FRC, functional residual capacity; mean diff., mean difference; 95% CI, 95% confidence interval in brackets; PEpeak, peak expiratory pressure; PEmaxFRC (% PEmaxTLC), PEmax obtained at FRC as% of PEmax obtained at TLC; PEpeakFRC (% PEpeak TLC), PEpeak obtained at FRC as% of PEpeak obtained at TLC. Pressures reported as cmH2O.
The mean differences between PImax and PIpeak obtained at FRC and RV, and PEmax and PEpeak obtained at FRC and TLC, presented in tables 2 and 3, respectively, were similar among the five groups of health conditions (p ≥ 0.22 for all comparisons among groups).
Fig. 2 shows the mean of FRC volumes identified for the inspiratory and expiratory maneuvers for each group, and the actual lung volume in which the maneuvers were obtained. All maneuvers were obtained within the required FRC limits.
. PImax, maximal inspiratory pressure; PEmax, maximal expiratory pressure; FRC, functional residual capacity; lim. vol., limit volume; COVID-19, post-coronavirus disease 2019; COPD, chronic obstructive pulmonary disease; IPF, idiopathic pulmonary fibrosis; CHF, chronic heart failure.")
Mean volume identified as functional residual capacity limit volume and actual volume of the maneuver (presented as ml). PImax, maximal inspiratory pressure; PEmax, maximal expiratory pressure; FRC, functional residual capacity; lim. vol., limit volume; COVID-19, post-coronavirus disease 2019; COPD, chronic obstructive pulmonary disease; IPF, idiopathic pulmonary fibrosis; CHF, chronic heart failure.
This study compared MRP obtained at FRC and at RV and TLC in individuals with different health conditions. PImax and PIpeak obtained at FRC were lower than measures obtained at RV, as well as PEmax and PEpeak, which were lower when obtained at FRC compared to TLC. The mean differences between the measurements at FRC and at RV and TLC were similar among the five groups.
The most common method used to evaluate the force production of the respiratory muscles is the measurement of MRP against an occluded mouthpiece. This method can be useful in the assistance of diagnosis and prognosis of some diseases that are followed by a suspicion of respiratory muscle weakness, mainly in the presence of exercise intolerance and dyspnea, such as COPD.7-11 Post-COVID-19 individuals may also benefit from evaluating respiratory muscle strength, primarily in those requiring hospitalization.12 In addition, MRP are commonly used in the setting and evaluation of interventions, mainly during inspiratory muscle training.2-5
The protocol used for these measurements usually includes the maximal inspiratory effort obtained at RV, and maximal expiratory effort obtained at TLC.1 However, an urge to compare MRP obtained at different lung volumes in individuals with health conditions emerged after reviewing several studies claiming that lung volume would influence the results of MRP. Pioneer studies report that PImax decreases as lung volume increases, and PEmax decreases as lung volume decreases,14-16,21,28,38,39,41 raising possible explanations for this phenomenon, such as the changes in length/tension relationship of the respiratory muscles, the changes in the radius of curvature of these muscles in the different lung volumes, as well as the additional passive elastic recoil pressure of the respiratory system present when the measures are obtained at minimal volumes for PImax, and maximal volumes or PEmax. Measurements performed in individuals with health conditions associated with alterations of the lungs recoil (e.g.: COPD and IPF) could be more influenced by this factor.
For these reasons, we believed relevant changes would be observed when performing MRP at different lung volumes in individuals with different lung conditions. However, our hypothesis was not confirmed since we observed similar mean differences between PImax and PIpeak obtained at FRC and RV among the groups of individuals with different health conditions. The difference was around 8 to 13 cmH2O for PImax, and 7 to 14 cmH2O for PIpeak, which is relatively small in clinical practice.40 This difference is comparable with some results reported by other investigators with healthy individuals, ranging between 3 and 12 cmH2O.17,21,28,38,39,41 Langer et al.25 measured PImax at FRC and at RV in individuals with COPD and reported an increase of ∼16 cmH2O when the test was obtained at RV. Windisch et al.21 showed that peak and plateau pressures (both for inspiratory efforts) measured at FRC accounted for 84.3–90.5% of pressures at RV, and were highly correlated. In the present study, mean PImax obtained at FRC accounted for 81.6–87.9% of measures at RV, and mean PIpeak obtained at FRC accounted for 84.7–88.8% of measures at RV. Windisch et al.21 also suggested that PImax obtained at FRC and RV were comparable using regression parameters and between-subject variability.
Clanton and Diaz42 considered that when it is expected that PImax is small, such as in critically ill patients, it would be useful to take these measurements near FRC, where the influence of viscoelastic properties of the respiratory system would make a lower contribution to the final results since the amount of stored energy would be lower. The same authors suggested that these measurements would be useful for individuals without enough breath to adequately expire for the seconds required to achieve RV to perform PImax. Therefore, we believe that disregarding the lung volume in which PImax is performed, the measurement should be performed according to the instrument available. In some cases, it would be preferable at FRC volume. We highlight that the individuals assessed in the present study may experience increased respiratory muscle effort, associated with high ventilatory demand relative to inspiratory muscle capacity, and present dyspnea as a common symptom despite the different pathophysiology mechanisms for those with COPD,7 CHF,10 stroke,43 IPF,9 and post-COVID-19. For individuals post-COVID-19, we believe that they may present similar mechanisms compared to the individuals with IPF due to the clinical similarities, such as diffusing capacity of the lungs for carbon monoxide impairment, and signs of fibrosis.44 Therefore, raising a suspicion of inspiratory muscle weakness while evaluating these individuals is reiterated.
Expiratory pressures reflect the ability to cough and expectorate, which may be important for individuals with chronic respiratory diseases and neuromuscular diseases.45 The results of this study showed that measurements obtained at FRC were importantly lower than measurements obtained at TLC for PEmax and PEpeak. Similar mean differences between PEmax and PEpeak obtained at FRC and at TLC were observed among the groups of individuals with different health conditions. The difference was around 52 to 63 cmH2O for PEmax, and 48 to 54 cmH2O for PEpeak. Studies have compared these measurements, and observed a wide range of differences, from 22 to 72 cmH2O.17,28,38,41 The main reason for this difference may be the loss of force when the expiratory muscles shorten, through the force-length relationship. The Laplace equation may be also appropriate in this explanation. This equation defines that certain pressure in an enclosed system is proportional to wall tension and wall thickness and inversely proportional to the curvature radius. Therefore, when the abdominals get flatter at smaller volumes, i.e.: from TLC to FRC, the curvature radius increases and smaller pressures are developed.17 We believe that PEmax may be lower in many situations due to these reasons, not necessarily because the abdominals are weak. Clinically, the main reason for measuring PEmax is to evaluate cough function in individuals with greater loss of muscle function, e.g.: neuromuscular disease, and specific measures, such as the cough peak flow46 could be used for this purpose to avoid misreading results. In addition, we highlight that the inability to inflate the lungs may be the leading cause of reduced cough function in these individuals. This could lead to specific strategies to increase lung volume47 instead of improving expiratory muscle function.
For these reasons, the results of this study may be more clinically relevant when the evaluation of PImax is applicable since there are specific strategies - with specific instruments - for enhancing inspiratory pressure, and the use of inspiratory muscle training is increasing with individuals with different health conditions, which is not correspondent to the training of expiratory muscles. In addition, PImax measurements should be considered more clinically relevant due to the largest role of the inspiratory muscles for increased ventilatory demands.
One limitation of this study is that sample size calculation was not performed a priori, and the number was arbitrarily chosen to enable the data collection with five different health conditions. However, the data were normally distributed, and we were able to perform a strong statistical test, with well-defined p-values (with not even a tendency to achieve differences among conditions).
Future studies to investigate MRP obtained at different lung volumes in critically ill individuals, and with neuromuscular conditions may be relevant. Comparisons between these results and measurements obtained with age-matched healthy individuals could contribute to the investigation of reasons for differences between MRP obtained at different lung volumes.
This is the first study to evaluate MRP in individuals with different health conditions using an objective and digital system capable of obtaining the pressures at FRC, which may contribute to further studies and advances in this area.
ConclusionInspiratory and expiratory pressures obtained at FRC were lower than measures obtained at RV and TLC, respectively, with more relevant differences observed for the expiratory ones. The mean differences between the measurements at FRC and at RV and TLC were similar among individuals with different health conditions.
The authors acknowledge and thank Gabriela de Souza Matos, Bianca Carmona Rocha, Liliane Patrícia de Souza Mendes, Danielle Aparecida Gomes Pereira, Aline Scianni, Maria Tereza Alvarenga and Carolina Marinho for the support in recruiting individuals with different health conditions during the data collection. This work was partly financed by the Coordenação de Aperfeiçoamento de Pessoal de Nível Superior (CAPES – Brazil), Finance Code 001; the Conselho Nacional de Desenvolvimento Científico e Tecnológico (CNPq), Grant 309990/2017-3 and Fundação de Amparo à Pesquisa do Estado de Minas Gerais (FAPEMIG).


