


Reduced trunk and lower limb movement and hip and trunk muscles weakness may compromise the athletes’ performance on the modified Star Excursion Balance Test (mSEBT).
ObjectiveTo investigate the relationship of trunk and lower limb kinematics and strength with the performance on the mSEBT of runners at high risk of injury.
MethodsThirty-nine runners performed the mSEBT with the dominant limb as the support limb. An Inertial System was used to capture the trunk, hip, knee and ankle movement during the mSEBT. A handheld dynamometer was used to measure the strength of trunk extensors and lateral flexors muscles, and hip extensors, lateral rotators and abductors of the support limb. Multiple regressions were used to investigate if trunk and lower limbs kinematics and trunk and hip muscles strength are associated with performance during the mSEBT.
ResultsReduced hip flexion and greater knee flexion range of motion (ROM) were associated with anterior reach in the mSEBT (r2=0.45; p<.001), greater hip flexion ROM was associated with posteromedial reach (r2=0.15; p=.012) and greater knee flexion ROM was associated with posterolateral reach (r2=0.23; p<.001). Hip extensor strength was associated with posteromedial (r2=0.14; p=.017), posterolateral (r2=0.10; p=.038) and composite reaches (r2=0.16; p=.009).
ConclusionHip and knee kinematics in the sagittal plane explained 15–45% of the runners’ performance on the mSEBT and hip extensor strength explained 10–16% of the mSEBT performance. These findings provide useful information on the contribution of joints kinematics and strength when evaluating dynamic postural control in runners at high risk of injury.
The modified Star Excursion Balance Test (mSEBT) is a valid and reliable1,2 screening tool to evaluate athletes’ dynamic postural control.3 During this test, the athlete is required to maintain single lower limb support while the contralateral limb reaches as far as possible in three directions. Performance during the mSEBT is determined based on the farthest reach in each direction, and on the sum of the distances reached in these directions.4 Previous studies have demonstrated that the performance on the mSEBT predicts the occurrence of lower limbs injuries in athletes, such as chronic ankle instability and hamstring strain.3,5,6 For example, basketball players with more than four centimeters of difference between limbs in the anterior reach, and with composite reach score lower than 94% of the lower limb length, were more susceptible to lower limb injury.5 These findings, along with the low cost and easiness to apply the mSEBT, contributed to its increased use in sports clinical settings to identify athletes at increased risk of injury.
The performance on the mSEBT requires movement in multiple body segments and joints to reach maximum distance.7 In this sense, each joint movement pattern and muscles strength may influence the performance during the test.8–10 It has been shown that trunk movements11 and hip muscles strength12,13 significantly influence mSEBT performance in non-athletes. For example, previous studies demonstrated that hip abductor and extensor strength of the support limb is associated with non-athletes performance on the mSEBT.12,13 The same relationship may occur in athletes. However, studies involving this population are scarce. In addition, trunk movements are frequently used as a strategy to maintain balance during postural control tasks,14 such as the mSEBT. Therefore, trunk muscles strength may also influence the performance on the mSEBT. The mSEBT is widely used as a screening test during pre-season of different sports that include single leg support, such as running.15 Hegedus et al.16 demonstrated that among 14 physical performance tests commonly used in athletes, only the mSEBT could help identify athletes in high risk of injury. Additionally, training for a competition, high dosage of weekly training, and running on concrete surfaces are injury risk factors for runners.17,18
This study investigated the relationship between trunk, hip, knee, and ankle kinematics and trunk and hip muscles strength of the support limb and the performance during the mSEBT in runners at high risk of injury. Better understanding about these relationships could guide movement and muscle strength assessment and training. We hypothesized that, for the anterior reach, trunk extension angle, hip and knee flexion angles and ankle dorsiflexion angle would be associated with performance on the mSEBT. For the posteromedial reach, trunk ipsilateral flexion angle, hip and knee flexion angles and ankle dorsiflexion angle would be associated with performance on the mSEBT. For the posterolateral reach, contralateral trunk flexion angle, hip and knee flexion angles and ankle dorsiflexion angle would be associated with performance on the mSEBT. Finally, trunk and hip muscle strength would be associated with performance in the three directions of the mSEBT.
MethodsParticipantsThe sample size was determined using the G*Power software with the following input data: linear multiple regression model, statistical power of 80%, six predictors, significance level of 0.05, and an expected effect size of 0.54 (based on a pilot study with 10 participants). This resulted in an estimated minimum sample size of 33 participants. The runners were recruited by convenience for this study. The inclusion criteria were: (i) age between 18 and 60 years old; (ii) at least 6 months of experience in running outdoors; (iii) run on concrete surfaces, be currently preparing for a competition and training more than 30km per week, which increases risk of injury17,18; (iv) body mass index lower than 30kg/m2 – to reduce the influence of soft tissues on the quality of filming; and (v) no history of injuries or surgeries on the lower limbs and trunk in the past three months. The exclusion criteria were (i) report of discomfort or pain during data collection; (ii) inability to perform the procedures of data collection; and (iii) technical problems during kinematics assessment. None of the participants were excluded. Each athlete signed a consent form approved by the Ethical Research Committee of the Universidade Federal de Minas Gerais, Belo Horizonte, Minas Gerais, Brazil (number 65118017.5.0000.5149).
ProceduresInitially, in this cross-sectional study, anthropometric data and training load (i.e. time and distance run per week) were collected. Lower limb dominance was defined based on the runner’s answer to the following question: what leg would you use to kick a ball as hard as possible? Following this, a handheld dynamometer (microFET2; Hoggan Scientific, LLC, Salt Lake City UT, USA) was used to measure the isometric strength of the trunk and hip muscles of the dominant limb. The dominant limb was chosen because it accepts more loading during running.19 For all of the strength tests, the athlete performed one familiarization trial. Then, the athlete performed maximal muscle isometric contractions for five seconds. This procedure was repeated three times, with intervals of 30s between trials. The examiner provided verbal encouragement to promote maximal effort.
To evaluate trunk extensor strength, the athlete was in prone position, with the arms by the side and elbows extended. The dynamometer was positioned between the superior angles of the scapulas and fixed by a rigid strap. In addition, the pelvis was fixed to the treatment table by rigid strap20 (Fig. 1A).
, trunk lateral flexors (B), hip abductors (C), hip lateral rotators (D) and hip extensors (E).")
To evaluate trunk lateral flexors strength, the athlete was positioned in side-lying with the arms crossed on the chest. The dynamometer was positioned below the axillary fossa and fixed by rigid strap. The pelvis was fixed to the table by rigid strap (Fig. 1B).
To evaluate hip abductors strength, the athlete was positioned in side-lying, arms in front of the body, pelvis stabilized by rigid strap and hip positioned in neutral position in the frontal and sagittal planes. The dynamometer was positioned five centimeters above the knee joint21 (Fig. 1C).
To evaluate hip external rotator strength, the athlete was in prone position with the knee flexed to 90° and the contralateral knee extended. A rigid strap was used to stabilize the pelvis on the treatment table. The dynamometer was positioned on the medial aspect of the shank, five centimeters proximal to the medial malleolus.22 If the examiner noticed any compensatory movements (i.e. hip adduction or trunk and pelvis rotation), the test was repeated (Fig. 1D).
Finally, to evaluate hip extensor strength, the athlete was in prone position with the knee flexed to 90° and the contralateral knee extended. The dynamometer was positioned proximally to the popliteal fossa and fixed by a strap. In addition, a rigid strap fixed the pelvis on the treatment table23 (Fig. 1E). In a pilot study with 7 participants and two days of data collection seven days apart, the strength evaluations demonstrated good to excellent intra-rater reliability: trunk extensors (Intraclass Correlation Coefficient [ICC3,3]: 0.96; 95% Confidence Interval [95% CI]: 0.77, 0.99; Standard Error of Measurement [SEM]: 3.36Nm/kg); trunk lateral flexors (ICC3,3: 0.89; 95% CI: 0.41, 0.98; SEM: 3.60Nm/kg); hip external rotators (ICC3,3: 0.89; 95% CI: 0.39,0.98; SEM: 2.96Nm/kg); hip abductors (ICC3,3: 0.89; 95% CI: 0.39, 0.98; SEM: 4.37Nm/kg); hip extensors (ICC3,3: 0.85; 95% CI: 0.18, 0.97; SEM: 7.46Nm/kg).
The trunk and support lower limb angular displacement during the performance on the mSEBT was evaluated by an Inertial and Magnetic Measurements Units (IMMU) system. The IMMU is a micro-electronic device consisting of four sensors composed of accelerometers (16g), gyroscopes (2000°/s) and triaxial magnetometers (16bits)24,25 that collected data at 100Hz. The sensors data were transmitted via Wi-Fi to the smartphone software Smove® (Belo Horizonte, Brazil), where ankle, knee, hip and trunk angles in the sagittal and frontal planes during the mSEBT were computed.
The athletes performed the mSEBT with the dominant lower limb as the support limb, with hands on waist, on three metric tapes oriented in three different directions (Fig. 2). The first tape was oriented in the anterior direction and was separated by 135° from the other metric tapes, which were oriented on the posteromedial and posterolateral directions with 90° separation from each other. The athletes performed six trials of familiarization in each direction.4 Then, after five minutes of rest, a previously trained examiner positioned the IMMU on the following locations: interscapular, sacrum, distal portion of the thigh and leg of the dominant lower limb. Then, with the athlete in orthostatic position, the offsets of the IMMU sensors orientation were collected. Following this, the athlete stood barefoot on the support limb, with the distal aspect of the foot at the intersection point of the metric tapes. While maintaining the support limb, the athlete was asked to reach three times with the swing limb in the anterior direction, followed by three trials in the posteromedial direction, and three trials in the posterolateral direction. The athlete was not allowed to remove the heel of the support limb from the floor. In addition, the trial was repeated if the athlete lost balance during the test.1 In a pilot study with 10 participants, the mSEBT presented excellent intra-rater reliability: anterior reach (ICC3,3: 0.97; 95% CI: 0.89, 0.99; SEM: 1.77cm); posteromedial reach (ICC3,3: 0.97; 95% CI: 0.90, 0.99; SEM: 2.59cm); posterolateral reach (ICC3,3: 0.93; 95% CI: 0.72, 0.98; SEM: 4.62cm). The IMMU system presented good to excellent intra-rater reliability to assess trunk and lower limb movement. The mean ICC3,3 of the IMMU system during the performance of the mSEBT in the three directions were the following: trunk frontal plane, ICC3,3 of 0.94; trunk sagittal plane, ICC3,3 of 0.80; hip frontal plane, ICC3,3 of 0.84; hip sagittal plane, ICC3,3 of 0.88; knee sagittal plane ICC3,3 of 0.84; and ankle sagittal plane ICC3,3 of 0.81. All evaluations were also performed with the interval of seven days. Finally, the athletes’ performance during the mSEBT was also recorded with two video cameras (Sony HDR CX405® – Tokyo, Japan) at a frequency of 50Hz. The cameras were positioned anteriorly and laterally to the athlete on a tripod, at a height of 60cm and a distance of 3.5m. The Smove® software synchronized the two-dimensional (2D) video data with the IMMU data.
, posteromedial (B) and posterolateral (C) directions.")
The lower limb length was collected with the athlete in supine position. First, the athlete lifted the hips off and then back to the table. Then, the examiner passively straightened the legs to equalize the pelvis. The limb length was measured from the anterior superior iliac spine to the most distal portion of the ipsilateral medial malleolus with tape measure.4
Data reductionThe mean of the distance reach by the hallux of the swing limb during the three trials in each direction of mSEBT was calculated26 and these values were normalized by the athlete’s lower limb length - distance divided by limb length and multiplied by 100.4 The composite reach distance was calculated by summing the three reach directions divided by three times the lower limb length, and then multiplied by 100.4
The fusion filter27 was used to acquire the angles data from the raw data of the IMMU sensors orientation. The Smove® software provided the IMMU sensors orientation data in form of quaternions, which were converted in rotational matrices. Then, the joints orientation were defined as the product of the distal segment sensor matrix by the transposed matrix of the sensor positioned on the proximal segment, as follows: trunk lateral and anterior flexion and extension were obtained from the product of the sacrum sensor matrix by the transposed matrix of the sensor positioned on the interscapular region; hip flexion/extension and adduction/abduction were obtained from the product of the thigh sensor matrix by the transposed matrix of the sensor positioned on the sacrum; knee flexion/extension were obtained from the product of the leg sensor matrix by the transposed matrix of the sensor positioned on the thigh; and ankle dorsiflexion/plantarflexion were obtained from the transposed matrix of the sensor positioned on the leg with respect to the floor orientation. Finally, these values were converted in Euler angles. We used the Euler sequence ZYX, where “Z” represents the sagittal plane, “Y” represents the transverse plane and “X” represents the frontal plane.28 The angular position values of these variables at maximal reach in each direction of the mSEBT were extracted. The examiner visually determined the moment of maximum reach in each direction of the mSEBT in the angular displacement data based on the 2D video data.
To estimate the joints’ isometric torque capacity, the mean force value, in Newtons, was multiplied by the distance, in meters, from the dynamometer position to the joint axis of each test and then normalized by the athlete body mass (Nm/kg).29
Statistical analysisDescriptive statistics were performed for all of the variables. The joints angles and strength and reach distances during the mSEBT were tested for normal distribution using the Shapiro-Wilk test and presented normal distribution. Stepwise multiple regressions analysis were performed to identify if trunk, hip, knee and ankle angles were associated with performance during the mSEBT in each direction. In addition, stepwise multiple regressions were performed to identify if trunk and hip strength were associated with mSEBT performance in each direction and the composite reach distance. The significance was set at α=0.05. SPSS 19 software (SPSS Inc., Chicago, IL) was used for all analyses.
ResultsThirty-nine outdoor runners (14 women and 25men) participated in this study. The sample characteristics were mean±standard deviation: age of 41.1±9.96 years, body mass of 71.24±12.12kg, height of 172±9.7cm, body mass index of 23.93±2.42kg/m², time of training of 7.69±7.05 years and dosage of training of 43.27±13.20km/week. The mean normalized reach distances were 64.39±5.07% in the anterior direction, 99.01±6.79% in the posteromedial direction, 97.93±8.56% in the posterolateral direction and 87.11±5.40% in the composite reach.
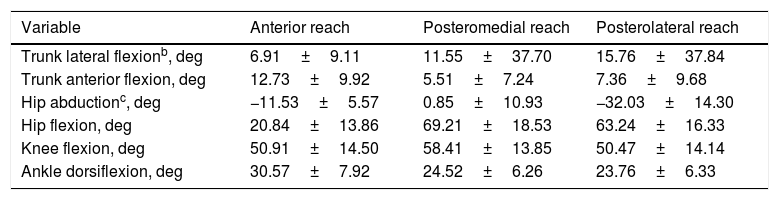
Table 1 presents the trunk and support lower limb angles during the mSEBT. Table 2 presents trunk and hip isometric torque.
Trunk and support limb hip, knee, and ankle angular displacement data during the modified Star Excursion Balance Testa.
| Variable | Anterior reach | Posteromedial reach | Posterolateral reach |
|---|---|---|---|
| Trunk lateral flexionb, deg | 6.91±9.11 | 11.55±37.70 | 15.76±37.84 |
| Trunk anterior flexion, deg | 12.73±9.92 | 5.51±7.24 | 7.36±9.68 |
| Hip abductionc, deg | −11.53±5.57 | 0.85±10.93 | −32.03±14.30 |
| Hip flexion, deg | 20.84±13.86 | 69.21±18.53 | 63.24±16.33 |
| Knee flexion, deg | 50.91±14.50 | 58.41±13.85 | 50.47±14.14 |
| Ankle dorsiflexion, deg | 30.57±7.92 | 24.52±6.26 | 23.76±6.33 |
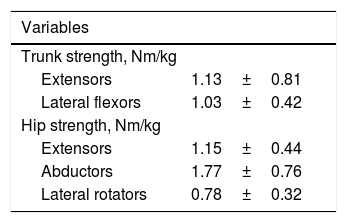
Mean and standard deviation of the joints’ isometric torque capacity multiplied by the distance from the dynamometer position to the joint axis and then normalized by the athlete body mass (Nm/kg).
| Variables | |
|---|---|
| Trunk strength, Nm/kg | |
| Extensors | 1.13±0.81 |
| Lateral flexors | 1.03±0.42 |
| Hip strength, Nm/kg | |
| Extensors | 1.15±0.44 |
| Abductors | 1.77±0.76 |
| Lateral rotators | 0.78±0.32 |
The regression model revealed that hip and knee angles were associated with anterior reach (F=19.98; r=0.67; r2=0.45; p<0.001), hip angular displacement was associated with posteromedial reach (F=7.00; r=0.39; r2=0.15; p=0.012) and knee angular displacement was associated with posterolateral reach (F=11.73; r=0.48; r2=0.23; p=0.001). Specifically, smaller hip flexion and greater knee flexion were associated with greater anterior reach in the mSEBT. In addition, greater hip flexion was associated with greater posteromedial reach and greater knee flexion was associated with greater posterolateral reach.
Muscle strength was associated with posteromedial reach (F=6.18; r=0.37; r2=0.14; p=0.017), posterolateral reach (F=4.64; r=0.33; r2=0.10; p=0.038) and composite reach distance (F=7.62; r=0.40; r2=0.16; p=0.009). Specifically, strength of the hip extensors was associated with greater posteromedial reach, posterolateral reach and composite reach. Table 3 presents stepwise multiple regressions results.
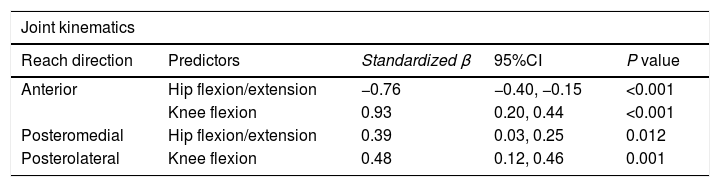
Stepwise multiple regressions results for joint kinematics and muscle strength associated with performance on the modified Star Excursion Balance Test.
| Joint kinematics | ||||
|---|---|---|---|---|
| Reach direction | Predictors | Standardized β | 95%CI | P value |
| Anterior | Hip flexion/extension | −0.76 | −0.40, −0.15 | <0.001 |
| Knee flexion | 0.93 | 0.20, 0.44 | <0.001 | |
| Posteromedial | Hip flexion/extension | 0.39 | 0.03, 0.25 | 0.012 |
| Posterolateral | Knee flexion | 0.48 | 0.12, 0.46 | 0.001 |
| Muscle strength | ||||
|---|---|---|---|---|
| Reach direction | Predictors | Standardized β | 95%CI | P value |
| Posteromedial | Hip extensors | 0.37 | 1.05, 10.28 | 0.017 |
| Posterolateral | Hip extensors | 0.33 | 0.38, 12.22 | 0.038 |
| Composite | Hip extensors | 0.40 | 1.31, 8.53 | 0.009 |
*p<.05.
This study demonstrated that smaller hip flexion and greater knee flexion of the support limb of runners at high risk of injury were associated with anterior reach distance in the mSEBT. In addition, greater hip flexion and greater knee flexion were associated with posteromedial and posterolateral reach, respectively. Furthermore, hip extensor strength of the support limb was associated with posteromedial reach, posterolateral reach and composite reach. Finally, trunk and hip muscle strength were not associated with anterior reach in the mSEBT. These findings may be explained by the strategies adopted by the runners to counterbalance the effects of the swing limb movement on the body center of mass position and consequently maintain balance during the mSEBT.
Smaller hip flexion and greater knee flexion of the support limb explained 45% of the anterior reach variance in the mSEBT. The swing limb movement during the performance in the anterior reach displaces the body center of mass anteriorly. Therefore, the runner may increase knee flexion30,31 and reduce hip flexion31 of the support limb to posteriorly displace the body center of mass and consequently maintain balance in single limb support. This may explain the fact that increased knee flexion and reduced hip flexion were associated with the runners’ performance in the anterior reach. In clinical settings, these results suggest that poor performance in the anterior reach of the mSEBT requires further evaluation and intervention on factors that may limit knee flexion (e.g. quadriceps weakness12) and control of hip flexion (e.g. hip extensor weakness13) in closed kinetic chain, which may help to improve the runner’s performance on the mSEBT.
Hip flexion of the support limb explained 15% of the variance in the mSEBT posteromedial reach distance, and knee flexion of the support limb explained 23% of the variance in the mSEBT posterolateral reach distance. These test directions require hip extension of the swing limb, which posteriorly displaces the body’s center of mass. Therefore, to maintain the body’s center of mass within the base of support, the runner must flex the hip and the knee32 of the support limb. The fact that hip flexion was associated with performance in the posteromedial direction and knee flexion was associated with performance in the posterolateral direction suggests that factors that limit these movements should be further evaluated in runners demonstrating poor performance in these reach directions. For example, hip extensor weakness may limit hip flexion and quadriceps weakness may limit knee flexion, respectively. In fact, previous studies have demonstrated that quadriceps12 and hip extensor weakness13 compromise the performance on the mSEBT. These findings are corroborated by the association between hip extensor strength and performance in the posteromedial direction demonstrated by the present study.
Hip extensor strength explained 14% of the posteromedial reach, 10% of the posterolateral reach and 16% of the composite reach variance of the mSEBT. These results may be explained by the fact that during the posteromedial and posterolateral reach, the trunk and pelvis are anteriorly positioned to the hip joint axis. Therefore, hip extensors are recruited to resist the external hip flexor moment resulting from the gravity force acting on the trunk and pelvis.14 These results are in accordance with the findings of Hubbard et al.13 demonstrating that hip extensor strength is associated with the performance in the posteromedial and posterolateral directions of the mSEBT.
The trunk movement was not associated with performance on the mSEBT of our runners’ sample. Contrary to these results, Kang et al.7 demonstrated that trunk movement predicts the performance of non-athletes in the mSEBT. Athletes have stronger lower limb muscles than non-athletes. Therefore, they may be able to use greater lower limb range of motion and consequently not depend on trunk movements to maintain the body center of mass inside the support base during the performance in the mSEBT. Alternatively, the use of an inertial system instead of an optoelectronic system to capture trunk movement may explain these contradictory findings.33
Most of the results of this study are in accordance with previous studies with non-athletes. For example, Robinson and Gribble32 found that hip and knee flexion explained 78.1% of the anterior reach and hip flexion explained 88.6% of the posteromedial reach in non-athletes. Kang et al.7 demonstrated that hip flexion is the single best kinematic predictor of the posteromedial reach distance, explaining 60% of the performance in this direction in non-athletes. Regarding hip strength, Wilson et al.34 showed that hip extensors strength of non-athletes was associated with the performance on the Y-Balance Test, which is similar to the mSEBT. These authors also found the strongest association between hip abduction strength and the Y-Balance performance. Therefore, it is likely that similar strength and movement factors influence athletes and non-athletes performance during the mSEBT. Future studies should investigate if these relationships are influenced by level of practice and also establish reference values for runners. In addition, considering that poor performance on mSEBT is related to the occurrence of injury,3,5,6 the findings of the present study suggest the assessment of hip extensors strength35 and lower limb movement in runners at high risk of injuries.
This study had some limitations. First, we evaluated trunk and lower limb movement only in the sagittal and frontal planes. Future studies should investigate the transverse plane, as it is likely that rotational movements also contribute to mSEBT performance. Second, maximal isometric strength may not be the best variable to improve understanding about the relationship between trunk and hip muscles’ function and performance on this test.36 Future studies should investigate the relationship between the mSEBT and different muscle functions, such as concentric and eccentric strength and endurance. Finally, ankle dorsiflexion ROM, hip adduction and flexion strengths and knee and ankle strength information could have improved our understanding about the relationship between strength and movement and the performance of mSEBT.
ConclusionSmaller hip flexion and greater knee flexion are associated with anterior reach distance of the mSEBT in runners at high risk of injury. Hip and knee flexion are associated with posteromedial and posterolateral reach distances, respectively, and knee flexion is associated with posterolateral reach distance. In addition, hip extensors strength is associated with posteromedial and posterolateral reach distances and the composite reach of the mSEBT. These findings provide useful information to clinicians about the contribution of the support limb movement and hip strength to the performance of the mSEBT.
Conflicts of interestThe authors declare no conflicts of interest.
This study was financed in part by the Coordenação de Aperfeiçoamento de Pessoal de Nível Superior – Brasil (CAPES) – Finance Code 001. The authors would like to thank the Centro de Treinamento Esportivo – UFMG, Fundação de Amparo à Pesquisa de Minas Gerais (FAPEMIG) and Conselho Nacional de Desenvolvimento Científico e Tecnológico (CNPq) for their contributions and support to this project.


