

Low back pain (LBP) is the leading cause of disability worldwide, and the burden of LBP is expected to increase in coming decades, particularly in middle-income countries. There is a lack of large and high-quality studies investigating the prevalence of LBP in Brazil.
ObjectiveTo estimate the point, one-year, and lifetime prevalence of non-specific LBP in adults from the city of São Paulo, Brazil.
MethodsThis community-based, cross-sectional study recruited 3000 participants in flow point locations randomly selected from census sectors of São Paulo. Interviews and self-administered questionnaires were used to estimate point prevalence, one-year prevalence, and lifetime prevalence of LBP.
ResultsThe estimate of point prevalence was 9.8% (95% CI: 8.8, 11.0), one-year prevalence was 48.1% (95% CI: 46.3, 49.9), and lifetime prevalence was 62.6% (95% CI: 60.8, 64.3). One-year and lifetime prevalence were higher in females, obese people, people insufficiently active and sedentary, current smokers, people who are exposed to repetitive movements, crouched or kneeling position, people dissatisfied with their job, people a little bit or very stressed, a little bit or very anxious, and a little bit depressed, and people with good and fair or poor general health. Lifetime prevalence was also higher in people exposed to standing positions and exposure to carrying weight.
ConclusionsThe high point, one-year, and lifetime prevalence of LBP in Brazil indicates that there is a need for coordinated efforts from government, the private sector, universities, health workers, and civil society to deliver appropriate management of LBP in middle-income countries.
Low back pain (LBP) is an extremely common health condition and is responsible for activity limitation, work absence, and financial burden globally.1–3 One of the most common approach to quantify the burden of LBP is by measuring country-specific prevalence data.1 There are several measures that have been used in the literature to investigate prevalence of LBP, and the differences in measurements are related to definition of LBP episode used, definition of prevalence, and population studied.4–6 A LBP episode can be defined according to the duration of pain (e.g. at least one day, chronic pain), pain severity (e.g. intensity of pain score), and/or consequences of pain (e.g. pain that interfere with daily activities, medical care seeking, sick leave). The prevalence definitions are defined according to the length of time evaluated (e.g., point prevalence, one-year, and lifetime).-In addition, the population studied are defined according to the place, age, and/or profession (e.g., community, adults, workers, athletes, etc.).3,7,8
The latest systematic review on global prevalence of LPB reported the mean point prevalence as 18.3% (SD 11.7),1,9–11 the mean one-month prevalence as 30.8% (SD 12.7),1,10,11 and the mean one-year prevalence as 38.0% (SD 19.4).1,9,10 However, due to significant methodological heterogeneity between the included studies of this systematic review, summary measures of mean prevalence should be interpreted with caution. In addition, most of the evidence on prevalence is derived from high income countries, and the few studies from low and middle income countries recruited specific samples of workers12–15 or people living in farming communities.2,16–18 This sampling strategy ignores the reality that many people in low and middle income countries now live in urban settings.
According to estimates of the Global Burden of Disease Study,19 in 2017 approximately 25 million Brazilians had LBP, with an increase of 26.83% compared to the prevalence rate observed in 1990.19 A systematic review20 investigating prevalence of LBP in Brazil (19 387 individuals) described that the estimate of prevalence of LBP in the last 12 months is more than 50% in adults.20 However, measures of mean prevalence of this review should be interpreted with caution due to significant heterogeneity of methods, data collection, types of study population, and results.20 Most studies lacked sample size calculations, focused on specific groups (e.g., workers, farming communities), lacked forms of random selection, lacked use of an acceptable definition of LBP episode, and did not present prevalence estimates for different duration of time (e.g., point prevalence, one-year, and lifetime).20 In addition, no study presented prevalence estimates according to demographic characteristics (e.g. sex, age groups, education level).20
We are unaware of any large, high-quality prevalence study conducted in a developing, upper-middle income country, such as Brazil, that underwent a sample size calculation, used a random selection to select participants, used an acceptable definition of LBP (activity-limiting LBP that lasts for at least 1 day),1 described prevalence estimates for different length of time (e.g., point prevalence, one-year, and lifetime). Therefore, the primary aim of this study was to provide estimates of point prevalence, one-year prevalence, and lifetime prevalence of non-specific LBP in adults from the city of São Paulo, Brazil. The second aim was to present prevalence estimates according to demographic characteristics.
MethodsStudy design and settingThis community-based cross-sectional study recruited adults living in the urban area of São Paulo city, Brazil, from August 2016 to July 2018. Ethical clearance was granted by the Universidade Cidade de São Paulo (CAAE 44662415.0.0000.0064). Informed consent has been obtained from all participants.
People walking on the street (e.g., public squares, busy streets) were invited to participate in the study, including visitors or tourists.
ParticipantsInclusion criteria were adults aged ≥18 years, living in the urban area of São Paulo, Brazil. The city of São Paulo is divided into 97 census sectors.21 In this study 10 sectors were randomly selected for data collection. In addition, flow point locations (e.g. public squares, busy streets, open markets) for data collection were also randomly selected.22 The selected census sectors, by zones of the city of São Paulo were: Barra Funda and Alto de Pinheiros (West zone); Tucuruvi and Santana (North zone); Campo Belo and Campo Grande (South zone); Aricanduva and Itaquera (East zone); and Vila Matilde and Água Rasa (Southwestern zone).21
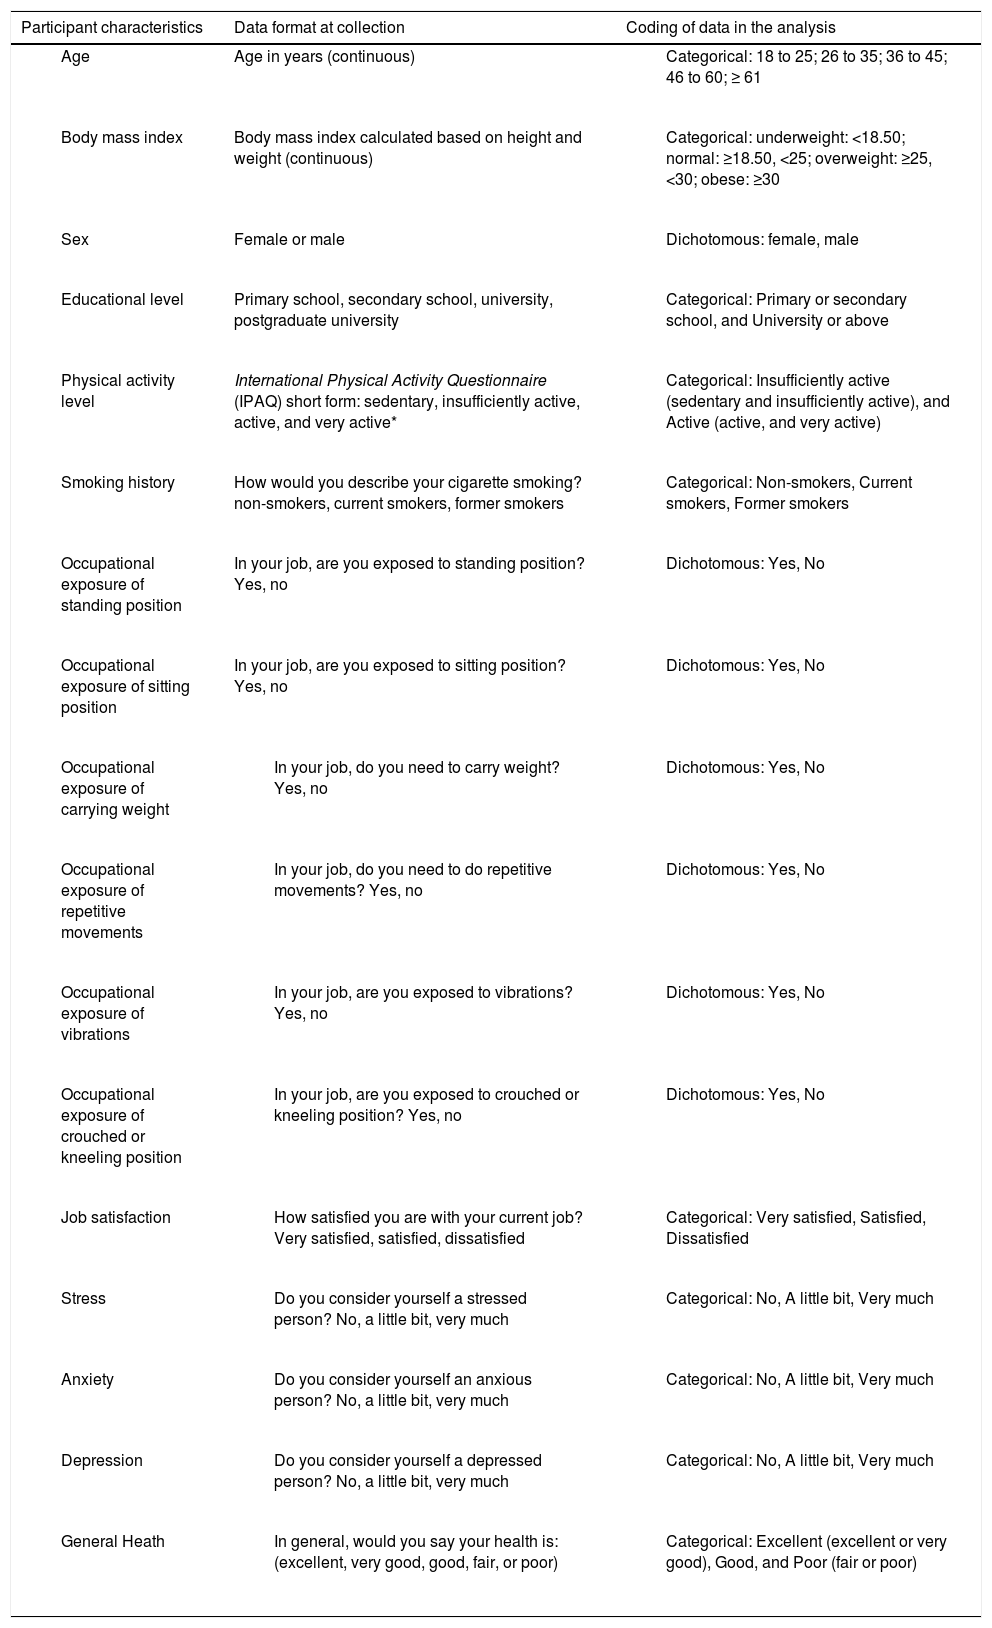
VariablesData were obtained by interview, with participants providing informed consent. We collected the estimates of LBP prevalence, demographic data, information about LBP experience, lifestyle, occupational, and psychological characteristics. Table 1 describes all characteristics collected, how they were measured, and how they were coded in the analyses.
Description of the variables, data format at collection, and coding of data in the analysis.
| Participant characteristics | Data format at collection | Coding of data in the analysis |
|---|---|---|
| Age in years (continuous) |
|
| Body mass index calculated based on height and weight (continuous) |
|
| Female or male |
|
| Primary school, secondary school, university, postgraduate university |
|
| International Physical Activity Questionnaire (IPAQ) short form: sedentary, insufficiently active, active, and very active* |
|
| How would you describe your cigarette smoking? non-smokers, current smokers, former smokers |
|
| In your job, are you exposed to standing position? Yes, no |
|
| In your job, are you exposed to sitting position? Yes, no |
|
|
|
|
|
|
|
|
|
|
|
|
|
|
|
|
|
|
|
|
|
|
|
|
|
|
|
|
Sedentary was classified when the participant did not practice any physical activity for at least 10 min/week. Insufficiently active was classified when the participant practiced physical activity for at least 10 min/week; however, it was insufficient to be classified as active. Active was classified when the participant practiced (a) vigorous activity ≥ 3 days/week for at least 20 min/session; (b) moderate activity or walk ≥ 5 days/week for at least 30 min/session; (c) any activity in sum ≥ 5 days/week for at least ≥ 150 min/week. Very active was classified when the participant practiced (a) vigorous activity ≥ 5 days/week for at least 30 min/session; b) vigorous activity or walk ≥ 3 days/week for at least 20 min/session + moderate activity or walk ≥ 5 days/week for ≥ 30 min/session.
The primary outcome was an episode of nonspecific LBP. We defined an episode of nonspecific LBP as “pain in the area between the 12th rib and buttock crease not attributed to a specific diagnosis”.11,23–25 To facilitate accurate identification of the lumbar region a body chart was used illustrating the lumbar region with dotted lines. The estimates of prevalence were related to three distinct time periods: point prevalence (prevalence at the time of the interview), one-year prevalence (prevalence in the last year), and lifetime prevalence (prevalence at some point in their life).
Point prevalence was measured by the questions: (1) Are you feeling low back pain (pain between the last rib and the bottom of the buttocks lasting more than 24 h, preceded by 30 days without pain) at this moment? If yes, (2) Did the pain interfere in your usual activities or change your daily routine for more than one day?
One-year prevalence was measured by the questions: (1) Have you had low back pain (pain between the last rib and the bottom of the buttocks lasting more than 24 h, preceded by 30 days without pain) in the last year? If yes, (2) Did the pain interfere in your usual activities or change your daily routine for more than one day?
Lifetime prevalence was measured by the questions: (1) Have you ever had low back pain (pain between the last rib and the bottom of the buttocks lasting more than 24 h, preceded by 30 days without at some point in your life?)? If yes, (2) Did the pain interfere in your usual activities or change your daily routine for more than one day?
Information about pain intensity (measured with a 0–10 numerical pain rating scale),26 and disability (measured with the 0-24 Roland Morris Disability Questionnaire)27,28 was also collected for those who reported point prevalence at the time of the interview. All data were collected according to the consensus guide for standardization of LBP prevalence studies.3
Sample size calculationAccording to the Brazilian Institute of Geography and Statistics 2010 census,21 the city of São Paulo had a population of 11,253,503 inhabitants, the estimated population described in 2014 was of 11,895,893 inhabitants. The sample size calculation was based on precision of 1.5%, a point prevalence estimate of 23% in a population of 11 million, and a 95% confidence interval (CI).29 The calculation was conducted using an online calculator for sample sizes.30 To achieve precise prevalence estimates, a total of 3000 participants was needed, consisting of 300 individuals (150 of each sex) in each selected sector in São Paulo.
Statistical analysisPoint prevalence, one-year prevalence, and lifetime prevalence was described as percentages and their respective 95% CI, by dividing the number of cases identified from screening by the total number of participants. We also described the prevalence stratifying participants into groups based upon age, sex, body mass index (BMI), educational level, physical activity level, smoking history, occupational exposures (standing position, sitting position, carrying weight, repetitive movements, exposed to vibrations, crouched or kneeling position), job satisfaction, stress, anxiety, depression, and general health. This was conducted by using a descriptive and exploratory analysis. All analyses were performed using the statistical software SPSS, version 22.0.
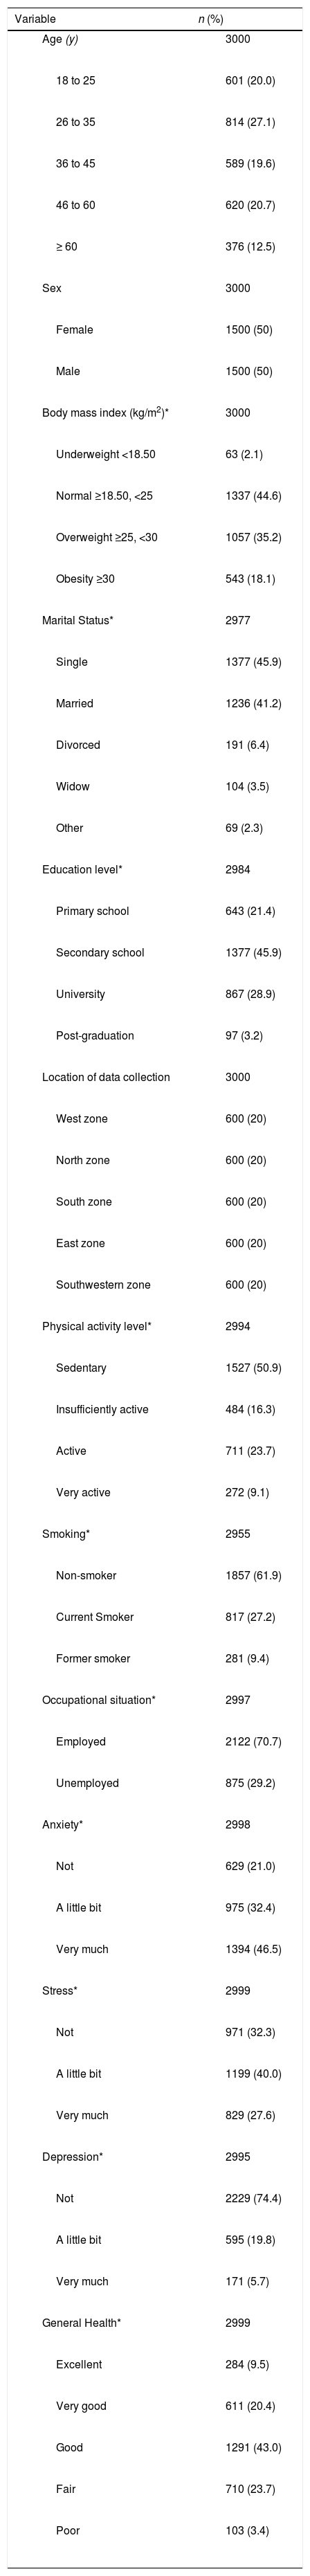
ResultsParticipantsBetween August 2016 and July 2018, a total of 3441 potential participants were invited to participate in the study. Of the 3441 potential participants, 3000 met the inclusion criteria and entered the study - 1500 (50%) women and 1500 (50%) men (Fig. 1). The mean ± SD age of participants was 40.0 ± 15.4 years, 45.9% were single, and 50.9% reported being sedentary. Table 2 presents the characteristics of participants at baseline.

Baseline demographic characteristics of the study participants.
| Variable | n (%) |
|---|---|
|
|
|
|
|
|
|
|
|
|
|
|
|
|
|
|
|
|
|
|
|
|
|
|
|
|
|
|
|
|
|
|
|
|
|
|
|
|
|
|
|
|
|
|
|
|
|
|
|
|
|
|
|
|
|
|
|
|
|
|
|
|
|
|
|
|
|
|
|
|
|
|
|
|
|
|
|
|
|
|
|
|
|
|
|
|
|
|
|
|
|
|
|
|
|
|
|
|
|
|
|
|
|
|
|
|
|
|
|
|
|
|
|
|
|
|
|
|
|
|
|
|
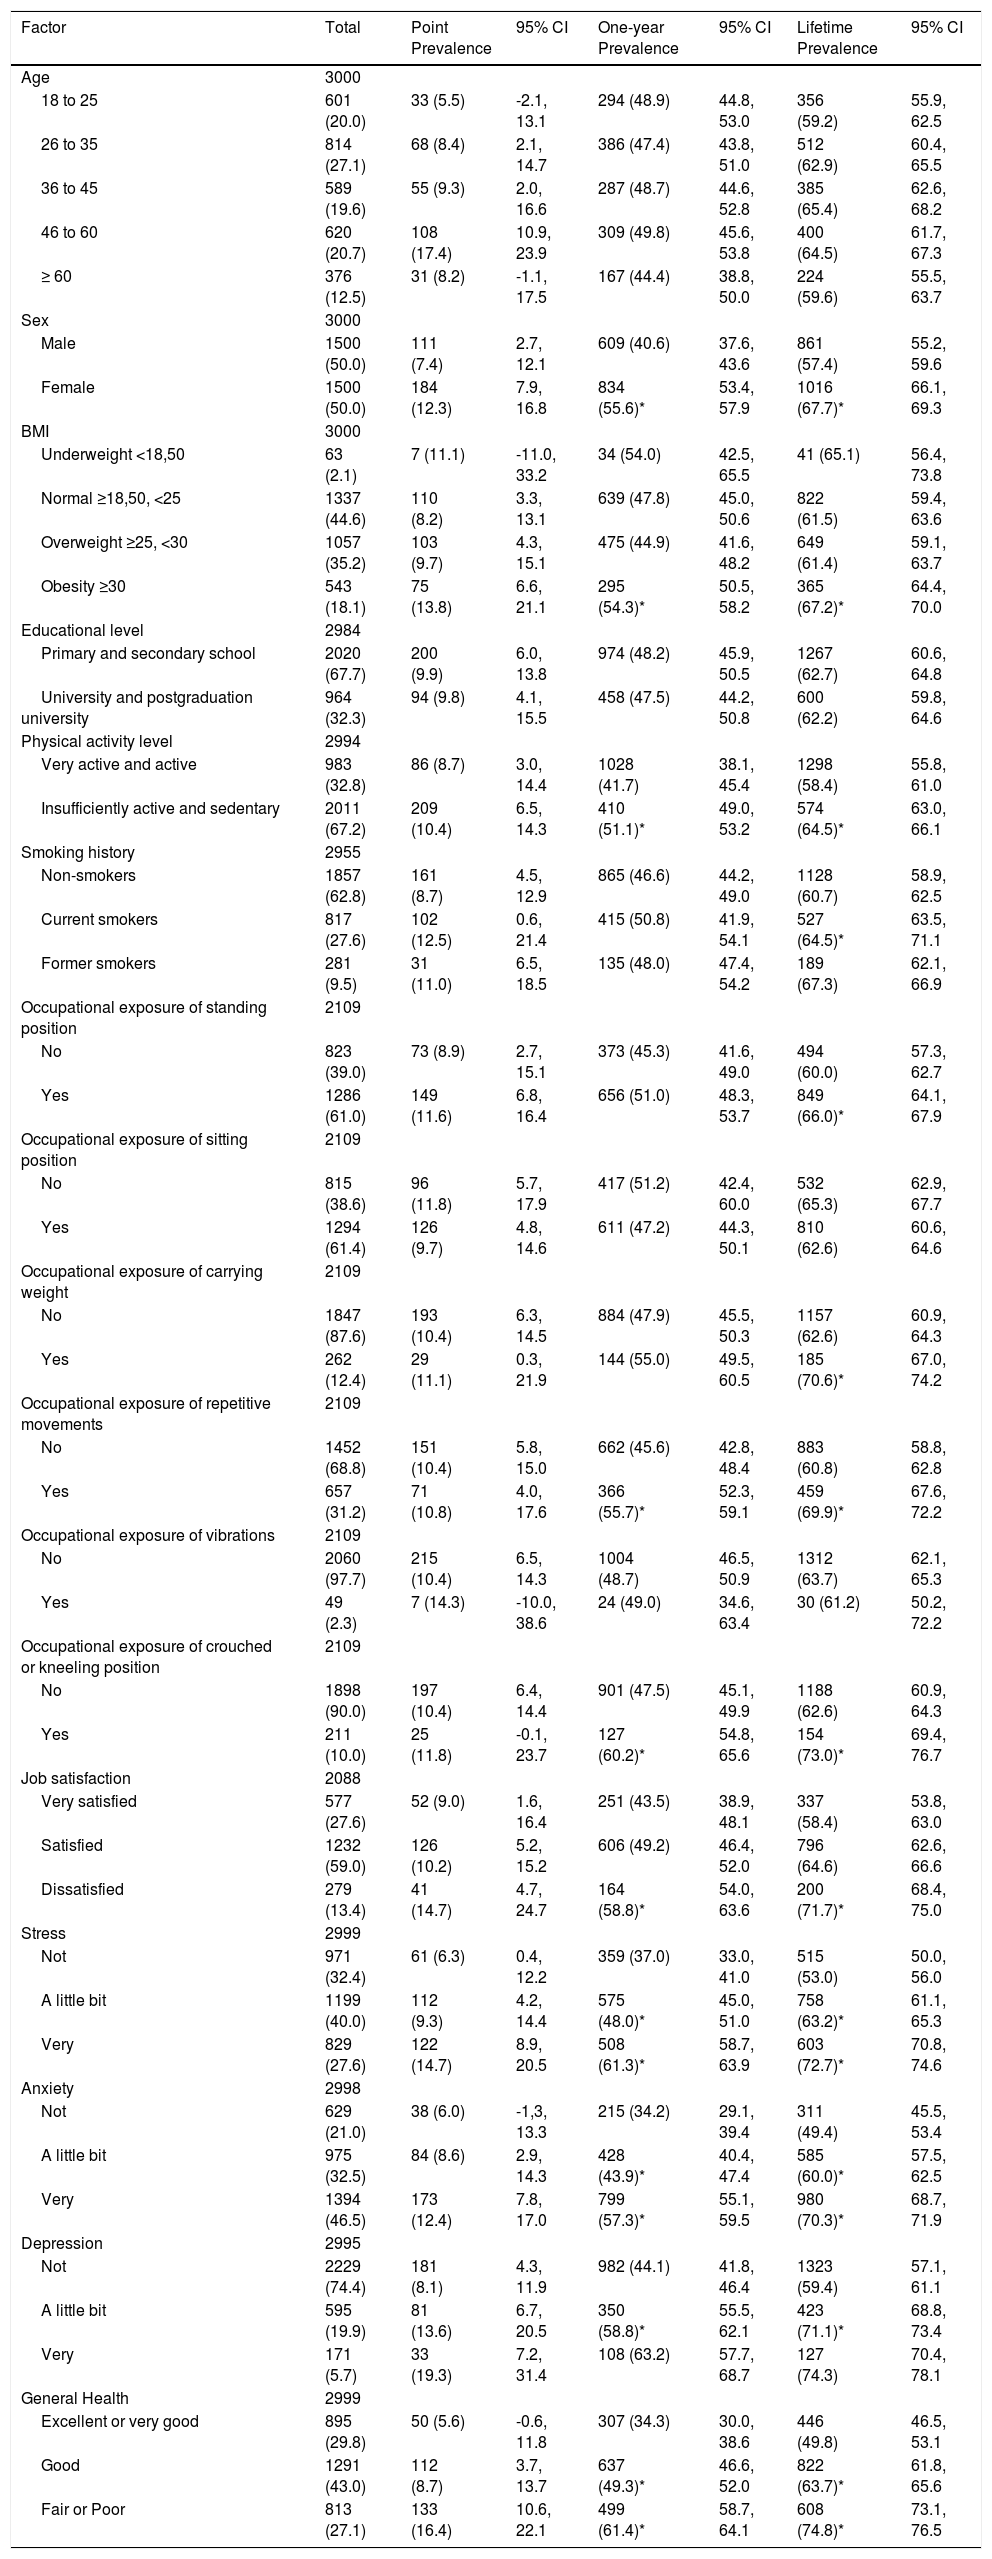
The mean point prevalence of LBP was 9.8% (95% CI: 8.8, 11.0), the mean one-year prevalence was 48.1% (95% CI: 46.3, 49.9), and the mean lifetime prevalence was 62.6% (95% CI: 60.8, 64.3).
Prevalence stratified by participants’ characteristicsThe results of prevalence estimate of different definitions according to the participants characteristics are shown in Table 3. There was no statistically significant difference between estimates of point prevalence when comparing participants’ characteristics. One-year and lifetime prevalence were higher in females when compared to males, and in obese people compared to people with normal and overweight BMI.
Prevalence of LBP according to different characteristics, expressed as n (%).
| Factor | Total | Point Prevalence | 95% CI | One-year Prevalence | 95% CI | Lifetime Prevalence | 95% CI |
|---|---|---|---|---|---|---|---|
| Age | 3000 | ||||||
| 18 to 25 | 601 (20.0) | 33 (5.5) | -2.1, 13.1 | 294 (48.9) | 44.8, 53.0 | 356 (59.2) | 55.9, 62.5 |
| 26 to 35 | 814 (27.1) | 68 (8.4) | 2.1, 14.7 | 386 (47.4) | 43.8, 51.0 | 512 (62.9) | 60.4, 65.5 |
| 36 to 45 | 589 (19.6) | 55 (9.3) | 2.0, 16.6 | 287 (48.7) | 44.6, 52.8 | 385 (65.4) | 62.6, 68.2 |
| 46 to 60 | 620 (20.7) | 108 (17.4) | 10.9, 23.9 | 309 (49.8) | 45.6, 53.8 | 400 (64.5) | 61.7, 67.3 |
| ≥ 60 | 376 (12.5) | 31 (8.2) | -1.1, 17.5 | 167 (44.4) | 38.8, 50.0 | 224 (59.6) | 55.5, 63.7 |
| Sex | 3000 | ||||||
| Male | 1500 (50.0) | 111 (7.4) | 2.7, 12.1 | 609 (40.6) | 37.6, 43.6 | 861 (57.4) | 55.2, 59.6 |
| Female | 1500 (50.0) | 184 (12.3) | 7.9, 16.8 | 834 (55.6)* | 53.4, 57.9 | 1016 (67.7)* | 66.1, 69.3 |
| BMI | 3000 | ||||||
| Underweight <18,50 | 63 (2.1) | 7 (11.1) | -11.0, 33.2 | 34 (54.0) | 42.5, 65.5 | 41 (65.1) | 56.4, 73.8 |
| Normal ≥18,50, <25 | 1337 (44.6) | 110 (8.2) | 3.3, 13.1 | 639 (47.8) | 45.0, 50.6 | 822 (61.5) | 59.4, 63.6 |
| Overweight ≥25, <30 | 1057 (35.2) | 103 (9.7) | 4.3, 15.1 | 475 (44.9) | 41.6, 48.2 | 649 (61.4) | 59.1, 63.7 |
| Obesity ≥30 | 543 (18.1) | 75 (13.8) | 6.6, 21.1 | 295 (54.3)* | 50.5, 58.2 | 365 (67.2)* | 64.4, 70.0 |
| Educational level | 2984 | ||||||
| Primary and secondary school | 2020 (67.7) | 200 (9.9) | 6.0, 13.8 | 974 (48.2) | 45.9, 50.5 | 1267 (62.7) | 60.6, 64.8 |
| University and postgraduation university | 964 (32.3) | 94 (9.8) | 4.1, 15.5 | 458 (47.5) | 44.2, 50.8 | 600 (62.2) | 59.8, 64.6 |
| Physical activity level | 2994 | ||||||
| Very active and active | 983 (32.8) | 86 (8.7) | 3.0, 14.4 | 1028 (41.7) | 38.1, 45.4 | 1298 (58.4) | 55.8, 61.0 |
| Insufficiently active and sedentary | 2011 (67.2) | 209 (10.4) | 6.5, 14.3 | 410 (51.1)* | 49.0, 53.2 | 574 (64.5)* | 63.0, 66.1 |
| Smoking history | 2955 | ||||||
| Non-smokers | 1857 (62.8) | 161 (8.7) | 4.5, 12.9 | 865 (46.6) | 44.2, 49.0 | 1128 (60.7) | 58.9, 62.5 |
| Current smokers | 817 (27.6) | 102 (12.5) | 0.6, 21.4 | 415 (50.8) | 41.9, 54.1 | 527 (64.5)* | 63.5, 71.1 |
| Former smokers | 281 (9.5) | 31 (11.0) | 6.5, 18.5 | 135 (48.0) | 47.4, 54.2 | 189 (67.3) | 62.1, 66.9 |
| Occupational exposure of standing position | 2109 | ||||||
| No | 823 (39.0) | 73 (8.9) | 2.7, 15.1 | 373 (45.3) | 41.6, 49.0 | 494 (60.0) | 57.3, 62.7 |
| Yes | 1286 (61.0) | 149 (11.6) | 6.8, 16.4 | 656 (51.0) | 48.3, 53.7 | 849 (66.0)* | 64.1, 67.9 |
| Occupational exposure of sitting position | 2109 | ||||||
| No | 815 (38.6) | 96 (11.8) | 5.7, 17.9 | 417 (51.2) | 42.4, 60.0 | 532 (65.3) | 62.9, 67.7 |
| Yes | 1294 (61.4) | 126 (9.7) | 4.8, 14.6 | 611 (47.2) | 44.3, 50.1 | 810 (62.6) | 60.6, 64.6 |
| Occupational exposure of carrying weight | 2109 | ||||||
| No | 1847 (87.6) | 193 (10.4) | 6.3, 14.5 | 884 (47.9) | 45.5, 50.3 | 1157 (62.6) | 60.9, 64.3 |
| Yes | 262 (12.4) | 29 (11.1) | 0.3, 21.9 | 144 (55.0) | 49.5, 60.5 | 185 (70.6)* | 67.0, 74.2 |
| Occupational exposure of repetitive movements | 2109 | ||||||
| No | 1452 (68.8) | 151 (10.4) | 5.8, 15.0 | 662 (45.6) | 42.8, 48.4 | 883 (60.8) | 58.8, 62.8 |
| Yes | 657 (31.2) | 71 (10.8) | 4.0, 17.6 | 366 (55.7)* | 52.3, 59.1 | 459 (69.9)* | 67.6, 72.2 |
| Occupational exposure of vibrations | 2109 | ||||||
| No | 2060 (97.7) | 215 (10.4) | 6.5, 14.3 | 1004 (48.7) | 46.5, 50.9 | 1312 (63.7) | 62.1, 65.3 |
| Yes | 49 (2.3) | 7 (14.3) | -10.0, 38.6 | 24 (49.0) | 34.6, 63.4 | 30 (61.2) | 50.2, 72.2 |
| Occupational exposure of crouched or kneeling position | 2109 | ||||||
| No | 1898 (90.0) | 197 (10.4) | 6.4, 14.4 | 901 (47.5) | 45.1, 49.9 | 1188 (62.6) | 60.9, 64.3 |
| Yes | 211 (10.0) | 25 (11.8) | -0.1, 23.7 | 127 (60.2)* | 54.8, 65.6 | 154 (73.0)* | 69.4, 76.7 |
| Job satisfaction | 2088 | ||||||
| Very satisfied | 577 (27.6) | 52 (9.0) | 1.6, 16.4 | 251 (43.5) | 38.9, 48.1 | 337 (58.4) | 53.8, 63.0 |
| Satisfied | 1232 (59.0) | 126 (10.2) | 5.2, 15.2 | 606 (49.2) | 46.4, 52.0 | 796 (64.6) | 62.6, 66.6 |
| Dissatisfied | 279 (13.4) | 41 (14.7) | 4.7, 24.7 | 164 (58.8)* | 54.0, 63.6 | 200 (71.7)* | 68.4, 75.0 |
| Stress | 2999 | ||||||
| Not | 971 (32.4) | 61 (6.3) | 0.4, 12.2 | 359 (37.0) | 33.0, 41.0 | 515 (53.0) | 50.0, 56.0 |
| A little bit | 1199 (40.0) | 112 (9.3) | 4.2, 14.4 | 575 (48.0)* | 45.0, 51.0 | 758 (63.2)* | 61.1, 65.3 |
| Very | 829 (27.6) | 122 (14.7) | 8.9, 20.5 | 508 (61.3)* | 58.7, 63.9 | 603 (72.7)* | 70.8, 74.6 |
| Anxiety | 2998 | ||||||
| Not | 629 (21.0) | 38 (6.0) | -1,3, 13.3 | 215 (34.2) | 29.1, 39.4 | 311 (49.4) | 45.5, 53.4 |
| A little bit | 975 (32.5) | 84 (8.6) | 2.9, 14.3 | 428 (43.9)* | 40.4, 47.4 | 585 (60.0)* | 57.5, 62.5 |
| Very | 1394 (46.5) | 173 (12.4) | 7.8, 17.0 | 799 (57.3)* | 55.1, 59.5 | 980 (70.3)* | 68.7, 71.9 |
| Depression | 2995 | ||||||
| Not | 2229 (74.4) | 181 (8.1) | 4.3, 11.9 | 982 (44.1) | 41.8, 46.4 | 1323 (59.4) | 57.1, 61.1 |
| A little bit | 595 (19.9) | 81 (13.6) | 6.7, 20.5 | 350 (58.8)* | 55.5, 62.1 | 423 (71.1)* | 68.8, 73.4 |
| Very | 171 (5.7) | 33 (19.3) | 7.2, 31.4 | 108 (63.2) | 57.7, 68.7 | 127 (74.3) | 70.4, 78.1 |
| General Health | 2999 | ||||||
| Excellent or very good | 895 (29.8) | 50 (5.6) | -0.6, 11.8 | 307 (34.3) | 30.0, 38.6 | 446 (49.8) | 46.5, 53.1 |
| Good | 1291 (43.0) | 112 (8.7) | 3.7, 13.7 | 637 (49.3)* | 46.6, 52.0 | 822 (63.7)* | 61.8, 65.6 |
| Fair or Poor | 813 (27.1) | 133 (16.4) | 10.6, 22.1 | 499 (61.4)* | 58.7, 64.1 | 608 (74.8)* | 73.1, 76.5 |
According to lifestyle characteristics, one-year and lifetime prevalence was somewhat higher in people insufficiently active and sedentary when compared to people very active and active. This was similar to lifetime prevalence in current smokers compared to non-smokers. According to occupational tasks, lifetime prevalence was also highest in people who are exposed to standing position compared to those not exposed, and people exposed to carrying weight compared to those not exposed. One-year and lifetime prevalence were higher in people exposed to repetitive movements when compared to those not exposed, people exposed to crouched or kneeling position compared to those not exposed, and people dissatisfied with their job compared to people satisfied or very satisfied with their job.
According to psychological characteristics, one-year and lifetime prevalence was somewhat higher in people a little bit or very stressed, a little bit or very anxious, and a little bit depressed compared to people without these characteristics. One-year and lifetime prevalence were also higher in people with good and fair or poor general health when compared to those with excellent or very good general health.
Individuals who reported LBP at the time of the interview had moderate pain (6.0 ± 2.3 points out of 10 using the numerical rating scale) and low disability levels (9.0 ± 6.5 points out of 24 using the Roland Morris Disability Questionnaire).
DiscussionOverall, around 10% of participants had LBP at the time of the interview (point prevalence), 48% of participants had LBP in the last year (one-year prevalence), and 62% of participants had LBP at some point in their life (lifetime prevalence). One-year and lifetime prevalence were higher in females, obese people, people insufficiently active and sedentary, current smokers, people who are exposed to repetitive movements, crouched or kneeling position, people dissatisfied with their job, people a little bit or very stressed, a little bit or very anxious, and a little bit depressed, and people with good and fair or poor general health. Lifetime prevalence was also higher in people exposed to standing positions and exposure to carrying weight.
The prevalence of LBP in this study is similar to a study conducted in Turkey (upper-middle income) with a random sample of 7897 adults, which described the one-year prevalence of 46.1%, and lifetime prevalence of 62.1%.31 Although our results revealed that the prevalence of LBP in Brazil is similar to the prevalence of LBP in an upper-middle income country such as Turkey, it is important to acknowledge that the methods used to determine the prevalence of LBP in this country and its socio-cultural aspects may limit direct comparisons.
A systematic review20 investigating prevalence estimates of LBP in Brazil with 18 studies (19,387 individuals) found only one study that described point prevalence of LBP of 14.4%.32 The sample was composed by physical therapy and medical students.32 Only one study described one-month prevalence estimate of 13.7%.33 The sample was high school adolescents in Southern Brazil.33 Seven studies described an one-year prevalence estimate, ranging from 13.1%34 to 66.8%.32 The studies recruited samples of drivers,35 children,34 health insurance policy holders,36 adolescents,37 physical therapy and medical students,32 and industrial workers.38 Only one study included a sample of adults from the general population.39 The study was conducted in a small city of Rio Grande do Sul state and reported data only about one-year prevalence.39 This study found an estimate of one-year prevalence of 40%.
Our study overcomes many of the important limitations of previous studies investigating prevalence of LBP in low and middle income countries.1 First, we recruited a representative and well-defined sample of adults from flow point locations randomly selected from 10 sectors from 5 different zones of São Paulo city. The second strength of the study is that we used a clear and recognized definition of non-specific LBP.11,23–25 Third, because prevalence estimates are affected by the definition according to the length of time, three definitions of prevalence were investigated (i.e., point prevalence, one-year prevalence, and lifetime prevalence).
Our study also has some limitations. First, because this study was a questionnaire-based cross-sectional study we acknowledge that the information collected was based on the recall of participants and this may affect the estimates. We have tried to minimize recall bias by explaining the objective and significance of the study to the participants and by using a standardized questionnaire for assessing LBP. Second, there is a possibility that the disability scores were biased by the fact that participants were recruited in public places and busy streets. People with more severe and disabling pain may be less likely to walk around. Third, because the baseline assessment was conducted by interview, some objective measures (e.g., physical activity, depression) were not possible to measure more precisely and this may influence the prevalence estimates stratified by categories. Finally, we collected participants income according to the Brazilian Economic Classification Criteria, and we acknowledge that this may not show the real scenario of people's income. Also, there was a reasonable amount of missing data as participants were not comfortable to disclose what their income was during the interview. For these reasons, we decided not to present the results of this variable.
The findings of this study have important implications for individuals, communities, health-care systems and future research. Based on the results of this study, LBP in Brazil is as common as in other middle income countries, and this is expected to increase even further in coming decades, according to the Global Burden of Disease LBP.40 Understanding the prevalence of LBP is crucial to informing policies and setting priorities, especially in low income and middle income countries, where formal and informal social-support systems are negatively affected.24 Therefore, the estimates of prevalence of this study and the identification of the characteristics of patients most affected by LBP may help to guide coordinated efforts from government, the private sector, universities, health workers, and civil society to deliver the management and promote the prevention of LBP.41 This can be done by adapting interventions that have proved to be effective in other countries,41 to minimize costs and demand for health services, non-working absenteeism, and disability. Future research should conduct similar studies at a national level to guarantee representativeness of the population.
ConclusionsThe prevalence of LBP is significant among people from the city of São Paulo, Brazil. There is a need for coordinated efforts from government, the private sector, universities, health workers, and civil society to deliver appropriate management of LBP in middle-income countries, by adapting interventions that have proved to be effective in other countries.
We thank all the individuals who participated in the study. We would like to thank Professor Chris Maher for his kind suggestions on how to improve the quality of this manuscript.
This work was supported by Fundação de Amparo à Pesquisa do Estado de São Paulo (FAPESP), Brazil [2015/262202], and Coordenação de Aperfeiçoamento de Pessoal de Nível Superior (CAPES), Brazil [Finance Code 001]. T da Silva receives a fellowship from FAPESP, Brazil [2018/20035-7].


