


As resources for healthcare are scarce, decision-makers increasingly rely on economic evaluations when making reimbursement decisions about new health technologies, such as drugs, procedures, devices, and equipment. Economic evaluations compare the costs and effects of two or more interventions. Musculoskeletal disorders have a high prevalence and result in high levels of disability and high costs worldwide. Because physical therapy interventions are usually the first line of treatment for musculoskeletal disorders, economic evaluations of such interventions are becoming increasingly important for stakeholders in the field of physical therapy, including physical therapists, decision-makers, and reseachers. However, economic evaluations are relatively difficult to interpret for the majority of stakeholders.
ObjectiveTo support physical therapists, decision-makers, and researchers in the field of physical therapy interpreting trial-based economic evaluations and translating the results of such studies to clinical practice.
MethodsThe design, analysis, and interpretation of economic evaluations performed alongside randomized controlled trials are discussed. To further illustrate and explain these concepts, we use a case study assessing the cost-effectiveness of exercise therapy compared to standard advice in patients with musculoskeletal disorders.
ConclusionsEconomic evaluations are increasingly being used in healthcare decision-making. Therefore, it is of utmost importance that their design, conduct, and analysis are state-of-the-art and that their interpretation is adequate. This masterclass will help physical therapists, decision-makers, and researchers in the field of physical therapy to critically appraise the quality and results of trial-based economic evaluations and to apply the results of such studies to their own clinical practice and setting.
Resources available for healthcare are scarce worldwide. Decision-makers increasingly request information on the relative efficiency of healthcare interventions when making reimbursement decisions. This information is provided by economic evaluations, which compare both the costs and effects of two or more interventions.1 Although the use of economic evaluation results in healthcare decision-making is most common in high-income countries, low- and middle-income countries have recently acknowledged the importance of using such economic evidence in their healthcare decision-making process.2–5
In recent years, the prevalence of musculoskeletal disorders has increased exponentially, resulting in high levels of disability and high costs.6–10 Musculoskeletal disorders are the leading cause of years lived with disability and work absence.6,11 Low back pain and neck pain presented the highest healthcare costs (USD134.5 billion) in the United States between 1996-2016.10 The total annual costs of low back pain alone are estimated at about USD15 billion in the United Kingdom and USD11 billion in Australia.12,13 The Brazilian public healthcare system was found to spend approximately USD714 million on spinal disorders, and the societal costs of low back pain alone between 2012-2016 were about USD2.2 billion.14,15 However, some of the healthcare budget for low back pain is spent on unnecessary diagnostic tests or on not recommended interventions.14,16,17 Economic evaluations may help healthcare decision-makers on how to allocate these scarce resources as efficiently as possible.18 Consequently, low-, middle-, and high-income countries have started using economic evaluation as an input for reimbursement decisions.19–22
Physical therapy interventions are the first line of treatment for many musculoskeletal disorders.23–25 Economic evaluations of physical therapy interventions are becoming increasingly important for stakeholders in the field of physical therapy, including researchers, physical therapists, and decision-makers.2,26 However, the uptake of economic evaluation results among those stakeholders is hampered by the fact that for many of them economic evaluations are generally complex and difficult to interpret. Evidence indicates, for example, that although healthcare decision-makers are highly interested in economic evaluations, the impact of the results of such studies has been limited due to a lack of knowledge and skills required to interpret the results.19,27–31 This masterclass aimed to support stakeholders commissioned with making decisions about the treatment of musculoskeletal disorders with the interpretation of economic evaluations and translating the results of such studies into clinical practice.
International recommendationsThis masterclass is based on the most recent international recommendations for trial-based economic evaluations.18,22,32–36 A case study consisting of an economic evaluation of exercise therapy for non-specific chronic low back pain in Brazil, is used as an example to illustrate how general principles regarding the design, analysis, and reporting of trial-based economic evaluations of musculoskeletal physical therapy interventions apply in such a specific setting. Information about the case study is presented in Box 1.37,38
Case study
The case study concerns an economic evaluation performed alongside a randomized controlled trial assessing the cost-effectiveness of an exercise therapy consisting of Pilates exercises compared to standard advice.37 Two-hundred ninety-six patients were randomly allocated to four treatment groups: booklet, Pilates 1, Pilates 2, and Pilates 3. All patients received physical therapy advice. The booklet group did not receive other treatment recommendations. Pilates groups 1, 2, and 3 received individualized exercise therapy that were given once, twice, and three times a week, respectively, for six weeks. In this masterclass, we only used data from Pilates 3 group (exercise therapy group) and the booklet group (control group).37 Patients with chronic non-specific low back pain, aged between 18 and 80 years were included. Patients with contraindications for exercise, pregnancy, nerve root compression, or serious spinal pathologies, and previous or scheduled spinal surgery were excluded. The study was conducted at a Pilates clinic and a physical therapy clinic. The effect outcomes were defined according to the core outcome set for low back pain.38
Economic evaluations are defined as “the comparative analysis of alternative courses of action in terms of both their costs and consequences”.1 Full economic evaluations identify, measure, value, and compare costs and health effects between two or more interventions.1,18,33,36,39 Studies that do not compare costs and effects of two or more interventions are not considered full economic evaluations, but partial evaluations. Examples of such partial evaluations are cost-of-illness studies, in which only costs are considered, or cost-outcome descriptions, which only describe the costs and effects of one intervention.18,33
Design of an economic evaluationEconomic evaluations can be performed using decision analytical modelling techniques (i.e. model-based economic evaluations) or alongside randomized controlled trials (i.e. trial-based economic evaluations).34,40 These two designs of economic evaluations are seen as complementary.41
In model-based economic evaluations, cost and effect data are obtained from different sources, such as systematic reviews, randomized controlled trials, cohort studies, electronic medical records, and other databases in which data are collected in daily practice.22,40,42–44 These cost and effect estimates are then used as parameters in decision analytical models, such as decision trees, Markov models, and micro-simulations.22,40,42–44 Model-based economic evaluations are useful when it is not possible to compare all relevant interventions in a trial, when trials do not assess all relevant costs and effects, or when decision-makers are interested in the long-term cost-effectiveness of interventions, while long-term individual patient-level data are lacking or impossible to collect prospectively.22,40,42–44 To increase the quality of model-based economic evaluations, national and international guidelines for good practice have been published.3,22,40,42–44
In economic evaluations conducted alongside randomized controlled trials, patients are randomly allocated to one of the interventions and patient-level cost and effect data are gathered prospectively during follow-up.32,34,36,41 It is also possible to conduct a trial-based economic evaluation alongside a non-randomized trial, such as a pre-post study. However, randomized controlled trials are generally considered the gold standard, because randomization ensures that all observed and unobserved confounders are equally distributed across groups, which improves the internal validity of the results. A possible disadvantage of randomized controlled trials is that their external validity (i.e. generalizability) is limited due to the selection of a restricted patient population and/or strict protocol for interventions. This can be improved by using a pragmatic trial design, which means that the trial is conducted under “real-world” conditions (i.e. resembling normal daily clinical practice).32 Such a pragmatic design is considered the best study design for making inferences about the cost-effectiveness of healthcare interventions in clinical practice.32,34,45,46 Therefore, this masterclass article focuses on trial-based economic evaluations.
PerspectiveThe perspective of an economic evaluation determines which costs and effects are included.1,18,33,36,39 The broadest perspective is the societal perspective, in which all costs and effects are included, irrespective of who pays or benefits. The healthcare perspective is narrower and means that only costs borne by the healthcare sector are included. Other perspectives might also be relevant, such as that of the healthcare provider, the health insurance company, the patient, or the employer.1,18,33,36,39 Because the applied perspective determines which cost categories are assessed and included in an economic evaluation, it should always be stated explicitly.1,18,33,36,39
Differences exist between countries regarding the recommended perspective. In the United Kingdom, for example, the healthcare perspective is recommended;3 in Brazil, the Brazilian public healthcare system (Sistema Único de Saúde [SUS]) perspective;22 and in the Netherlands the societal perspective.20 An important advantage of the societal perspective is that it provides an estimation of the impact of implementing an intervention across all stakeholders.36 This information will ensure that there is a net societal benefit (or loss), rather than simply costs shifting from one stakeholder to another. Moreover, a disaggregated presentation of the societal costs provides a good indication of their distribution among stakeholders.36 All relevant cost categories are included in the societal perspective, making it possible to easily conduct additional analyses from a narrower perspective.36,47 In the case study, the economic evaluation was conducted from the societal perspective and an additional analysis was performed from the narrower SUS perspective.37
Time horizonThe time horizon of an economic evaluation is the period over which cost and effect data are collected and analyzed.1,36,39 This period should be long enough to allow for the assessment of all relevant costs and effects flowing from the intervention under study.1,36,39 The most appropriate time horizon also depends on the nature of the health problem (e.g. acute, sub-acute, or chronic), the duration of the intervention under study, and the expected retention of the effect(s) of the intervention.1,22,36,39 For example, a 12-week follow-up might be long enough to assess the cost-effectiveness of paracetamol and diclofenac compared with advice alone for acute low back pain.48 However, in the case study patients were suffering from chronic non-specific low back pain and Pilates-based exercise therapy was expected to improve pain and disability, as well as improve motor control, stabilization, and body awareness in the long-term.37 Therefore, a 12-month time horizon was used. In general, researchers and physical therapists should at least feel confident that the most important costs and effects are covered by the chosen time horizon.36 Even though the optimal follow-up period of trial-based economic evaluations of musculoskeletal intervention is unknown,36 most studies in this area use a follow-up period of at least 12 months.49–52
Identification, measurement, and valuation of effectsThe effect outcome that is measured and included in the analysis of an economic evaluation determines the type of economic evaluation.1,18,33,34,36,39
In a cost-effectiveness analysis (CEA), effect outcomes are disease- and/or intervention-specific and are particularly relevant for healthcare providers who use these measures to make decisions about the treatment of their patients.53 In the majority of cases, this outcome is the primary outcome of a randomized controlled trial. In the field of musculoskeletal disorders, several core outcomes sets have been developed.38,54–56 In patients with low back pain, for example, it is recommended to measure physical functioning using the Oswestry Disability Index or the Roland-Morris Disability Questionnaire, pain intensity using a numerical rating scale, and health-related quality of life (QoL) using the Short-Form 12 or PROMIS Global Health.38 Such disease-specific outcomes are also recommended for other musculoskeletal disorders.54–56 Because disease-specific outcomes are specific for the health condition and intervention under study, it is only possible to compare results of CEA across different types of musculoskeletal disorders when the same clinical outcome (e.g. pain intensity) was assessed. However, when decision-makers need to choose between reimbursing a treatment for musculoskeletal disorders or other conditions, such as cancer and diabetes, CEAs are of little use.1,18,33,36,39
In a cost-utility analysis (CUA), effects are measured in terms of Disability-Adjusted Life-Years (DALYs) or Quality-Adjusted Life-Years (QALYs).1,18,33,34,36,39,57 Both DALYs and QALYs combine morbidity and life-expectancy in one single measure. This allows for making comparisons across different kinds of health conditions and interventions.57 Whereas QALYs represent the life-years spent in optimal health, DALYs represent the loss of quality of life due to health conditions.58 Although the World Health Organization recommends the use of DALYs for economic evaluations, most national pharmacoeconomic organizations, such as the National Institute for Health and Clinical Excellence (NICE), the Dutch National Health Care Institute, and the Rede Brasileira de Avaliação de Tecnologias em Saúde (REBRATS) recommend to use QALYs for the purpose of healthcare decision-making.20–22 To estimate QALYs, three steps are typically followed in trial-based economic evaluations: 1) assessment of the patients’ health states using a preference-based QoL measure, 2) conversion of the patients’ health states into utility values, and 3) calculation of QALYs by multiplying the patients’ utility values by the time they spent in a specific health state.
Preference-based QoL measures that can be used are the EuroQol 5 Dimensions (EQ-5D), the Health Utilities Index (HUI), and the Short-Form 6 Dimensions (SF-6D, which can be derived from the SF-12 and SF-36 questionnaires).59–61 These questionnaires are ideally administered at different time points to describe the participants’ QoL during the course of the trial. The more often QoL is measured, the more precise the estimate of effect, although frequent assessment may be burdensome to patients.62 To convert the patients’ health states to utility values, national value sets are typically used, in which each health state is converted to a utility value previously derived from the preferences of the general population.62 Utility values indicate a person's preference for a specific health state on a scale that is anchored at 0 (equal to death) and 1 (equal to full health).62 Negative values can also occur and indicate that a specific health state is considered to be worse than death.62 Finally, the obtained utility values are used to calculate QALYs by multiplying them by the amount of time a patient spent in a specific health state.34 An example of such a calculation is presented in Box 2.
In the case study, the patients’ health states were measured using the SF-6D and converted to utility values using the Brazilian tariff.61,63 QALYs were calculated using linear interpolation between measurement points (Box 2).
Estimating QALYs
- (1)
Assessment of the patients’ health states using a preference-based QoL measure;
- (2)
Conversion of the patients’ health states into utility values;
- (3)
Calculation of QALYs using linear interpolation between measurement points
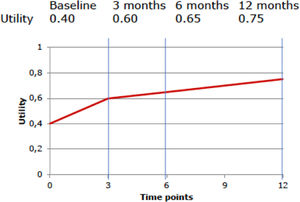
To calculate the QALYs using a hypothetical participant's QoL at baseline (utility value: 0.4), and at 3-month (utility value: 0.6), 6-month (utility value: 0.65), and 12-month (utility value: 0.75) follow-up, we first need to estimate the average utility value per measurement period.
For the first period (baseline to 3 months), this is (0.4 + 0.6) / 2 = 0.5. For the second period (3 months to 6 months), this is (0.6 + 0.65) / 2 = 0.625, and for the third period (6 months to 12 months), this is (0.65 + 0.75) / 2 = 0.70. Subsequently, we need to multiply these average utility values per time period by the length of that time period, i.e. the time spent in a particular health state, and sum them all up. Thus, this participant's number of QALYs gained during the 12-month follow-up period is calculated as follows:
QALY can range from 0 to 1, where 0 indicates “death” and 1 indicates “full health”.
There are two other types of economic evaluations, which are not frequently used in health research. In a cost-benefit analysis (CBA), both costs and effects are expressed in monetary units. CBAs provide an indication of whether an intervention generates savings or losses compared with an alternative and are also referred to as return-on-investment analyses.1,18,33,36,39 However, monetizing clinical outcomes, such as pain, disability, and recovery is considered difficult and even unethical sometimes. Therefore, these analyses are considered less relevant in the evaluation of physical therapy interventions.36
Finally, in a cost-minimization analysis (CMA), effects are considered equal for the interventions compared, and therefore only costs are compared between the alternatives.1,18,33,36,39 This approach, however, does not take into account the joint uncertainty surrounding the costs and effects of interventions. Also, a conclusion that effects are equal can only be made if the study was designed specifically to demonstrate equivalence of the compared interventions. Absence of a statistically significant difference cannot be considered evidence of equivalence.64 Unless a study sets out to show equivalence of two treatments, CMAs are considered inappropriate.1,18,33,36,39,64
In practice, most economic evaluations are a combination of a CEA (to inform healthcare providers) and a CUA (to inform healthcare decision-makers).18,33 In the case study, two CEAs were performed, i.e. one for physical functioning and one for pain intensity, and a CUA was performed for QALYs.37
Identification, measurement, and valuation of costsAn integral part of any economic evaluation is the identification, measurement, and valuation of the resources consumed by the patients.1,18,34,36,39 Resources are, for example, number of pills taken, number of visits to a general practitioner or a physical therapist, or the performance of a diagnostic test. The resource use items that need to be included highly depend on the applied perspective, the interventions being evaluated, and the patient population.1,18,34,36,39 Once all relevant resource categories are identified, researchers should determine how to “cost” them. This process involves three steps: 1) the measurement of the quantities of resources consumed (Q), 2) the assignment of unit prices (p), and 3) the valuation of the resources consumed (C = Q * p).1,65 Ideally, the quantities of resources consumed as well as their respective unit prices are reported separately so that readers can recalculate costs for their own setting.1,65 The “costing” steps will be discussed below into more detail.
The measurement of quantities of resources consumed (Q)Resource use data can be collected using patient medical records, insurance records, interviews, questionnaires, cost diaries, previous studies, information from vendors, and/or administrative databases.1,18,32,33,36,66,67 Several questionnaires for assessing resource use have been developed (e.g. iMTA Questionnaire on Costs, iMTA Valuation of Informal Care Questionnaire).68,69 Researchers typically develop their own cost questionnaire, based on existing questionnaires, to tailor it to their specific population, and are encouraged to publish these questionnaires in an open-access database (e.g. Database of Instruments for Resource Use Measurement [DIRIUM]).70
If medical or insurance records are used, recall bias (i.e. risk of patients forgetting information) is non-existent. However, such databases may lack important information (i.e. information bias) because it is simply not recorded or measured, for example information on healthcare utilization that is not reimbursed by the insurer. It is also possible that information is collected incompletely, because reimbursement is based on a package of care (e.g. diagnosis related groups, multidisciplinary treatments) and not on the separate resource utilization items.18 Although this may not be problematic when using the healthcare insurer perspective, this is not appropriate when using the societal perspective.
If patient self-reports are used, a balance needs to be found between the duration of the recall periods and the frequency with which the instrument is administered. This is important because the risk of recall bias increases with longer recall periods, whereas increasing the number of assessments increases the burden for the participants. When relatively short recall periods (e.g. only a couple of weeks) are used over a longer period of time, this may be overly burdensome to patients, which may increase the risk of missing data and drop-outs. To minimize recall bias, missing data, and drop-outs, the literature recommends recall periods of two to six months in a study with a long-term follow-up (e.g. more than 12 months).34,71,72 It might be useful to measure healthcare utilization more frequently during the first months of a physical therapy study, because most healthcare utilization and most sick leave will occur when patients are seeking healthcare for a new episode of musculoskeletal complaints. In the case study, patients were asked to fill in a cost diary assessing all resources used related to their low back pain symptoms. This information was collected by telephone every six weeks during a period of 12 months.37
The assignment of unit prices (p)Ideally, unit prices reflect opportunity costs, which are defined as “the value of a resource in its most highly valued alternative use”.1,73 In simple terms, opportunity costs are equal to not receiving the benefit of the next best option. As such, opportunity costs are thought to reflect the value of the actual resources used. Charges or tariffs do not reflect opportunity costs or the actual value, because they are based on negotiations, e.g. between the government and healthcare organizations.33,34 Therefore, they should not be used in economic evaluations. Unit price information can be obtained from national databases (e.g. SUS cost table), costing manuals (e.g. Dutch manual), professional organizations, previous studies, vendors, and/or administrative databases.18,20,74–77
The valuation of resources consumed (C=Q*p)Valuation is the process of converting resource utilization rates into costs by multiplying them with their opportunity costs. Resources (C) are valued by multiplying the quantities of resources consumed (Q) with the unit prices (p) (C = Q*p). Below, a more detailed description of the identification, measurement, and valuation of resources is provided for cost categories that are often included in trial-based economic evaluations of musculoskeletal physical therapy interventions.
Intervention costsIf the cost of an intervention is unknown, it can be estimated using a micro-costing or a gross-costing approach.1,33,36,78,79 In a micro-costing approach (i.e. bottom-up approach), information on the types and quantities of resources consumed as well as their respective unit prices is collected for each intervention component separately.79 In the case study, for example, the components of the exercise therapy included Pilates exercise sessions and education materials.37 For each of those components, information was gathered about the staff involved as well as the number of hours that they devoted to providing the intervention, the materials used, the housing needed, and the associated overhead costs (e.g. cleaning costs, costs of heating).1,33,36 The quantities of resources consumed per intervention component can be measured through interviews or surveys with providers and/or patients, expert panels, administrative databases, intervention logs, or observations.36,80 Micro-costing gives a reliable and precise estimate of the intervention costs, but is time-consuming. A gross-costing approach is simpler, and therefore less time-intensive. It allocates a total budget to specific services, such as physical therapists’ visits, using specific allocation rules.1,33,36,78,81,82 The average intervention cost per patient might, for example, be estimated by simply dividing the total intervention costs by the number of patients. Although gross-costing is a simple and fast approach, it lacks precision and its success depends on the type of routine data available. Thus, the choice between micro-costing and gross-costing depends on how large the contribution of a specific cost item is to the total costs. Many studies use a mix of both approaches, for example, by using micro-costing for estimating intervention costs and gross-costing for all other cost categories.78,81–83
Healthcare utilization costsIdeally, the use of all healthcare services is measured to reduce the likelihood of missing important, but unexpected shifts in healthcare services use.84 Although this approach increases the validity of the results, it might not always be feasible.84 An alternative strategy is to limit data collection to healthcare utilization that is deemed to be related to the health condition under study and those expected to differ between the interventions.84 Healthcare utilization generally includes, amongst others, the use of medications, primary care services (e.g. number of visits to general practitioners or other healthcare professionals, physical therapy sessions, diagnostic tests), secondary care services (e.g. number of outpatient hospital visits, visits to other healthcare institutions such as a rehabilitation clinic, and admissions to hospital), and tertiary care services (e.g. number of visits to a specialized clinic with highly specialized medical care).1,18,33,36
Patient and family costsPatient and family costs include all costs accruing to patients and/or their family members, including costs of over-the-counter medications and transportation, but also informal care costs.1,18,33,36 Informal care refers to paid and unpaid activities by one or more members of the social environment of the patient.85 Informal care tasks may comprise housekeeping, personal care, support with mobility, and administrative tasks.85 In economic evaluations of physical therapy interventions, informal care can be an important cost category, because an increasing part of the total care provided to patients, especially to patients with chronic diseases, consists of informal care.85 Failure to include this category will result in an underestimation of total societal costs, and possibly to missing important shifts from formal care to informal care. Different approaches can be used to value informal care. The most widely used option is the use of a shadow price, e.g. the hourly costs of a legally employed cleaner. Other approaches are the proxy good approach, where the costs of a market substitute (e.g. the hourly wage rate of a nurse for nursing tasks, the hourly costs of a legally employed cleaner for cleaning tasks) are used, and the opportunity cost approach, where the actual wage rate of the informal care giver is used.85
Lost productivity costsProductivity losses are an important cost driver in many economic evaluations of physical therapy interventions. Musculoskeletal disorders often lead to reduced productivity, because patients cannot perform their work and therefore report in sick or become less productive at work.11 Productivity loss is defined as a loss of labour output (e.g. a company's output) as a result of reduced labour input (i.e. time and efforts of workers with a health problem).86 Thus, productivity loss is ideally estimated by measuring output loss. However, it is difficult to estimate the true impact of the reduced labor input on a company's output.36,87,88 Therefore, researchers typically use proxies of productivity loss, which include losses related to reduced productivity while at work (i.e. presenteeism) and losses related to absence from paid work (i.e. absenteeism) using self-reported data.1,18,33,36
Research indicates that presenteeism often represents a large part of total productivity losses.86 Several questionnaires are available for assessing presenteeism, including the World Health Organization Health and Work Performance Questionnaire, the Quantity and Quality questionnaire, the Work Limitations Questionnaire, and the iMTA Productivity Cost Questionnaire.89–96 These questionnaires typically ask patients to rate their work performance in terms of points, percentages, or a proportion compared to their normal performance. These outcomes can then be used to estimate the number of days lost due to presenteeism using the following fomula:97
where Presenteeism days is the number of days lost due to presenteeism, T is total number of working days, S is the total number of sickness absence days, and w is the patient's self-reported work performance.86
Absenteeism from paid work represents another important source of lost productivity, and, thus, societal costs.86,87 There are two methods for valuing absenteeism from paid work, namely the Human Capital Approach and the Friction Cost Approach.1,18,33,36,67 According to the Human Capital Approach, absenteeism costs are equal to the amount of money patients would have earned had they not been injured or ill.36,86 Thus, productivity losses are generated during the complete duration of absence from paid work.1,18,33,36,67 The Friction Cost Approach attempts to adjust for the fact that workers might be (partially) replaced in case of long-term sickness absence or premature mortality by truncating productivity losses at the friction period.36,86 The friction period is the period needed to replace an absent sick worker and depends on the labour market, which means that its duration can differ between countries.1,18,33,36,67 Both presenteeism and absenteeism can be valued using actual wage rates of patients, or age-, sex-, education-, and/or job-specific price weights.36,98
It is also possible that participants generate productivity losses related to unpaid work. Unpaid productivity losses are defined as losses due to an incapability to perform unpaid activities, such as volunteer work, household work, and education.87 Unpaid productivity losses can be measured by asking patients to report the hours of unpaid work that they were unable to perform due to their health condition.96 Unpaid productivity losses can be valued using the aforementioned proxy good costs and opportunity costs (see patient and family costs section).
A more detailed explanation of the identification, measurement, and valuation of costs in the case study is presented in Box 3.
Identification, measurement, and valuation of costs in the case study
In the case study, the societal perspective was applied and total costs included intervention costs, healthcare costs, patient and family costs, and lost productivity costs.37 Intervention costs were estimated using a micro-costing approach. Information was gathered about the number of exercise sessions patients attended as well as the number of distributed information booklets, after which both items were valued using unit prices derived from the Brazilian physical therapy council (for the exercise sessions) and print shops (for printing of the booklets).74 Healthcare costs included costs related to the use of medications and other health services. Information on the quantity of healthcare services consumed was collected during the trial using cost diaries developed by the researchers. Unit prices were derived from the SUS cost table.77 Patient and family costs were collected by asking patients to report the number of kilometers travelled by car and/or the number of public transport tickets needed to get to the clinic as well as their expenses on over-the-counter and complementary medicines. Transportation by car was valued using Brazilian gasoline prices (R$0.23 per kilometer), and public transport was valued using the reference price of Sao Paulo city (£3.77 per trip). Informal care costs were not measured. Productivity losses included absenteeism from paid work and productivity losses related to unpaid work, while presenteeism was not included. Absenteeism from paid work was measured using a questionnaire and valued according to the Human Capital Approach using sex-specific price weights.98 Productivity losses related to unpaid work were measured by asking patients the total number of hours of unpaid work that they were unable to perform due to their chronic low back pain. Unpaid productivity losses were valued using the same unit price as absence from paid work, because Brazilian reference prices for unpaid losses are lacking.
In trial-based economic evaluations, it is common that unit prices are not available for the same year. Due to inflation, however, the price of goods and services will typically increase over time and consequently prices from different years are not directly comparable.99 Therefore, all costs need to be converted to the same reference year using consumer price indices (CPI).34,36,65,99 A more detailed explanation of converting prices to the same year using CPIs is presented in Box 4.
Converting prices using Consumer Price Indices (CPI)
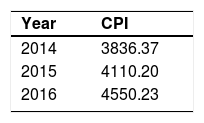
In the case study, the reference year adopted was 2016.37 All costs needed to be adjusted to the same reference year using the Brazilian consumer price indices below.98
For this adjustment, we used the following formula:
where Pricei and CPIi are the unit price and CPI of the index year and Pricer and CPIr are the unit price and CPI of the reference year. Thus, if we would like to convert the price of an exercise therapy session from Brazilian real in 2014 (R$70.50) to Brazilian real in 2016, we can do that as follows:74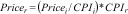

Another phenomenon that should be considered in trial-based economic evaluations is that costs and effects are sometimes measured over more than one year. Since people have a preference to receive benefits today rather in the future, costs and effects occurring in the second and later years of follow-up need to be adjusted by converting them to their present value.1,36,43,45,79,100–102 The appropriate discount rate differs between countries,3,25,45,79,89 and may differ for costs and effects.3,18,36,43,65,75,103 A more detailed explanation on how to apply discount rates is presented in Box 5.
Discounting of costs
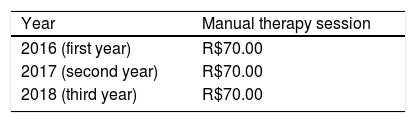
In the case study, discounting of costs was not necessary due to the 12-month follow-up.37 Therefore, a hypothetical situation is used in the example below.
In a hypothetical study with a 3-year follow-up, a discount rate of 5% was applied to the cost of a manual therapy session.
The cost of a manual therapy session was R$70.00. Discounting of costs for the second and third year were conducted using the formula below:
where P is the price of a manual therapy session in the present (i.e. present value), F0 is the price of a manual therapy session in the first year, F1 is the price of a manual therapy session in the second year, F2 is the price of a manual therapy session in the third year, and i is the discount rate (5%=0.05). Thus, if we would like to estimate the present value of the manual therapy session, we can do that as follows:

In trial-based economic evaluations, the sample size is usually estimated based on the anticipated clinically relevant difference in effect outcomes and not in costs. However, due to the right-skewed distribution of cost data (Fig. 1), larger sample sizes are required to detect relevant differences in costs than in outcomes that follow a normal distribution. This right-skewed distribution of costs is caused by the fact that the majority of patients has relatively low costs, while few patients have high costs. The large sample sizes that would be required for cost differences are infeasible, and it may be considered unethical to continue recruiting patients into a trial beyond the point at which clinical superiority has been determined beyond reasonable doubt.33,34,36,39,104–106 Consequently, trial-based economic evaluations are usually underpowered to detect relevant cost differences. To deal with this limitation, researchers are recommended to focus on estimation rather than hypothesis testing, that is on the relative magnitude of the cost and effect differences and their corresponding 95% confidence intervals (95%CIs), rather than on the corresponding p values.
Statistical methodsMissing data
In trial-based economic evaluations, missing data may be a larger problem than in effectiveness evaluations because total costs are the sum of different cost components collected at various time points. If only one cost component is missing, total costs will be missing as well.36,45 Missing data can be handled by simply deleting patients with missing values. This method, a so-called complete-case analysis, is not recommended, as it reduces a study's power and can lead to biased estimates. Moreover, not using all available data may even be considered unethical. Simple imputation methods, such as mean imputation and last observation carried forward, are also discouraged, because they do not account for the uncertainty related to filling in missing values.32 Multiple imputation is currently considered a valid method for handling missing data in trial-based economic evaluations.107–111 With multiple imputation, multiple datasets are created using multivariate techniques in which missing values are replaced by imputed values.110,112 The imputed data sets are analysed separately to obtain a set of parameter estimates, which can then be pooled using Rubin's rules to obtain overall estimates, variances, and 95%CIs.110,112
Skewed costsThe skewed distribution of costs violates the assumption of standard statistical tests (e.g. linear regression and independent t test) that the data are normally distributed. A standard approach for analyzing skewed data is to use standard non-parametric tests, such as a Mann-Whitney U test.36 However, such non-parametric tests do not provide an estimate of the mean difference in costs between study groups, whereas decision-makers need this information to estimate the total budget needed to treat all patients with the new intervention.
Another commonly used approach is to transform skewed data, after which the data follow a normal distribution, such as a logarithmic transformation. However, statistical estimates based on log-transformation are difficult to interpret, because the mean differences between groups are expressed on a log-scale.84 Back transformation will result in an estimate of the percentage of difference in costs between groups, instead of a mean difference.84 Therefore, the ISPOR RCT-CEA guideline recommends the use of non-parametric bootstrapping to deal with the highly skewed nature of cost data.32 With this approach, statistical analyses are based on repeated samples with replacement drawn from the original sample of the study (observed data).36,113 In summary, a sample of patients that is equal in size to the study group is repeatedly randomly drawn with replacement from the intervention and control groups, separately.36,113 Each resulting dataset is called a bootstrap sample and can be considered the mathematical equivalent of a replication of the study.36,113 Each bootstrap sample will differ from the original sample, because the replacement of patients means that a specific observation can be included more than once in a bootstrap sample. Then, the statistic of interest is estimated (e.g. difference in costs) for every bootstrap sample.36,113 Based on the central limit theorem, the distribution of the statistic of interest over the large number of bootstrap samples will approximate the normal distribution. The bootstrap samples can therefore be used to estimate confidence intervals (CIs).36,113 Several methods are available to estimate CIs, including the percentile and bias-corrected and accelerated (BCA) bootstrap.113,114 In the percentile method, 95%CIs are obtained by finding the values from the bootstrap distribution that correspond to the percentiles indicating the upper (97.5%) and lower (2.5%) bound of the CI.113,114 In the BCA method, CIs are estimated using percentiles that are adjusted based on the skewness and bias of the data.113,114 Of them, the BCA method is preferred. Research indicates that at least 2000 bootstrap samples are needed to produce reliable 95%CIs.115
Incremental cost-effectiveness ratioThe main outcome of interest in a trial-based economic evaluation is the incremental cost-effectiveness ratio (ICER).1,18,33,34,36,39,116 The ICER is calculated by dividing the difference in mean costs between study groups (incremental costs = ∆Cost) by the difference in mean effects (incremental effects = ∆Effect):1,18,33,34,36,39,116
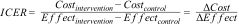
ICERs can be interpreted as the amount of money that needs to be invested to gain one unit of effect extra. For example, in a CUA, the ICER reflects the incremental costs per QALY gained. ICERs on their own are generally hard to interpret. To illustrate, a negative ICER might represent two opposite situations: the intervention may be less expensive and more effective (a win-win situation, that is dominant) or more expensive and less effective (a lose-lose situation, that is dominated) than the comparator.36 The cost-effectiveness plane (CE-plane) is often used to present ICERs. In the CE-plane, the difference in costs between groups is presented on the y-axis and the difference in effects on the x-axis, resulting in four quadrants.18,33,34,36,117,118 An ICER located in the northeast quadrant indicates that the intervention is on average more effective and more costly than the comparator. An ICER located in the southeast quadrant indicates that the intervention is on average more effective and less costly (dominant) than the comparator. An ICER located in the southwest quadrant indicates that the intervention is on average less effective and less costly than the comparator. An ICER located in the northwest quadrant indicates that the intervention is on average less effective and more costly than the comparator (dominated).18,33,34,36,117,118 An example of how to interpret ICERs is presented in Box 6.
Interpretation of trial-based economic evaluation results
In the case study, analyses were performed according to the intention-to-treat principle and multiple imputation was used for handling missing data.37 Non-parametric bootstrapping was used with 5000 replications and 95%CIs around cost and effect differences were estimated using the BCA approach.35
NW: northwest quadrant; SW: southwest quadrant; NE: northeast quadrant; SE: southeast quadrant The Fig. above shows the CE-plane for QALYs in the case study with a diagonal line representing a hypothetical WTP threshold.37 The red dot (in the center of the cloud) represents the point estimate of the ICER (∆Cost/∆Effect = R$525/0.04 = 12 508 R$/QALY), and the blue dots represent the 5000 bootstrapped cost-effect pairs. Thus, on average, exercise therapy incurred an additional cost of R$12 506 per QALY gained compared to control. Furthermore, most of the bootstrapped cost-effect pairs are located in the northeast quadrant (92.5%), followed by the southeast quadrant (7.5%), northwest quadrant (<0.1%), and southwest quadrant (0.0%). This indicates that exercise therapy is most likely to be more costly and more effective than advice.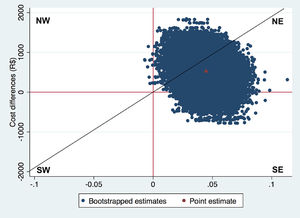
The diagonal line in the CE-plane represents a WTP threshold of 22 727 R$/QALY gained. This line divides the cost-effectiveness plane into a cost-effective part (i.e. below the line) and a non-cost-effective part (i.e. above the line). Hence, ICERs located below this line can be considered cost-effective and ICER located above this line cannot be considered cost-effective.34,36,117,118
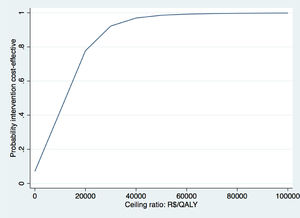
The Fig. above shows the CEAC for QALYs gained of the case study.37 CEAC shows the probabilities of cost-effectiveness on the y-axis and different WTP thresholds on the x-axis. We use the WTP threshold of R$45 455 per QALY gained (i.e. £20 000 per QALY gained) defined by the United Kingdom NICE here to evaluate whether exercise therapy was cost-effective compared to advice.119 This threshold was chosen, because a formal WTP threshold is not available for Brazil. At this WTP value, the probability of cost-effectiveness of exercise therapy compared to control was 95%. Based on these results, we concluded that exercise therapy is likely to be a cost-effective intervention compared to advice.
CE-planes can also be used to provide an indication of the uncertainty surrounding the ICER point estimate.18,33,34,36,117,118 Usually, the uncertainty surrounding a point estimate is given using 95%CIs. However, estimating 95%CIs around ICERs is not appropriate because the ICER is a ratio and therefore has an intractable distribution.18,33,34,36,117,118 Therefore, non-parametric bootstrapping is typically used to estimate the uncertainty surrounding ICERs. Subsequently, all bootstrapped cost-effect pairs are plotted on the CE-plane. It is good practice to also show the percentage of bootstrapped cost-effect pairs per quadrant of the CE-plane as shown in Box 6.
The next step is to decide whether the intervention is cost-effective in comparison with control. When the ICER and most of the uncertainty is located in the southeast quadrant of the CE-plane the intervention can be considered dominant over control and, thus, cost-effective, while the northwest quadrant indicates the opposite. However, in the other two quadrants, i.e. the northeast quadrant and the southwest quadrant, the decision is less clear and depends on the amount of money decision-makers are willing to pay per unit of effect gained. That is, an ICER that is located in the northeast quadrant can only be considered cost-effective if the ICER is smaller than some predefined Willingness To Pay (WTP) value, also known as WTP threshold.18
WTP thresholds are mainly defined for QALYs, while WTP thresholds for other important clinical outcomes in physical therapy research are lacking (i.e. pain intensity or disability).119 In the United Kingdom, the WTP threshold is £20 000 to £30 000 per QALY gained, while in the Netherlands the WTP threshold ranges between €10 000 and €80 000 per QALY gained depending on the severity of the health condition.119,120 In Brazil, there is no formal WTP threshold. The Brazilian guideline therefore recommends using the WTP threshold proposed by World Health Organization,121 which is based on the per capita Gross Domestic Product (GDP) and varies from R$34 500 to R$103 600. However, the true value of the WTP, and the WTP threshold for disease-specific outcomes, are often not known. Therefore, the probability of an intervention being cost-effective at different WTP values is presented in a Cost-Effectiveness Acceptability Curve (CEAC).18,33,36,122 The y-axis of a CEAC represents the probability of cost-effectiveness and the x-axis represents different WTP thresholds, that is the proportion of cost-effect pairs falling below a specific WTP threshold.36,117,122,123 An example of a CEAC can be found in Box 6.
Sensitivity analysesTrial-based economic evaluations are typically conducted in the context of incomplete information and uncertainty. Therefore, many assumptions need to be made. Sensitivity analyses should be performed to assess the robustness of the results to deviations from these assumptions.36,65 Examples of sensitivity analyses are assessment of how study results would change when using a different perspective (e.g. healthcare perspective versus societal perspective), a different questionnaire for estimating QALYs (e.g. SF-6D versus EQ-5D), or a different strategy for handling missing data (e.g. complete-case analysis versus multiple imputation). In the case study, we performed two sensitivity analysis.37 The first sensitivity analysis was performed from a healthcare perspective, and the second sensitivity analysis was performed per protocol, in which, only patients who attended more than 75% of the exercise sessions were included in the analyses.37
DiscussionBecause musculoskeletal disorders are associated with a high burden to society and physical therapy interventions are important in the treatment of musculoskeletal disorders, information on the cost-effectiveness of such interventions has been increasingly requested by decision-makers. Collaborations between physical therapists, researchers, and health economists are needed to generate high quality evidence on the cost-effectiveness of physical therapy interventions. In this masterclass, we discussed the most important aspects that need to be considered when performing a trial-based economic evaluation, that is the perspective, the time horizon, the identification, measurement, and valuation of costs and effects, and methods used for costs and effect comparisons, missing data and uncertainty.
Recently, the WHO-EU “Research Agenda for Health Economic Evaluation” project identified three important challenges to economic evaluations in musculoskeletal health that, if addressed, could improve the use of health economic evidence in practice.2,26 These challenges include the reporting quality of trial-based economic evaluations, their handling of uncertainty, and the issue of publication bias.26 An increased use of reporting guidelines for trial-based economic evaluations, such as the Consolidated Health Economic Evaluation Reporting Standards (CHEERS) statement may help improve the reporting quality of economic evaluations.26 The CHEERS can be used by researchers as a guide when designing and reporting an economic evaluation and by Journal editors to assess the quality of such studies during the peer-review process. The handling of uncertainty may be improved by encouraging researchers to estimate the precision of the cost-effectiveness estimates using non-parametric bootstrapping and to graphically illustrate the level of uncertainty in CE-planes and CEACs.26 Finally, publication bias may be reduced by encouraging researchers to publish all of the intended economic evaluations, instead of only those of clinical trials with positive effect outcomes.26
Clinical trials offer a unique opportunity to prospectively collect patient-level cost and effect data, and therefore to assess the cost-effectiveness of physical therapy interventions. Nonetheless, several recent randomized controlled trials in physical therapy did not include an economic evaluation.124–126 As the additional cost to conduct an economic evaluation alongside a clinical trial is only marginal, we encourage researchers in physical therapy to make the conduct of economic evaluations alongside clinical trials common practice.34 When an economic evaluation is not added onto an effectiveness evaluation, the opportunity is lost to collect and analyze cost and effect data simultaneouslty, which might in turn lead to the potential implementation of effective interventions that are not cost-effective.34 Because clinical practice is unruly, de-implementation of adopted intervention is difficult. Additionally, even though some researchers are of the opinion that economic evaluations should only be conducted and published after clinical effectiveness is established, we recommend researchers in physical therapy to always assess and report on the cost-effectiveness of their intervention, irrespective of the effectiveness results. Absence of a statistically significant cost and/or effect difference does not necessarily mean that an intervention is not cost-effective and/or cost-beneficial. That is, economic evaluations are about the joint distribution of costs and effects and high probabilities of cost-effectiveness can be found even when there are no significant differences in costs or effects. Moreover, reductions in costs can occur in the absence of clinical effects and could thus be missed if an economic evaluation is not performed.34,36
Decision-makers in healthcare are encouraged to use evidence from trial-based economic evaluations when deciding whether or not to implement and/or reimburse new interventions. In countries, such as Australia, the United Kingdom, and the Netherlands, the uptake of economic evaluation results in the healthcare decision-making process has increased considerably during the last decade(s).3,127,128 Although this process is most clearly applied for new pharmaceuticals, other interventions are also more and more subject to such rigorous evaluations. For example, in The Netherlands a randomized controlled trial was reimbursed pending the decision whether or not to include radiofrequency denervation for patients with chronic low back pain in the Dutch basic health insurance package. The study showed that radiofrequency denervation was not effective, nor cost-effective, when added to a standardized exercise program. As a result, radiofrequency denervation was no longer covered by public health insurance in The Netherlands.128,129
Trial-based economic evaluations are considered the “gold standard” for making inferences about the cost-effectiveness of physical therapy interventions.32,34,45,46 However, the large sample size required by the skewed costs is often unfeasible for trial-based economic evaluations and follow-up in randomized controlled trials is typically not long enough to detect all relevant differences in costs between study groups. Furthermore, (trial-based) economic evaluations are typically conducted in research settings that do not resemble actual clinical practice. Finally, the use of different perspectives limits the generalizability and transferability of results to other settings and/or countries.
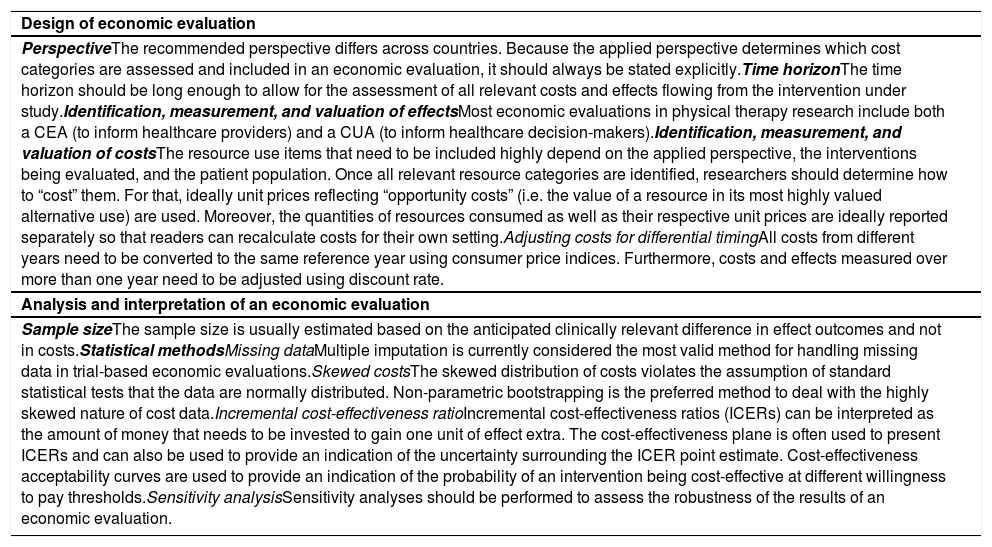
ConclusionEconomic evaluations are increasingly being used in healthcare decision-making. Therefore, it is of utmost importance that their design, conduct, and analysis are state-of-the-art and that their interpretation is adequate. This masterclass may help physical therapists, researchers, and decision-makers in the field of physical therapy to better understand trial-based economic evaluations with the ultimate goal of increasing translation of the results of such studies into clinical practice. Table 1 describes a summary of recommendations for trial-based economic evaluation of musculoskeletal physical therapy interventions.
Summary of recommendations for trial-based economic evaluation of musculoskeletal physical therapy interventions
GCM was granted a post-doctorate fellowship from São Paulo Research Foundation (FAPESP), process number: 2019/09593-0. CCL is funded from a fellowship from the National Health and Medical Research Council, Australia.


