


Alterations of frontal plane patellar alignment could be related to lower limb disorders. Clinical assessment must be able to identify the influence of non-local factors in patellar alignment.
ObjectiveTo identify the influence of lower limb torque, range of motion (ROM), and foot alignment on patellar rotation in healthy athletes.
MethodsThis cross-sectional study was performed with 232 healthy basketball and volleyball elite athletes. Participants were assessed in preseason for: patellar medial and lateral rotation (Arno angle), passive hip internal rotation (IR) ROM, iliotibial band flexibility, hip abductors and external rotators (ER) torque, shank-forefoot alignment (SFA), and ankle dorsiflexion ROM. Hierarchical multiple linear regression was performed to identify if these variables and sex, age, and body mass could be associated with patellar rotation in a standing position.
ResultsHip ER isometric torque explained a small part (10%) of the variance of the Arno angle in healthy athletes (R² change=0.10; unstandardized ß=11.74 (95% CI 6.82, 16.65); Standardized Coefficient Beta=0.32) and sex explained 2% of its variance (R² change=0.02; unstandardized ß= 2.42 (95% CI 0.32, 4.52); Standardized Coefficient Beta=0.15). After controlling for sex, hip ER torque explained 9% of Arno angle variance (R² change=0.09; unstandardized ß= 11.09 (95% CI 6.43, 15.76; Standardized Coefficient Beta=0.31). The other variables were not associated with patellar rotation.
ConclusionsHip ER torque may influence patellar rotation in different directions (medial or lateral rotation). Possible mechanisms that explain the contribution of higher and lower hip ER torque in lateral and medial patellar rotation, respectively, are discussed.
Sports that place high demands on the lower limbs frequently show high incidence of injuries, which may result in training limitations and impairment in sport practice.1 For example, the prevalence of patellar tendinopathy in elite volleyball and basketball players is around 40%2 and patellofemoral pain represents approximately 25% of all the knee conditions seen in a sports clinic.3 Anterior knee overload may be related to patellar misalignment, being described as an abnormal positioning of the patella in any plane,4 such as alteration of frontal plane patellar alignment (patellar rotation).5,6 Patellar misalignment may cause imbalance of forces exerted on periarticular tissues and alter pressure distribution of the patellofemoral joint contact areas.7,8 Considering the influence of the hip and foot on knee biomechanics9–12 it is possible that non-local factors may contribute to patellar alignment.
Frontal plane patellar alignment is influenced by passive (e.g. lateral and medial retinaculum, ligaments, tendons, iliotibial band, and patellar joint geometry) and active stabilizers (e.g. quadriceps muscle).13,14 Due to the interdependence between the lower limb joints during weight-bearing activities, factors that cause excessive femoral movement in the frontal and transverse planes could result in alterations in frontal plane patellar alignment.13,15 Proximally, the hip abductors and external rotators must contract eccentrically to control femoral adduction and internal rotation,16 and weakness of these muscles could result in an increase in these movements.17 In addition, a decrease in hip joint passive stiffness may increase femoral internal rotation during weight-bearing activities.10 Moreover, distal factors such as limited ankle dorsiflexion range of motion (ROM) and increased varus forefoot alignment can lead to excessive subtalar pronation.18–20 Considering the coupling between the movements of the ankle-foot complex and the lower limb in the transverse plane, it has been postulated that excessive subtalar pronation would be associated with excessive tibial and femoral internal rotation.21 Therefore, the identification of non-local contributing factors to patellar alignment in the frontal plane is necessary to provide evidence about factors that need to be assessed in athletes with patellar misalignment.
Magnetic resonance imaging (MRI) and computed tomography (CT) can be used to measure patellar rotation.6,22 However, it might be challenging to apply these high-cost techniques in a clinical context.6,22 Thus, feasible methods, involving observation and palpation, have been proposed to assess patellar alignment. Arno angle is a quantitative measure of frontal plane patellar alignment in relation to the tibia23–26 and it has been shown to be a reliable measurement when performed in standardized conditions.27 Identifying how non-local factors interact and alter patellar alignment is essential to provide information to guide assessment and future studies in developing effective prevention and intervention strategies aiming to correct patellar alignment. Therefore, the aim of this study was to identify the influence of passive hip stiffness and hip torque, iliotibial band flexibility, foot alignment, and ankle dorsiflexion ROM on frontal plane patellar rotation (Arno angle) in healthy elite athletes.
MethodsStudy designThis cross-sectional study was approved by the Ethics in Research Committee of the Universidade Federal de Minas Gerais, Belo Horizonte, MG, Brazil (Approval Report number 0493.0.203.000-09).
ParticipantsThis study was part of a larger research project which involved the development of sport injury prevention programs based on preseason assessment results of youth and adult athletes. Sample size was defined based on the criterion of 10 participants for each independent variable in the regression model, that resulted in a minimum of 60 individuals. The athletes were recruited from 4 local volleyball and basketball teams.
Two hundred and thirty-nine elite athletes (72 female and 167 male), from basketball (n = 68) and volleyball (n = 171), participated in the preseason assessment. Inclusion criteria were: no history of lower limb or spine surgery or injury in the past 6 months and absence of symptoms in the lower limbs at the time of assessment. Athletes with a history of recurrent patellar dislocations and anterior cruciate ligament reconstruction were not included. Athletes were excluded if they couldn't follow the examiner instructions and/or had pain during the assessment. The participants read and signed the consent form prior to participation.
Assessment protocolAthletes’ assessment was performed in the preseason week and consisted of the following tests, performed on the dominant lower limb. The dominant lower limb was defined by asking the athlete which leg they would use to kick a ball.28
Frontal plane patellar alignment: Arno angleThe Arno angle was assessed with reflective markers attached to the midpoint of the superior and inferior poles of the patella, and the anterior tibial tuberosity.27 The markers were placed while the athlete maintained a bipedal standing position with 30° of knee flexion to allow retinacular tension.6,29,30 This position was chosen because the positioning in supine with knee extension do not consider the biomechanical influences of distal (e.g. shank and foot) and proximal body segments (e.g. hip and thigh) that may influence patellar alignment through retinaculum tensioning.27,31–33 A wooden stick was positioned over the shoulders to avoid trunk rotation or lateral flexion. Then a photographic record (SC-D385; Samsung®) was performed (Fig. 1A).
 Position for assessment of Arno angle; (B) Arno angle measurement (indicating lateral patellar rotation in a left lower limb in the figure); (C) shank bisection for shank-forefoot alignment measurement (left lower limb); (D) shank-forefoot alignment measurement (left lower limb); and (E) ankle dorsiflexion range of motion measurement.")
(A) Position for assessment of Arno angle; (B) Arno angle measurement (indicating lateral patellar rotation in a left lower limb in the figure); (C) shank bisection for shank-forefoot alignment measurement (left lower limb); (D) shank-forefoot alignment measurement (left lower limb); and (E) ankle dorsiflexion range of motion measurement.
To determine the medial and lateral patellar rotation, a trained examiner analysed a 30-Hz digital video frame using the software Simi Motion Twin®. The Arno angle was defined as the angle between the patellar bisection (dotted line between midpoint of the base and inferior pole of the patella) and the patellar tendon bisection (solid line between the inferior pole of the patella and tibial tuberosity) relative to the patellar tendon (Fig. 1B).32 Patellar rotation in the frontal plane can be classified as lateral rotation (the patella's bisection is pointed laterally to the patellar tendon bisection) or medial rotation (the patella's bisection is pointed medially to the patellar tendon bisection).5,34 The mean of three measures was used for analysis. A pilot study with 9 subjects and a 7-day interval between assessments determined the reliability of these measures (intraclass correlation coefficient (ICC3,3) and standard error of measurement (SEM) were: intra-rater= 0.95 (95% CI: 0.84, 0.98); SEM: 0.26° and interrater ICC3,3 = 0.90 (95% CI: 0.71, 0.97); SEM: 0.33°. Negative values for Arno angle indicate medial rotation and positive values indicate lateral rotation based on normative values previously published.27
Passive hip internal rotation (IR) range of motion (ROM) assessmentPassive hip IR ROM was determined as the angular position of the hip at which the torque produced by the mass of the lower leg and foot was equal to the passive-resistance torque generated against further hip internal rotation.35 This measure has shown to be associated with hip stiffness.35 In this way, greater hip internal rotation is indicative of lower hip stiffness.36
The participant lied in a prone position, with the pelvis stabilized and the knee of the dominant lower limb flexed at 90°. The examiner supported the lower leg while the hip was moved into internal rotation. The position that the passive tension produced by hip structures stopped the movement was recorded (Fig. 2A). Measurements were performed using an inclinometer (Starrett®) positioned 5 cm distal to the anterior tibial tuberosity. Three measurements were performed and the mean was used for analysis. Both intra- and inter-rater reliability were the same with ICC3,3 = 0.99 (95% CI: 0.96, 0.99); SEM= 0.55° in a pilot study with 6 subjects and a 7-day interval between assessments.
Iliotibial band flexibility assessment: modified Ober's test
The participant was side lying on the non-dominant side, with arms crossed in front of the chest. The examiner held the upper (dominant) leg and moved the participant's hip into flexion, abduction, and extension (in this sequence), maintaining neutral rotation (Fig. 2B).37 After fully extending the hip and knee, the examiner withdrew the lower limb support and placed an inclinometer above the lateral femoral condyle to assess iliotibial band flexibility.37 Positive values were attributed to the presence of hip adduction and negative values refer to the presence of hip abduction. Three measurements were performed and the mean was recorded for analysis. A pilot study, with 6 participants and a 7-day interval between assessments, demonstrated excellent intra-rater (ICC3,3 = 0.99; 95% CI: 0.93, 0.99); SEM= 0.12° and inter-rater (ICC3,3 = 0.94; 95% CI: 0.89, 0.97); SEM= 0.31° reliability.
Hip abductors and external rotators (ER) torque assessmentHip abductors and ER isometric strength were measured using a hand-held dynamometer (microFET2®). For the hip abductors test, the dynamometer was firmly positioned 5 cm proximal to the knee joint. The participant was lying on the non-dominant side, with arms crossed in front of the chest and the trunk was stabilized (Fig. 2C).36,37 Peak isometric torque produced by the hip abductors was calculated using the mean of 3 strength measures (15 s interval between trials) and the distance from the greater trochanter to the dynamometer (lever arm).
For the assessment of hip ER isometric strength, the hand-held dynamometer was positioned with an apparatus and a rigid strap at the medial aspect of the ankle. The subject was lying prone, with the pelvis stabilized and the knee of the dominant lower limb flexed at 90° (Fig. 2D).17,37 The subject performed progressive isometric contractions of hip ER until the examiner perceived compensatory movements (i.e. trunk/pelvis rotation, hip adduction) and stopped the test.37 Hip ER torque was calculated using the mean of 3 strength measures (15 s interval between trials) and the distance from the medial femoral condyles to the dynamometer (lever arm).
For each muscle test, the force values produced (kg) for the mean of the 3 trials were converted to Newtons (kilograms x 9.81) to achieve a unit of force. Newtons were converted to torque values [force (N) x lever arm of the segment (m)]. Torque values were then normalized by body mass (Nm/kg) of each participant to minimize the influence of anthropometric differences between subjects. A pilot study with 6 subjects and a 7-day interval between assessments demonstrated an intra- and inter-rater reliability of ICC3,3 = 0.94 (95% CI: 0.92, 0.96); SEM= 0.83 Nm/kg and ICC3,3 = 0.90 (95% CI: 0.88, 0.92); SEM= 1.10 Nm/kg for hip abductors and of ICC3,3 = 0.98 (95% CI: 0.98, 0.99); SEM= 0.23 Nm/kg and ICC3,3 = 0.90 (95% CI: 0.89, 0.91); SEM= 0.53 Nm/kg for hip ER, respectively.
Shank-forefoot alignment (SFA) assessmentThe participant was lying prone, with the foot to be assessed off the table.38 The examiner marked the midpoint between the tibial plateaus and the midpoint between medial and lateral malleoli to bisected the shank (Fig. 1C) and positioned a metal rod on the plantar aspect of the forefoot (Fig. 1D). With a goniometer (Carci®), the examiner positioned the subject's foot in neutral ankle dorsiflexion/plantar flexion, requested the athlete to actively maintain this position, and photographed the foot (D5000; Nikon®). The SFA was determined through photograph analysis using the software Simi Motion Twin®. The SFA was defined as the angle between the bisection of shank and the orientation of the metal rod positioned under the metatarsophalangeal region. The mean angle obtained of 3 photos was used for analysis. Negative values were assigned to valgus SFA and positive values to varus SFA. A pilot study with 10 subjects and a 7-day interval between assessments demonstrated excellent intra-rater (ICC3,3 = 0.93; 95% CI: 0.75, 0.97; SEM= 2.01°) and inter-rater (ICC3,3 = 0.90; 95% CI: 0.72, 0.95; SEM= 2.47°) reliability.
Ankle dorsiflexion range of motion (ROM)This assessment was performed in a weight bearing position, using the lunge test. A line was placed on the floor up to the wall. The participant placed the tested foot along the floor line so that the line bisected the heel and the second toe.39 Then, the participant was instructed to move the knee forward until it touched a vertical line on the wall, without lifting the heel off the floor (Fig. 1E). After reaching maximum ROM, an inclinometer was placed 15 cm from the anterior tibial tuberosity to define maximum inclination angle of the leg relative to the vertical line.39,40 The mean value of three measures was used for analysis (intra-rater reliability ICC3,3 = 0.98; 95% CI: 0.92, 0.99; SEM= 0.02°; inter-rater reliability ICC3,3 = 0.92; 95% CI: 0.89, 0.97; SEM= 0.04°).
Statistical analysisDescriptive statistics was performed for all variables. Normal distribution of the Arno angle data was confirmed using the Shapiro-Wilk test. Hierarchical multiple linear regressions, using the enter procedure, were performed to identify if passive hip IR ROM, iliotibial band flexibility, hip abductors and ER torque, SFA, and ankle dorsiflexion ROM were associated with patellar rotation (Arno angle) in a standing position. The influence of age, sex, and body mass on the regression models was also investigated. The independent variables age, body mass, passive hip IR ROM, iliotibial band flexibility, and hip ER torque were transformed into a logarithmic scale as they did not present a parametric distribution.
Multicollinearity between the predictors were tested by examining Pearson´s correlation coefficient, tolerance level, and inflation factor. The predictors were not strongly correlated (r<0.7) and presented tolerance levels and variance inflation factors of >0.10 and <10, respectively. The assumptions of normality and homoscedasticity of residuals were tested. The significance was set at α= 0.05. SPSS 14.0 software (SPSS Inc., Chicago, IL) was used for all analysis.
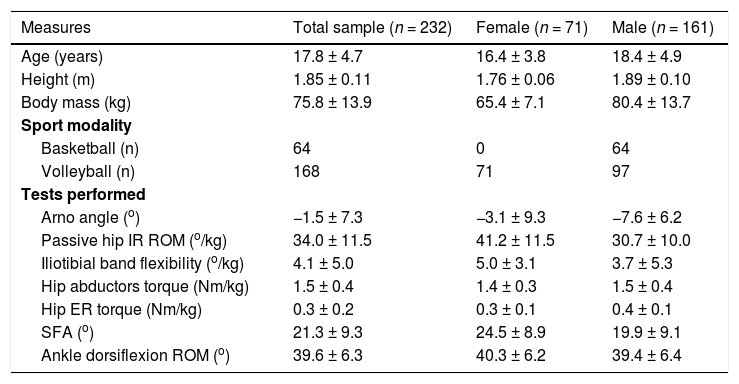
ResultsInitially, a total of 239 athletes were assessed. Seven athletes were excluded because they could not relax to perform the modified Ober's test (n = 4) or the passive hip IR ROM assessment (n = 3). Therefore, 232 athletes participated in this study. Table 1 presents the descriptive data.
Participant's characteristics, Arno angle, passive hip IR ROM, iliotibial band flexibility, hip torque, SFA, and ankle dorsiflexion ROM data.
Data are presented as mean ± standard deviation; except for sport modality (n). Abbreviations: IR, internal rotation; ROM, range of motion; SFA, shank-forefoot alignment.
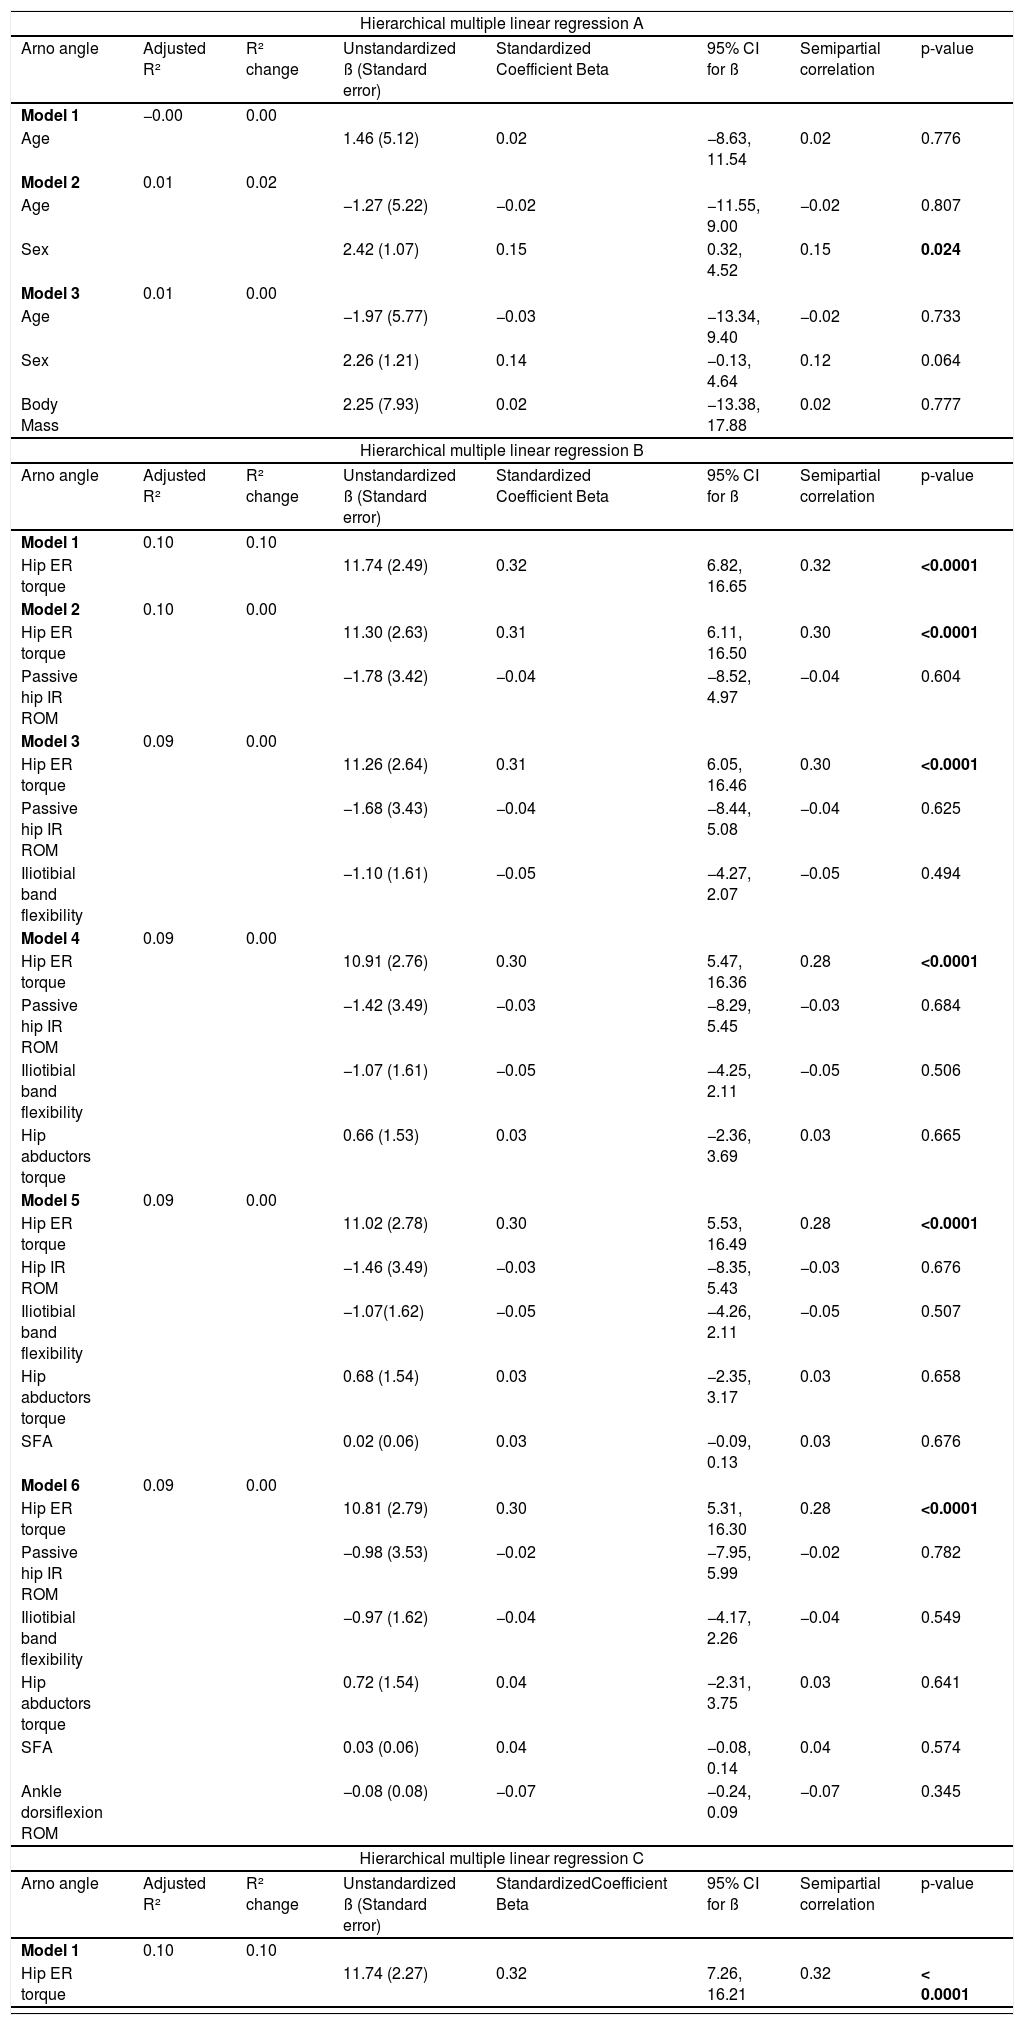
Table 2 shows the results for the hierarchical regression models performed. In the first regression (A), model 2 showed that sex explained 2% of the variance of the Arno angle (adjusted R²= 0.01; R² change= 0.02; unstandardized ß =2.42 (95% CI: 0.32, 4.52). Age and body mass were not significantly associated with Arno angle.
Results for the hierarchical multiple linear regression. Regression A considers the influence of age, sex, and body mass on Arno angle. Regression B is for the influence of passive hip IR ROM, iliotibial band flexibility, hip torque, SFA, and ankle dorsiflexion ROM on Arno angle. Regression C is for the influence of hip ER torque on Arno angle. Regression D is for the influence of age, sex, body mass, and hip ER torque on Arno angle and regression E is for the influence of sex and hip ER torque on Arno angle.
Abbreviations: R², coefficient of determination; ß, standardized coefficient; CI, confidence interval; ER, external rotators; IR, internal rotation; ROM, range of motion; SFA, shank-forefoot alignment.
In the second regression (B), hip ER torque was associated with Arno angle in a standing position, but it explained only 10% of the variance (adjusted R²= 0.10; R² change= 0.10; unstandardized ß = 11.74 (95% CI: 6.82, 16.65). Specifically, higher hip ER torque was associated with higher values of lateral patellar rotation. Passive hip IR ROM, iliotibial band flexibility, hip abductors torque, SFA, and ankle dorsiflexion ROM were not associated with patellar rotation in healthy athletes. Fig. 3 presents the scatter plot for Arno angle and hip ER torque (regression C). After adjusting for sex (regression E), hip ER torque explained 9% of the variance of the Arno angle (adjusted R²= 0.10; R² change= 0.09; unstandardized ß = 11.09 (95% CI: 6.43, 15.76).

We further explored the independent variables in other regression models, but the only lower limb variable that was associated with Arno angle was hip ER torque (Table 2and Supplementary file 1).
DiscussionOur results showed that hip ER isometric torque explained a small part (10%) of the variance of the Arno angle in healthy athletes. More specifically, higher hip ER torque was associated with higher values of lateral patellar rotation. Sex explained a minor part (2%) of the variance of the Arno angle. Because patellar misalignment is related to some pathologies,6,13,15,31 early identification of possible contributing factors is desirable.
Although patellar misalignment is thought to be one of the contributing factors for patellofemoral joint pathology,18 evidence specifically regarding the association between frontal plane patellar rotation and these conditions are sparse. In a cross-sectional study, DiVeta and Vogelbach26 found that individuals with patellofemoral dysfunction had higher Arno angle values when compared with asymptomatic individuals. However, their study26 was not performed with athletes and the patellar rotation was measured in a supine position, with a goniometer, a method that has shown poor inter-tester reliability.23,24,26 Considering these limitations, our study aimed to assess frontal plane patellar rotation in a standardized manner, that has been shown to have high intra- and inter-rater reliability.27 Also, the investigation of the possible contribution of lower limb segments in the frontal plane patellar rotation add useful information to the body of knowledge regarding static patellar alignment measurement.
The only lower limb variable associated with patellar rotation was hip ER torque. Hip abductors and ER muscles contribute to control excessive transverse and frontal plane femoral movements.16,17,36 In our results, higher values of hip ER torque were associated with lateral patellar rotation. Adequate hip ER strength help in controlling lower limb excessive internal rotation.17,41 Strength of this musculature may exert an external rotator torque on the femur and on the tibia.42 We speculate that it may contribute to tibial external rotation and predispose to patellar lateral rotation when the femur is fixed.13 Lower values of hip ER torque could be related to medial patellar rotation, which could be explained by excessive femoral IR and, consequently, tibial IR, when the femur is fixed.13,18 This patellar misalignment could negatively alter the pressure distribution for the patellofemoral joint contact areas and overload the patellar tendon.32 Because we did not measure femoral internal rotation, this linkage and consequences remains as a supposition. But, there is a systematic review concluding that individuals with patellofemoral pain have hip strength deficits.43 Considering that patellar misalignment may occur due to hip musculature strength deficits13,18 and it may be a contributor to patellofemoral pain development,44 hip strength should be taken into account. Therefore, we suggest that hip ER muscles could be assessed in athletes with altered Arno angle.
Sex explained only 2% of the variance of the Arno angle. There is evidence indicating that anatomical (e.g., tibiofemoral rotation kinematics and trochlear groove orientation) and muscular factors45,46 could differ between sexes, but it did not seem to have a direct impact on frontal plane patellar rotation.
The other variables included in the model (hip IR ROM, hip abductors torque, ankle dorsiflexion ROM, iliotibial band flexibility, and SFA) were not associated with patellar rotation. Although passive hip stiffness ensures muscle control during dynamic activities35 and a low amount of stiffness can lead to excessive hip IR movement10 that could alter patellar alignment,13 this idea was not confirmed. Similarly, the theory that hip abductors weakness may cause excessive femoral movements in the frontal and transverse planes15,16 that could cause patellar misalignment13 was not supported by our results.
Recently, attention has been focused on patellofemoral misalignment associated with foot/ankle impairments.44 For example, increased varus forefoot alignment during weight-bearing activities47 and restricted ankle dorsiflexion ROM may lead to increased subtalar pronation and, consequently, tibial internal rotation.48 Tiberio21 described a theoretical model where excessive subtalar pronation can lead to tibial internal rotation and subsequent femoral internal rotation that could alter patellar alignment.21,48 However, Reischl et al.49 found that the magnitude of foot pronation was not predictive of the magnitude of tibial or femoral rotation. Then, this study raises the assumption that ankle ROM and forefoot alignment may not have a direct influence in the frontal plane patellar rotation. This mechanism is also supposed to cause a shortening of the iliotibial band that could alter patellar alignment,50,51 but our study did not corroborate these concepts.
Therefore, the results of this study did not support the theoretical models described above and our hypothesis. One possible explanation for these results is that Arno angle is a static measure that may not be able to capture the interactions that may occur during dynamic activities. Also, no other study has analysed the influence of lower limb segments in the frontal plane patellar rotation, which made it difficult to compare the assessment methods and results.
A strong point of the study was the measurement of Arno angle in a closed kinetic chain with 30° of knee flexion (allowing retinaculum tensioning),6,29,30 because patellar alignment measurement in supine ignores the influence of proximal (thigh and hip) and distal (leg and foot) factors on retinacular tension and consequent contribution to the patella's alignment.27,31–33 The Arno angle measurement was bidimensional and not three-dimensional as the gold standard. Despite this limitation, our pilot study demonstrated high intra- and inter-rater reliability for the bidimensional measurement of Arno angle. Although the Arno angle measurement demonstrated high reliability, future studies should validate this measurement against imaging (e.g., MRI, CT) to confirm its clinical applicability. Also, our cross-sectional design cannot establish a causal relationship between non-local factors and changes in patellar rotation. Therefore, we suggest that future longitudinal studies could explore the relationship between musculoskeletal (local and non-local) factors with the occurrence of patellar misalignment to properly guide interventions.
ConclusionThe present study established the association of higher hip ER isometric torque with higher values of lateral patellar rotation in healthy elite athletes. However, hip ER isometric torque explained only a small part (10%) of the variance of the Arno angle. Sex explained 2% of its variance. The relevance of these findings on clinical practice for individuals with anterior knee pain remains to be determined.
This study was financed in part by the Coordenação de Aperfeiçoamento de Pessoal de Nível Superior - Brasil (CAPES) - Finance Code 001. We thank you all athletes who participated in this study.


