

Habitual physical activity (HPA) can be used as a non-pharmacological strategy to prevent and control chronic diseases, as well as playing a role in minimizing healthcare costs.
ObjectiveTo verify the impact of HPA on healthcare costs at different levels of care, over 24 months, in an adult population with cardiovascular diseases (CVD), including individuals with or without comorbidities.
MethodsTwo-hundred and seventy-eight adults with CVD, aged between 30 and 65 years, participated in the study. Information on healthcare costs was obtained from medical records and included primary, secondary, and tertiary levels. Comorbidities such as diabetes, dyslipidemia, arterial hypertension, and obesity were registered. HPA was measured using the Baecke questionnaire. Comparisons between groups were performed using Student's t (
ResultsThe presence of comorbidities increased healthcare costs (p<0.05). HPA provided savings ranging from US$ 22.5/24 months to US$ 63.9/24 months with primary healthcare services, regardless of the presence of comorbidities.
ConclusionConsidering adults with CVD, HPA significantly minimizes healthcare costs in the primary care in Brazil, even in the presence of comorbidities, such as diabetes, dyslipidemia, arterial hypertension, and obesity.
Cardiovascular diseases (CVD) are considered the main cause of death in the world,1,2 and are responsible for high expenditure with healthcare services.3-6 Comorbidities, such as diabetes, dyslipidemia, arterial hypertension, and obesity, can increase the likelihood of complications related to already established CVD2,7 and, consequently, impact costs related to treatment.3,8
The impact of comorbidities on healthcare costs has been reported in different settings.9-13 Conversely, the practice of physical activity can minimize the physiological effects and progression of these comorbidities,14-17 assisting with the reduction in healthcare costs.18,19
Worldwide, in 2013, health expenditure attributable to physical inactivity was US$53.8 billion (0.64% of the total/year), of which US$31.2 billion was paid by the public sector.13 Considering different regions of the world, physical inactivity accounts for, in average, 0.84% of the total health expenditure in North America, 0.76% in the Eastern Mediterranean region, 0.55% in Europe, 0.54% in the Western Pacific region, 0.33% in Africa, 0.30% in Latin America and the Caribbean, and 0.22% in Southeast Asia.13
A systematic review identified a considerable economic burden due to insufficient physical activity in low and middle-income countries and an inverse relationship of physical activity with the cost of chronic diseases.20 In Brazil, physical inactivity was responsible for 1% of medication expenses and 0.7% of total expenses with health services, in 963 individuals aged over 50 years treated at the Brazilian Unified Health System.21 These percentages are similar to those previously cited13 and are considered relevant.
Although some Brazilian studies have associated physical inactivity and health expenses, it is worth mentioning the fragility of national data with respect to the following: i) there is little information on the subject involving populations with specific diseases, and also involving associated comorbidities; ii) there is a lack of studies that present real-life data (most studies present their results through estimates); and iii) there is a lack of reports that encompass health costs at different levels of care.
The objective of the current study was to verify the impact of habitual physical activity (HPA) on healthcare costs, at different levels of care, over 24 months, in an adult population with CVD, including individuals with or without comorbidities.
MethodsSample design and selectionThe study uses a descriptive research model, with transversal evaluation among the participants (July 2018), and longitudinal analysis of costs (12 months prior and 12 months after [July 2017 to June 2019] the date of the transversal evaluation) (Fig. 1). The starting point for sample selection was the medical records of the Regional Hospital (RH) in the city of Presidente Prudente (∼ 200,000 inhabitants), located in the Western region of the State of São Paulo/Brazil, which offers referral care of medium and high complexity, totally free of charge, through the Brazilian Unified Health System (i.e., the SUS health system, which provides free of charge health care for the population using public sector resources), to 45 municipalities in the Western region of the State, serving 447.36 patients/day on average.

The RH was asked to select all medical records of patients who were admitted for cardiovascular reasons (i.e., category I of the International Statistical Classification of Diseases and Related Health Problems – ICD) in the 12 months prior to the first assessment and who met the following inclusion criteria: i) aged between 30 and 65 years (age group with a high prevalence of chronic diseases in Brazil)22 ; ii) used the services offered by the Brazilian Unified Health System due to CVD in the previous 12 months; iii) resident of the city of Presidente Prudente, where the researchers had permission to obtain information regarding healthcare services at primary (PHC), secondary (SHC), and tertiary (THC) levels. A total of 1200 medical records fitting those criteria were identified.
Medical records meeting the criteria mentioned above were randomly selected, with simple random sampling, using a statistical software, until the minimum calculated sample size was reached. Due to the absence of data about the relationship between physical activity and healthcare costs using real world data (assessed directly from the medical records) for adults between 30 and 50 years of age, we ran the sample size calculation using the closest information available in the literature, in this case, for adults over 50 years of age. Thus, to calculate the sample size we used an equation considering a relationship between physical activity and healthcare costs in adults older than 50 years (correlation results: r = −0.23, p-value= 0.011),23 statistical power of 80% and alpha error of 5%.24 An initial minimum sample size of 147 people was estimated. Finally, when adding 40% for losses (estimated from previous studies involving analyses of public health costs),12 a minimum of 206 people was required to participate in the study.
From the list of 1200 patients provided by the RH, random draws in blocks of 300 patients per draw were performed using STATA software, version 16.0. It was necessary to perform 3 draws of 300 patients, with only 194 patients contacted in the final draw to reach the minimum sample size calculation (Fig. 1). Among the 794 phone numbers verified by the researchers, 278 were for patients who participated in the study (among which, none of the participants presented missing data). Sample losses are shown in Fig. 1.
The researchers contacted patients at the beginning of the week, scheduling them for another day in the same week according to their availability. Therefore, in the last week of evaluation, when the minimum number stipulated by the sample size was reached, the researchers continued evaluating all scheduled patients, leading to a total sample of 278 patients.
Eligible patients were contacted by phone and invited to participate in face-to-face interviews and assessments. Those who agreed to participate visited the assessment site (Universidade Estadual Paulista) and signed the consent form. The research proposal was approved by the Research Ethics Committee of the Universidade Estadual Paulista, Presidente Prudente Campus, Brazil (CAAE: 82,767,417.5.0000.5402).
Estimation of healthcare servicesThe monetary values were estimated using the perspective of the SUS, based on the sum of resources used directly in the treatment of the patient, micro-costing (bottom up) approaches were used to estimate costs.25
Healthcare services/procedures (PHC, SHC, and THC) listed in the medical records of each patient were collected, in a time horizon of 24 months (12 months prior and 12 months after the date of the initial assessment), this being the best methodological design found by the researchers to obtain a longer follow-up time on the cost variable. There is an absence of widely accepted methodologies to accurately estimate healthcare expenditures. Therefore, with regard to the costs of PHC, we adopted the methodology described in the previous studies,21,23,26 which briefly consists of initially gaining permission from the local municipality health secretariat, after which the researchers obtain access to the medical records of the patients involved in the research and collect the registered information regarding medical consultations, medication dispensed, specific consumables, and diagnostic services. In addition, the Municipal Secretary of Health provided information about attendance services and utility bills of the healthcare unit.21,23,26
Costs with healthcare services relating to PHC, including medical consultations, attendance services, utility bills, medication dispensed, and diagnostic services, are described below:
- i)
Medical consultations: costs were retrieved from the SUS System Management Procedures Table (SIGTAP), provided by the Ministry of Health;
- ii)
Attendance services (i.e., scheduling, medication dispensing, management, etc.): costs were calculated using the daily salary rate of the professionals involved in the services provided (monthly salary divided by 30 days) and the average number of patients seen daily (daily salary rate divided by the number of daily visits);
- iii)
Utility bills of the healthcare unit (electricity, water, and telephone): costs were calculated using the average of the last three months for each utility bill, divided by 30 days. The utility bill value was then divided by the number of patients seen daily.
- iv)
Medication dispensed, specific consumables, and diagnostic services (laboratory tests and others): costs were calculated using the specific cost of each standard procedure multiplied by the number of procedures performed.
Information regarding salaries, costs of laboratory procedures, consumables, medications, and utility bills were provided by the Municipal Secretary of Health.
Services related to SHC and THC were estimated considering emergency visits, diagnostic imaging and laboratory tests, hospitalizations, surgeries, hemodialysis, as well as medication and consumables used for inpatient care. Costs related to these services/procedures were, in their entirety, provided by the RH, without the need for data collection and calculations performed by the researchers.
Habitual physical activityIn the transversal evaluation, HPA level was measured using the Baecke questionnaire.27 This questionnaire was previously validated for Brazilian Portuguese and recommended for epidemiological studies in Brazil.28 The instrument evaluates HPA in three domains: occupational (8 questions), sports (4 questions), and leisure-time (4 questions). The sum of the three domain scores comprises total level of HPA. The possible HPA score ranges from 3 to 15. The higher the total score obtained with the sum of the three domains, the greater the level of HPA.
Other variablesAll variables described in this session were collected in the transversal evaluation. The patients reported sex and age during the interviews. Information regarding level of education was self-reported. Healthcare services/procedures listed in the patient's medical record were coded according to the International Statistical Classification of Diseases and Related Health Problems (ICD), as follows: I10-I15 = Hypertensive diseases; I20-I25 = Ischemic heart disease; I26-I28 = Pulmonary heart disease and diseases of pulmonary circulation; I30-I52 = Other forms of heart disease; I60-I69 = Cerebrovascular diseases; I70-I79 = Diseases of arteries, arterioles, and capillaries; I80-I89 = Diseases of veins, lymphatic vessels, and lymph nodes, not classified elsewhere.
Diabetes, dyslipidemia, arterial hypertension, and obesity were considered as comorbidities associated with CVD.2 The sum of the comorbidities ranged from 0 to 4 and was considered as a confounding variable in the relationship between HPA and healthcare costs. In a face-to-face interview, the patient was asked about having a diagnosis of and/or any medication taken for these comorbidities.
Height was measured using a stadiometer (Sanny, American Medical do Brasil Ltda, Brazil, 0.1 cm precision). The weight and body fat percentage (%BF) were verified by the device (InBody, model 230), which estimates the percentage of body fat through bioelectrical impedance analysis. To assess %BF, participants were instructed not to drink caffeine, to empty their bladder, and not to eat for two hours before the analysis, to wear light clothing, and no jewelry, accessories, or belts, and not to practice strenuous exercise for 24 h before the analysis. Obesity status was classified according to the recommendations of the American College of Sports Medicine29 for % BF.
Statistical analysisData normality was verified by the Kolmogorov-Smirnov test. Descriptive statistics consisted of mean, standard deviation (SD), median, and interquartile range (IQR), and inferential statistics were represented by the 95% confidence interval (CI).
The questionnaire used in this research to measure HPA does not have a cut-off score for classifying individuals. For this reason, for statistical analysis, the HPA score was divided into percentiles: ≥P75 (more physically active) and
Comparisons between groups were performed using Student's t (comparison between groups30,31 comparisons involving health care costs as the dependent variable are expressed as mean and 95% CI, while the comparisons involved non-parametric tools.
Due to the asymmetric distribution of the dependent variable, the quantile regression multivariate model was adopted in this study.32 This regression analysis focuses on how predictors relate to the occurrence of extreme values (e.g. 10th, 50th, and 99th percentiles), and does not require any assumption about distribution (different from traditional mean regression models).32 Quantile regression was used to measure the relationship between HPA and health care costs considering the simultaneous insertion of different quartiles (quartiles 25, 50, and 75). In addition, the analysis considered the standard errors in bootstrap, which in turn imply the robustness of the model. Initially, potential confounders for the model were identified in the literature,33 including variables related to the outcome. The models were simultaneously adjusted by comorbidities (diabetes, dyslipidemia, arterial hypertension, and obesity), age, and sex. The relationships of all these variables with the outcome were tested and reached the previously established level of significance, set at 0.05. All analyses were performed using Stata statistical software (version 16.0).
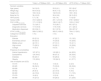
ResultsThe sample consisted of 278 adults (143 [51.4%] men and 135 [48.6%] women) with CVD. General characteristics of the total sample according to HPA levels are described in Table 1. Participants classified asp <0.05). With regard to medications, the values of participants classified as ≥P75 were significantly lower than those classified as
General characteristics of the patients according to habitual physical activity levels (n = 278).
| Total(n = 278)Mean (SD) | (n = 207)Mean (SD) | ≥P75 HPA(n = 71)Mean (SD) | |
|---|---|---|---|
| Numeric variables | |||
| Age (years) | 54.5 (8.3) | 55.2 (8.1) | 52.3 (8.6)* |
| Weight (kg) | 80.8 (18.2) | 80.9 (17.2) | 80.9 (21.0) |
| Height (cm) | 163.0 (9.4) | 162.9 (9.3) | 163.1 (9.6) |
| Body fat (%) | 36.4 (9.5) | 36.4 (9.6) | 36.19 (9.2) |
| HPA (score) | 5.7 (1.8) | 4.9 (1.4) | 7.9 (0.8)* |
| Salary (US$) | 313.5 (222.9) | 291.1 (213.9) | 378.7 (238.6)* |
| PHC (US$)/24 months | 171.0 (139.5) | 188.2 (142.7) | 120.9 (116.8)* |
| Outpatient services | 72.2 (64.7) | 76.3 (66.7) | 60.3 (57.2) |
| Diagnostic services | 17.9 (18.9) | 17.8 (16.9) | 21.1 (23.4) |
| Medication dispensed | 80.9 (94.1) | 95.1 (97.9) | 39.6 (67.3)* |
| STHC (US$)/24 months | 909.6 (1363.2) | 959.5 (1434.5) | 764.4 (1126.5) |
| Categorical variables | n (%) | n (%) | n (%) |
| Education | |||
| Illiterate | 60 (21.6) | 47 (22.7) | 13 (18.3) |
| Elementary school | 89 (32.0) | 70 (33.8) | 19 (26.8) |
| Middle school | 42 (15.1) | 27 (13.1) | 15 (21.1) |
| High school | 73 (26.3) | 54 (26.1) | 19 (26.8) |
| College | 14 (5.0) | 9 (4.3) | 5 (7.0) |
| Presence of comorbidities | |||
| Arterial hypertension | 187 (67.3) | 143 (69.1) | 44 (62.0) |
| Dyslipidemia | 124 (44.6) | 98 (47.3) | 26 (36.6) |
| Diabetes | 66 (23.7) | 55 (26.6) | 11 (15.5) |
| Obesity | 174 (62.6) | 133 (64.3) | 41 (57.7) |
| Use of hospital care (ICD) | |||
| I10-I15 | 15 (5.4) | 13 (6.3) | 2 (2.9) |
| I20-I25 | 96 (34.5) | 70 (33.8) | 26 (36.6) |
| I26-I28 | 4 (1.4) | 3 (1.5) | 1 (1.4) |
| I30-I52 | 26 (9.4) | 22 (10.6) | 4 (5.6) |
| I60-I69 | 44 (15.8) | 33 (16.0) | 11 (15.5) |
| I70-I79 | 18 (6.5) | 12 (5.8) | 6 (8.4) |
| I80-I89 | 75 (27.0) | 54 (26.0) | 21 (29.6) |
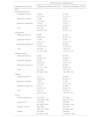
The prevalence of diabetes mellitus was 23.7% (n = 66), dyslipidemia 44.6% (n = 124), arterial hypertension 67.3% (n = 187), and obesity 62.6% (n = 174). Table 2 presents the healthcare costs according to the presence and absence of comorbidities. Costs with outpatient services (medical consultation services, attendance services, and utility bills), diagnostic services, medications dispensed, and total costs were higher among patients with diabetes, dyslipidemia, and arterial hypertension (p<0.05). Patients who were obese had higher costs with medications dispensed and total costs (p <0.05). Patients with arterial hypertension and diabetes mellitus had significantly higher STHC costs (Table 2).
Healthcare costs according to the presence of comorbidities among adults with cardiovascular diseases, 24-month follow-up (n = 278).
| PRESENCE OF COMORBITIES | ||
|---|---|---|
| Healthcare costs (US$) | YESMedian (IQR)Mean (95 %CI) | NOMedian (IQR)Mean (95 %CI) |
| PHC | ||
| Arterial hypertension | ||
| Outpatient services | 67 (60) | 36 (42)* |
| 83 (73, 93) | 51 (41, 61) | |
| Diagnostic services | 17 (26) | 6 (20) * |
| 21 (18, 24) | 12 (9, 15) | |
| Medication dispensed | 74 (118) | 14 (40) * |
| 105 (90, 120) | 32 (22, 41) | |
| Total | 170 (172) | 69 (96) * |
| 208 (187, 230) | 95 (78, 112) | |
| Dyslipidemia | ||
| Outpatient services | 69 (69) | 50 (54) * |
| 85 (72, 98) | 62 (53, 70) | |
| Diagnostic services | 17 (26) | 9 (24) * |
| 21 (17, 24) | 16 (13, 19) | |
| Medication dispensed | 92 (131) | 26 (65) * |
| 115 (96, 134) | 53 (42, 65) | |
| Total | 190 (191) | 102 (116) * |
| 221 (194, 249) | 131 (113, 149) | |
| Diabetes mellitus | ||
| Outpatient services | 84 (67) | 50 (56) * |
| 103 (84, 121) | 63 (55, 71) | |
| Diagnostic services | 22 (25) | 10 (24) * |
| 24 (20, 29) | 16 (13, 18) | |
| Medication dispensed | 111 (123) | 28 (86) * |
| 137 (111, 164) | 63 (52, 75) | |
| Total | 220 (238) | 106 (147) * |
| 264 (225, 303) | 142 (126, 158) | |
| Obesity | ||
| Outpatient services | 60 (71) | 54 (48) |
| 76 (65, 86) | 64 (53, 75) | |
| Diagnostic services | 13 (27) | 12 (29) |
| 18 (15, 21) | 18 (14, 22) | |
| Medication dispensed | 54 (116) | 25 (68) * |
| 94 (79, 110) | 56 (42, 70) | |
| Total | 158 (177) | 124 (122) * |
| 188 (165, 210) | 138 (116, 161) | |
| STHC | ||
| Arterial hypertension | 441 (1347) | 250 (342) * |
| 1076 (866, 1285) | 568 (343, 794) | |
| Dyslipidemia | 376 (1210) | 362 (861) |
| 887 (680, 1093) | 928 (688, 1169) | |
| Diabetes mellitus | 488 (1666) | 331 (701) * |
| 1205 (778, 1632) | 818 (653, 982) | |
| Obesity | 378 (998) | 358 (814) |
| 847 (678, 1015) | 1005 (661, 1349) | |
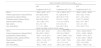
The quantile regression model indicated that HPA was responsible for reducing PHC costs in different quartiles even after controlling for the presence of comorbidities and confounding factors. Patients with higher HPA scores (classified ≥P75) presented savings ranging from US$ 22.5 to US$ 63.9 over a 24-month period (Table 3).
Quantile regression between costs and habitual physical activity, in the presence of comorbidities and confounding variables, among adults with cardiovascular diseases treated by the Brazilian National Health System.
| HEALTHCARE COSTS PHC (US$)/24 months | |||
|---|---|---|---|
| q25 | q50 | q75 | |
| Coefficient (95 % CI) | Coefficient (95 % CI) | Coefficient (95 % CI) | |
| HPA ( | −22.5 (−42.2, −2.7)* | −35.1 (−63.5, −6.7)* | −63.9 (−105.5, −22.5)* |
| Arterial hypertension (Absent [Ref.]) | 54.9 (28,9, 80.9)* | 61.5 (26.9, 96.1)* | 73.8 (−23.0, 170.6) |
| Dyslipidemia (Absent [Ref.]) | 12.0 (−13.2, 37.3) | 48.6 (19.2, 77.9)* | 44.7 (−12.6, 102.1) |
| Diabetes mellitus (Absent [Ref.]) | 54.8 (25.6, 84.0)* | 55.5 (21.1, 89.9)* | 116.0 (7.3, 224.8)* |
| Obesity (Absent [Ref.]) | −6.3 (−28.8, 16.0) | 11.8 (−21.9, 45.6) | 30.5 (−37.7, 98.7) |
| Age (years) | 0.6 (−0.7, 1.8) | 0.9 (−0.6, 2.4) | −0.0 (−3.1, 2.9) |
| Sex (male [Ref.]) | 11.7 (−6.1, 29.5) | 9.8 (−22.7, 42.2) | 13.9 (−50.3, 77.2) |
| HEALTHCARE COSTS STHC (US$)/24 months | |||
| HPA ( | −30.3 (−84.7, 24.0) | −73.2 (−196.0, 50.6) | −56.2 (−344.6, 232.3) |
| Arterial hypertension (Absent [Ref.]) | 96.3 (36.5, 156.2)* | 150.5 (2.4, 298.5)* | 613.3 (−168.2, 1394.8) |
| Dyslipidemia (Absent [Ref.]) | −65.5 (−151.8, 20.7) | −134.4 (−284.4, 15.6) | −306.8 (−707.3, 93.7) |
| Diabetes mellitus (Absent [Ref.]) | 153.1 (40.3, 265.9)* | 188.6 (40.4, 336.8)* | 512.9 (−464.7, 1490.5) |
| Obesity (Absent [Ref.]) | −60.3 (−114.8, −5.7)* | −45.7 (−165.1, 73.8) | −34.6 (−362.1, 292.9) |
| Age (years) | −0.7 (−5.4, 3.9) | −3.2 (−10.1, 3.6) | 12.9 (−12.9, 38.8) |
| Sex (male [Ref.]) | −88.3 (−149.5, −27.0)* | −86.3 (−201.4, 28.9) | −628.5 (−1262.7, 5.8) |
The analysis also showed that median health care costs with PHC services were US$ 61.5, US$ 48.6, US$ 55.5 higher for people with diabetes, dyslipidemia, or arterial hypertension, respectively, than for people without these variables. HPA and STHC costs were not related to each other (p> 0.05). For this analysis, it should be noted that median health care costs with STHC services were US$ 150.5 and US$ 188.6 higher for people with arterial hypertension and diabetes mellitus than for people without these comorbidities (p> 0.005) (Table 3).
DiscussionThe findings of this study showed that, in a population with CVD, the presence of comorbidities, such as diabetes, dyslipidemia, arterial hypertension, and obesity, increased healthcare costs. Additionally, even in the presence of these comorbidities, HPA was associated with savings on outpatient healthcare services.
Our results show that individuals diagnosed with diabetes, dyslipidemia, arterial hypertension, and obesity had higher PHC costs when compared to those without these comorbidities, and higher STHC costs were observed among individuals with arterial hypertension and diabetes. The association between comorbidities and healthcare costs9,11,12,34,35 can be justified by the close relationship they present with other diseases, such as CVD.7,36,37,38
Although no significant results were found between higher STHC, dyslipidemia, and obesity, we should be cautious when interpreting these findings, as these conditions are risk factors, which increase the chance for future development of outcomes that require interventions of greater complexity. High levels of cholesterol and triglycerides, characteristic of dyslipidemia, increase the amount of small and dense particles associated with the formation of atherosclerotic plaques.38,39 In addition, obesity is responsible for high levels of pro-inflammatory adipokines, such as leptin, which has a direct relationship with CVD38,40 and, consequently, impacts healthcare costs.3-6
At the same time, it is worth mentioning that the results may also have been influenced by limitations referring to unobservable population characteristics, such as sample selection bias, because a control group was not included in the sample. In addition, potential confounding factors, such as food consumption pattern, smoking, and alcohol consumption, were not considered in this research.
Regarding the economic burden of these comorbidities, studies have found that individuals with arterial hypertension spend 2 to 3 times more on outpatient services, medication, and hospital services.34 Additionally, patients with a diagnosis of diabetes mellitus spend twice as much monthly with total healthcare expenditures (US$ 1230 vs US$ 634; p <0.001)11 when compared to individuals without the condition.
Perspectives do not differ in developing countries; in Brazil, public and private costs related to the treatment of arterial hypertension corresponded, in 2005, to 0.08% of the Gross Domestic Product.41 In addition, average annual expenditure on primary healthcare for individuals with diabetes was ∼ 1.39 times higher when compared to individuals without the disease.12 It is also known that, worldwide, obesity is responsible for between 0.7% and 2.8% of a country's total healthcare costs.9
Finally, it was observed that, even in the presence of these comorbidities, HPA was effective in reducing healthcare costs, especially with PHC services. We found that patients with higher HPA scores presented savings ranging from US$ 22.5 to US$ 63.9, over a 24-month period. In the comparison between participants classified as ≥P75 andTable 1). Previous studies reported that physically active individuals were 44% less likely (OR = 0.56; 95% CI = 0.38, 0.81) to be in the highest quartile of medication-related expenditures42 and 74% less likely to have higher expenditures with medical appointments (p = 0.029).23 Although chronic diseases have more than one pathway underlying their pathophysiology, physical inactivity is considered a strong risk factor for several of them, including CVD.14,43 On the other hand, the practice of physical activities is an effective tool in the prevention and treatment of these conditions.14,43 However, our results showed that HPA was not effective in reducing STHC costs, suggesting that, at higher levels of care, the practice of physical activities is not a sufficient protective factor for CVD.
Thus, with regard to perspectives in public health, it was possible to verify that HPA could be an important tool to maximize health promotion and disease prevention, as suggested by PHC,44 but that once more complex levels of care are needed, a rise in costs is inevitable.44
As limitations of the study, we highlight the impossibility of transforming the scores provided by the HPA questionnaire into measures/units that could be used for exercise prescription, and we did not have information on healthcare services from other hospitals. Another limitation to be mentioned is the fact that the sample size calculation was made considering data from older people (older than 50 years) and a crude relationship between physical activity and health care costs, not considering the impact of covariates in this relationship. The absence of this adjustment could affect the minimum sample size, with a larger number of observations required, as adjusted correlations tend to decrease in magnitude. In addition, information about participants’ level of physical activity was not collected at the end of the follow-up period, which would make it possible to obtain information on the impact of changes on physical activity level on healthcare costs. However, we emphasize that this method of data collection was the best methodological design found by the researchers to obtain a longer follow-up time for healthcare costs.
The present findings are of great value, not only for public policy strategies, but also for health professionals involved in the prevention, control, and treatment of CVD. Knowledge of the effect of physical activity and diseases related to CVD complications on health care costs among adults with CVD enables the creation of strategies that encourage the reduction in these health risk factors, as well as the promotion of physical exercise in the population, and can possibly support physical exercise sessions in primary care facilities.
Furthermore, with the monetary information provided by the results of the present study, decision makers can estimate, in local contexts, the impact of physical activity, as well as the studied comorbidities, on healthcare costs in a population with CVD, at different levels of care.
ConclusionAmong adults with CVD, HPA significantly reduced costs for PHC services in Brazil, even in the presence of comorbidities, such as diabetes, dyslipidemia, arterial hypertension, and obesity.


