This study investigated the influence of early to moderate primary open angle glaucoma on gait, functional mobility and fall risk.
MethodsThirty-three participants in the early and moderate stages of primary open angle glaucoma and 34 asymptomatic controls participated in the study. Spatiotemporal gait data were obtained with the GAITRite system and included: velocity, cadence, step length, base of support, swing, stance and double support times. Functional measures included the Timed Up and Go test, the Five-Repetition Sit-To-Stand test and the Dynamic Gait Index. Fall risk was measured using the Physiological Profile Assessment.
ResultsThe variables contrast sensitivity, proprioception and the Timed Up and Go and Dynamic Gait Index tests were significantly different between groups. In addition, the glaucoma group presented significantly higher risk of falling compared to the control group. Individuals in the early and moderate stages of primary open glaucoma presented mobility and sensory deficits that increase the risk of falling.
ConclusionsThe results of this study suggest that adding the Timed Up and Go and Dynamic Gait Index tests to routine physical therapy assessment of individuals with early glaucoma could be useful. Rehabilitation programs should focus on maintaining and/or improving mobility and balance, and prevention of falls in this population.
Glaucoma is one of the leading causes of irreversible blindness.1 About 80 million people worldwide that will be affected by glaucoma in 2020, 74% will develop the primary open angle glaucoma (POAG), and 5.9 millions of those will progress into bilateral blindness.2 The POAG is associated with a slow clogging of the drainage canals, resulting in increased intraocular pressure that gradually damages the optic nerve.1,2
Individuals with POAG report “difficulty walking” especially when associated with “different lighting levels”, “steps” and “when crossing streets”.3 Turano et al.,4 showed that on average POAG individuals walk 10% slower when compared to healthy individuals about the same age. Similarly, Friedman et al.,5 found that elderlies with POAG walked 0.04m/s slower and had 1.65 times more accidents during walking when compared to healthy elderlies. Other studies demonstrated that POAG individuals performed significantly worse at the Timed Up and Go test (TUG),6 and have an increased risk of falls.7,8 These findings are associated with visual dysfunction consistent with advanced stages of glaucoma with visual field losses and lower sensitivity to contrast.3–6
POAG is often called “the silent blinder” because during the early to middle stages of the disease the symptoms are unnoticeable.9 However, there is evidence of early deterioration of visual quality and decreased sensitivity to contrast in the middle stages of the disease.10,11 It is unknown whether early visual dysfunctions due to POAG could have a negative influence on functional outcomes and falls in those individuals. The impact of age-related eye disease on mobility is an important area of research, given the aging of the population and the importance of mobility in the prevention of disability and mortality. Therefore, the aim of this study was to investigate the influence of early to moderate stages of POAG on gait parameters, functional tests and fall risk.
MethodsParticipantsThis is a cross-sectional study. The study was approved by the Ethical Committee of the Universidade Federal de Minas Gerais (UFMG), Belo Horizonte, MG, Brazil (CAAE – 0603.0.203.000-11), and all participants signed the informed consent form before participating in the study. Sample size was calculated using the results of the functional tests (TUG and Dynamic Gait Index-DGI) of the first five participants.12 Based on the effect size calculated by taking the square root of the sum of the squares between groups divided by the total sum of squares (effect size of 0.37) and considering and α=0.05 and a power of 0.80, the total sample size was 62 participants, 31 per group. The glaucoma individuals were recruited from the local University Hospital and the diagnostic was given by a glaucoma specialist. This examination included: open angle, anatomical damage of the optic disc and the nerve fiber and functional damage. Binocular visual acuity was measured using the Early Treatment Diabetic Retinopathy Study chart with the participant's habitual refractive correction. The recent Mean Defect (MD) data of the visual field of each eye with best-corrected visual acuity using the Octopus 1-2-3 (Interzeag, Switzerland) were collected from medical records. Participants were stratified by glaucoma severity into 1 out of 5 stages using the Octopus MD score of their better eye: 0.7 to +4.4dB (early), +4.5 to +9.4dB (moderate), +9.5 to +15.3dB (advanced), +15.4 to +23.1dB (severe) and ≥23.2dB (end-stage).13
The control group had members from the community willing to participate in the study. The exclusion criteria for both groups included past or present central or peripheral neurological disorders, musculoskeletal disease that could affect physical performance, significant visual, auditory and vestibular impairment and treatment with drugs that could influence the study results. Participants of the control group had no history of glaucoma or blindness in the family and a recent and normal eye exam provided by their ophthalmologist.
Anthropometric and clinical characteristics were obtained for both groups and included sex, age, height and body mass to calculate the body mass index (BMI), presence of chronic diseases or comorbidities diagnosed by a physician, number of drugs in use, number of falls in the past 12 months and fear of falling (yes/no).
Gait assessmentParticipants walked over a 5.74m rubber electronic pressure-sensitive mat (GAITRite®, CIR Systems, Inc., Haverton, USA) embedded with 18,432 sensors spaced 1.27cm apart that capture the geometry and contact of the foot with the ground in function of time and distance.14,15 They walked at their self-selected pace for six trials. Spatial-temporal gait parameters included: velocity (cm/s), cadence (steps/min), step length (cm), base of support (cm), swing time (s), stance time (s) and double support time (s) as defined by the GAITRite® manual. Participants started walking 2m before the mat and continued 2m past the mat for acceleration and deceleration. On average of 18 strides were analyzed per subject.
Functional testsThe Five-Repetition Sit-To-Stand test (5-STS) involved sitting down and standing up five times from a standing position as quickly as possible without using one's arms and the time taken, in seconds, was the score recorded.16 The TUG test was measured at the participant's usual pace and included rising from a chair, walking 3m, turning around a cone, and returning to the chair and sitting down.17 The tests were conducted on a corridor with proper lights and large windows and a familiarization trial was allowed for both tests. The average of three trials, in seconds, was used in data analysis. The Dynamic Gait Index-Brazil (DGI-Brazil) measured balance in eight tasks: gait on a level surface, change in gait speed, gait with horizontal head turns, gait with vertical head turns, gait and pivot turn, step over obstacle, step around obstacles and steps. The scores range from 0 to 24 points, with higher scores indicating greater independence and adaptability to gait.18
Fall riskFall risk was determined using the Physiological Profile Assessment (PPA) short-form (Medical Research Institute, Australia).19 The PPA measures balance based on visual contrast sensitivity, hand reaction time, proprioception, knee extension strength and sway. Contrast sensitivity was assessed using the Melbourne Edge Test that contains 20 circular patches with edges of reduced contrast.20 A card was presented to the participant and the lowest contrast patch correctly identified is recorded. Proprioception was assessed with the participant seated, with an acrylic panel marked with a protractor between the legs, and asked to align the hallux simultaneously on each side of the panel. The differences in degrees between the alignments were recorded. Strength of the quadriceps was measured with the participant seated and recorded with a digital dynamometer attached 10cm above the ankle joint. Reaction time consisted of the time the participant reacted to a visual stimulus of a red light on a computer mouse; the participant had to click the mouse as the red light comes out. Postural sway was conducted with the participant standing over a foam rubber mat with a belt connected to a fixed sway meter that has a pen attached to its end. For 30s the pen registered the sway over a millimeter paper placed on top of the adjusted table. The PPA software evaluates the participant performance on each test and calculates a standardized score. Scores from −2 to −1 indicates a very low risk of falls, −1 to 0 low risk, 0 to 1 mild risk, 1 to 2 moderate risk, 2 to 3 marked risk. The PPA has 75% predictive accuracy for falls in older adults.19
Data analysisAnthropometric, clinical and ophthalmologic data were presented descriptively. The mean difference between groups with 95% confidence interval (95% CI) was calculated for continuous variables and the Chi-square test on categorical variables.
Normality of the continuous variables (outcome measures) was analyzed using the Shapiro–Wilk test. For the non-parametric data (PPA variables, swing time and gait velocity) the Mann–Whitney U test was used followed by Bonferroni correction. One-way analysis of variance (ANOVA) was used to determine which variables were different between the control and POAG groups when the data has normal distribution. All tests were analyzed using SPSS 22.0 (SPSS Inc., Chicago, IL) with a 0.05 significance level.
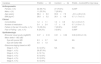
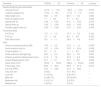
ResultsParticipated 67 individuals (age range 51–86 years) divided into a POAG (n=33) and control (n=34) groups. Sample characteristics are presented in Table 1. Twenty-nine individuals from the POAG group were in the initial stages of the disease and the remainder were in the moderate stages. Table 2 describes and compares the gait variables, functional tests and the PPA profile of the groups. Fall risk was analyzed independently and the POAG group presented significantly higher physiological fall risk score (0.57, SD=0.82) compared to the control group (0.07, SD=0.82) (between-group difference=0.50; 95% CI=0.10–0.90).
Anthropometric, clinical and ophthalmologic characteristics of POAG and control groups at baseline (n=67).
| Variables | POAGn=33 | Controln=34 | POAG – Control(95% CI)p-Value |
|---|---|---|---|
| Anthropometric | |||
| Female, n (%) | 22 (66.7%) | 27 (79.4%) | 0.239a |
| Male, n (%) | 11 (33.3%) | 7 (20.6%) | |
| Age (years) | 68.4±8.0 | 69.3±7.9 | −0.9 (−4.8 to 3.0) |
| BMI (kg/m2) | 26.8±5.2 | 26.1±4.8 | 0.7 (−1.7 to 3.1) |
| Clinical | |||
| Comorbidities | 1.2±1.1 | 1.0±0.9 | 0.2 (−0.3 to 0.7) |
| Number of medication | 2.4±2.4 | 1.7±1.6 | 0.7 (−0.3 to 1.7) |
| Fallers in the last 12 months, n (%) | 13 (39.4%) | 7 (20.6%) | 0.093a |
| Fear of Falling – yes, n (%) | 8 (24.2%) | 3 (8.8%) | 0.089a |
| Ophthalmologic | |||
| Binocular visual acuity (logMAR) | 0.07±0.18 | 0.01±0.02 | 0.06 (0.00 to 0.12) |
| Mean defect – MD (dB) | |||
| Eye with poorer MD | 6.3±3.7 | NA | NA |
| Eye with better MD | 4.8±1.8 | ||
| Glaucoma staging based on MD | |||
| Stage 0, n (%) | 0.0 (0.0%) | NA | NA |
| Stage 1, n (%) | 29 (87.9%) | ||
| Stage 2, n (%) | 4 (12.1%) | ||
| Stage 3, n (%) | 0.0 (0.0%) | ||
| Stage 4, n (%) | 0.0 (0.0%) | ||
| Stage 5, n (%) | 0.0 (0.0%) | ||
Note: Values are mean±standard deviation or number (percentage) or mean difference between groups (95% confidence interval) or p-value.
Abbreviations: POAG, primary open-angle glaucoma; BMI, body mass index; kg/m2, kilograms per square meter; 95% CI, 95% confidence interval; logMAR, logarithm of the minimum angle of resolution; MD, mean defect; dB, decibels; NA non-applicable.
Description and comparisons of the spatial and temporal gait parameters, functional tests and PPA measures of the POAG and control groups (n=67).
| Variables | POAGn=33 | Controln=34 | p-Value |
|---|---|---|---|
| Spatial-temporal gait parameters | |||
| Velocity (cm/s) | 127.6±17.8 | 126.3±13.8 | 0.975 |
| Cadence (steps/min) | 116.0±9.5 | 117.5±7.9 | 0.461 |
| Step length (cm) | 66.0±6.9 | 64.5±5.4 | 0.264 |
| Base of support (cm) | 7.7±2.4 | 7.1±2.0 | 0.285 |
| Swing time (s) | 0.42±0.03 | 0.41±0.03 | 0.070 |
| Stance time (s) | 0.62±0.06 | 0.62±0.05 | 0.826 |
| Double support time (s) | 0.20±0.04 | 0.21±0.04 | 0.244 |
| Functional tests | |||
| 5-STS (s) | 10.7±1.3 | 10.1±1.9 | 0.140 |
| TUG (s) | 7.0±0.6 | 6.4±0.8 | 0.002* |
| DGI (total score) | 23.1±1.1 | 23.8±0.8 | 0.001** |
| PPA | |||
| Visual contrast sensitivity (dB) | 19.5±2.5 | 21.0±1.2 | 0.004** |
| Hand reaction time (s) | 0.27±0.04 | 0.25±0.04 | 0.098 |
| Proprioception (°) | 2.0±1.4 | 1.1±0.6 | 0.003** |
| Knee extension strength (kg) | 22.0±5.4 | 22.2±3.0 | 0.697 |
| Anterior-posterior displacement (mm) | 21.9±7.2 | 21.9±5.3 | 0.606 |
| Lateral displacement (mm) | 21.7±8.1 | 21.4±6.5 | 0.835 |
| Sway area (mm2) | 504.8± 334.2 | 488.0±252.8 | 0.905 |
| Total sway (mm) | 98.6±35.9 | 96.8±27.2 | 0.915 |
| Fall risk (PPA) | 0.57±0.82 | 0.07±0.82 | – |
| Very low risk | 0 (0%) | 4 (11.8%) | – |
| Low risk | 5 (15.2%) | 8 (23.5%) | – |
| Mild risk | 22 (66.7%) | 20 (58.8%) | – |
| Moderate risk | 4 (12.1%) | 2 (5.9%) | – |
| Marked risk | 2 (6.0%) | 0 (0%) | – |
Note: Values are mean±standard deviation. One-way ANOVA.
p<0.005.
Abbreviations: POAG, primary open-angle glaucoma; TUG, timed up and go test; DGI, dynamic gait index-Brazil; 5-STS, five-repetition sit-to-stand test; cm, centimeter; cm/s, centimeter/second; s, seconds; dB, decibels;°, degrees; mm, millimeters; kg, kilogram; mm2, square millimeters; PPA, Physiological Profile Assessment.
Mann–Whitney U test results showed that the DGI from the POAG group (MdnPOAG=24) differed significantly from the control group (Mdncontrols=24) U=347.50, z=−3.373, p=0.001; as well as the variables visual contrast sensitivity (MdnPOAG=20 and Mdncontrols=21) U=337.500, z=−2.897, p=0.004 and proprioception (MdnPOAG=1.6 and Mdncontrols=1.2) U=331.000, z=−2.944, p=0.003. In addition, the ANOVA test showed a significant effect of group on the TUG test F(1,65)=10.015, p=0.002. POAG individuals spend more time to perform the TUG test (7.0±0.6s) compared to the control group (6.4±0.8s).
DiscussionThe study investigated the influence of POAG on gait, functional tests and physiological fall risk of individuals in the early to moderate stages of the disease. Despite the “silent” feature of the POAG, the analysis point to a significantly worse performance of the glaucoma group. The TUG, DGI, visual contrast sensitivity and proprioception differed significantly between groups. In addition, 78.8% of the glaucoma individuals had a mild to moderate physiological risk of falling. Therefore, early to moderate stages of glaucoma are associated to deficits on mobility and balance that might contribute to the likelihood of falling in this group of community-dwelling adults studied.
Balance is the ability to control equilibrium and is challenged continually by the gravity, movements and interactions with the ambient.21 The maintenance of balance is controlled by information from several sensory systems; however, deficit in visual information increases postural sway in individuals with glaucoma.22–24 Black et al.22 using a sway meter observed increased postural sway, both in firm and foam surfaces, with glaucomatous visual field loss in a group of community-dwelling elderlies (≥65 years). Similarly, Kotecha et al.,23 and Lord et al.,24 reported that poor visual field compromises visual feedback for balance control in glaucoma and normal vision patients, but only when proprioception or the somatosensory system is compromised. Therefore, our findings support the importance of the visual system in the control of balance when proprioception is compromised.
In our study, proprioception was challenged with a foam rubber mat as the participant stood on it with their eyes opened. When standing on a firm surface, balance is maintained by a combination of the vestibular, visual and sensory systems, but when the sensory system is challenged, the eyes play an important role assisting stability.21 In a similar situation, even with their eyes opened, glaucoma patients had greater instability because of visual field sensitivity dysfunction.23 The POAG group presented a significant decrease in contrast sensitivity (19.5dB×21.0dB) and a proprioception angle classified as fair (2.0–4.0 fair) that was significantly higher than the control group. Therefore, it is acceptable to affirm that early to moderate stages of glaucoma individuals presented balance problems that might be related to a deficit in both the sensory and visual systems.
The most common complaints reported by individuals at the initial and moderate stages of POAG are the “need for light”, “blurred vision” and “overshadowed”, which indicates dysfunction in contrast sensitivity.10 Therefore, glaucoma individuals face every day challenges while walking and during other activities with difficulties identifying targets, obstacles and different layouts in the environment.25 In a study with 2520 elderlies with visual impairment and age-related eye diseases, West et al.26 found that contrast sensitivity loss contributes independently to decrements in mobility tasks, such as going up and down the stairs and performing the TUG test. Reduced mobility, as observed in the present study, increases the likelihood of falls, functional dependency and mortality.27,28 Turano et al.4 found a decrease in 10% in gait velocity on a group with glaucoma compared to the normal-vision group, and that complex paths tended to slower even more both groups. Black et al.,7 showed that elderlies with POAG spent more time performing the TUG test – which involves standing and turning. Our findings revealed reduced mobility and poor balance of the POAG group when performing the TUG test and the DGI test, but failed to demonstrate differences in the gait parameters. It is possible that complex paths are more challenging for individuals with visual deficits, especially early to moderate stages of glaucoma. Supporting that statement, Klein et al.29 suggested that the visual demands are superficial when simple tasks, such as walking in a straight line, are elicited and that physical factors are more important. Similarly, Geruschat and Turano30 showed that walking in a corridor free of obstacles was the task of smaller visual and mental demands in individuals with POAG compared to the conditions of walking in areas with pedestrians, or moving up and down stairs. Although cautious gait in individuals with visual deficits has been reported, most studies investigated glaucoma on its later stages or other types of eyes diseases.27,31,32 Wood et al.31 demonstrated that reduced contrast sensitivity in individuals with macular degeneration related to age was also associated with slower walking velocity, reduced stride length and increased step width. Also, Patel et al.27 in a study of 1504 elderlies (≥72 years) found that decreased mobility measured by preferred gait velocity was associated with visual field loss. It is possible that the incipient loss of visual field and contrast sensitivity at the earlier and moderate stages of glaucoma is insufficient to generate adaptive gait patterns, even with reduced mobility as observed in the POAG group. Nevertheless, these results show how important it is for individuals with glaucoma and clinicians to be aware of these deficits in order to minimize or even prevent further balance and mobility deficits that would culminate in falls.
A large body of evidence suggests that older adults with vision problems, such as glaucoma, are more likely to experience falls than those with normal vision.7,8,33–35 A retrospective study conducted on 489 elderlies with glaucoma (≥65 years) found that individuals with a loss of 40% or more of their visual field were more prone to falls in the previous year.34 Black et al.,7 showed that a loss of visual field, particularly in the inferior region, in individuals with POAG (≥60 years) was highly associated with the incidence of falls (57%). Inferior visual field contributes to the major proportion of visual information used in the movements of the lower limbs, foot placement and obstacle detection.32 Haymes et al.,33 found that the number of falls in the previous year was significantly higher in glaucoma individuals (35%) compared to a control group (13%). The evidence linking contrast sensitivity and visual field loss with fear of falling is inconclusive. Turano et al.4 failed to find an association between glaucoma and a fear of falling. On the contrary, Yuki et al.,35 and Ramulu et al.36 reported that loss of visual field from glaucoma was associated with a fear of falling. In our study, risk of falling assessed with the PPA showed that POAG individuals are at higher risk for falling. Although there were more POAG individuals with a fear of falling and a history of falls these data failed to show significance. It is important to highlight that fear of falling is a multifactorial phenomenon, making it difficult to establish or identify all the factors that could unleash it. Yet, the results from the present study confirm that individuals at the early and moderate stages of glaucoma are at higher risk of falling based on the PPA results.
This study challenged individual's mobility and balance with the TUG and the DGI tests. Both tests are extensively used in clinical settings to test mobility skills to predict falls.37,38 In fact, this was the first study to use the DGI test in glaucoma individuals. The DGI encompasses eight items that vary the walking task by changing speed, adding head turning, turning and stopping, walking over and around obstacles, and ascending/descending stairs. Therefore, it is much more complex than the TUG test, supporting that either a simple mobility test (TUG) or a more complex test (DGI) were able to differentiate early to moderate glaucoma from healthier participants. Although our POAG group had four individuals in the moderate stage of Glaucoma, the literature supports that early stages of glaucoma – patients with good visual field acuity – might show decrease contrast sensitivity. It is unclear if these differences are clinically relevant, but these findings could at least raise a flag of an early detection of POAG individuals prone to falls and with early signs of mobility impairment. Therefore, we recommend these tests as part of routine tests for individuals with glaucoma. We also suggest balance-training exercises for individuals with glaucoma. Glaucoma leads to balance impairment due to loss of visual input.39 An example of a training protocol would include a combination of static postural control, weight shifting and perturbation exercises with the participant standing on unstable foam with eyes open or closed. These exercises challenge both the sensory and visual systems. The addition of such functional tests could transform the traditional physical therapy assessment more useful, practical and even prognostic.
The limitations of the study included lack of statistical power to detect differences in the gait parameters. Most patients with glaucoma seek for treatment when they are in the advanced stage of the disease; therefore, recruiting patients in the early and moderate stage was difficult. In addition, our screening process was tight to guarantee participants only in the early and moderate stages of POAG, impeding us to find more participants in the time frame of the study. This might have compromised some of the true differences we were expected to observe. However, we considered this to be a primary investigation project and our goal is to expand the sample for a future and more robust study.
ConclusionThe results of this study place emphasis on an early diagnosis of glaucoma and the development of a fall-prevention program focused on maintaining and/or improving balance and mobility performance in this population. Clinical trials are needed to determine the best exercise program to improve or slow down the mobility and balance deficits of POAG individuals in the early and moderate stages.
Authors’ contributionsHAG, SC and RNK were involved in conception and design of this study.
HAG collected the data and wrote the first draft of the manuscript.
RNK and BSM provided inputs for statistical analysis, data interpretation; RNK was responsible for the final draft of the manuscript.
SC and RAG performed the participants’ ophthalmologic assessments.
RFS and SRCF reviewed critically the manuscript for important intellectual content.
All authors approved the final version of the manuscript.
None of the authors has a conflict of interest to declare.