Oscillation between successive sinus beats or RR intervals, termed heart rate variability, is an important marker of autonomic function of the heart. However, its analysis may be influenced by the database recorded based on the occurrence of interference.
ObjectiveTo evaluate if the techniques of identification and editing of artifacts, as well as the selection methods of RR intervals, can interfere with heart rate variability analysis.
MethodsThe RR intervals of 56 subjects (30 aortic stenosis patients, 14 physically active individuals, 12 amateur athletes) were recorded for 10min using a heart rate monitor. Values with differences greater than 20%, higher than three standard deviations or outside of the normal curve (95% confidence interval) were considered artifacts. These points were corrected through data replacement, adjacent, linear and polynomial interpolation, or excluded. Then, the 256 highest stability points and the last 5min of recordings were chosen. The software programs, Kubios HRV and GraphPAD, were used to calculate and to analyze the indices of heart rate variability, respectively.
ResultsStrong agreement was observed among the identification algorithms; there was no difference between the correction techniques (p=0.95); and the selection methods exhibited different sections (p<0.01) with a direct influence on approximated entropy (p<0.05).
ConclusionWith short-term recordings, selection methods may interfere with the non-linear heart rate variability analysis. The confidence interval, the replacement by the average of previous data and the selection of 256 of the highest stability points of the signal seem to be the most adequate procedures to treat the data with prior to analysis.
The oscillation between successive sinus beats, measured on the electrocardiogram by the interval between two consecutive R waves or RR intervals (RRi), is referred to as heart rate variability (HRV).1 HRV analysis allows for the investigation of the action of the autonomous nervous system (ANS) on the chronotropic activity of the heart, and different mathematical (time-domain), spectral (frequency-domain) and geometrical (Poincaré plot) indices might predict the sympathovagal balance.1,2 The traditional method of assessment makes use of an electrocardiogram (ECG) to record electrical pulses generated in the myocardium.3 Occasionally, there may be interference owing to the influence of the electromagnetic field (an artifact), R-wave overlap (ectopic beats) or even the loss of signal.3–5 However, it is possible to visually inspect the data to, if necessary, correct it prior to analysis.1,3–5
Heart rate monitors that use a chest strap are an alternative to monitor heart rates accurately.6 These devices use a digital telemetry system and, through their microprocessors, allow the identification and quantification of the time-lapse between each cardiac cycle.4,7 Besides, some models have the option of exporting the data for later analysis.6,8 Although these devices are validated against the gold standard (ECG) to monitor heart rate in real time,6,8 they do not allow the visualization of the electrocardiographic signal.
According to the ESC/NASPE Task Force,1 independent of the equipment used, it is necessary to identify and substitute the ECG's doubtful points in order to minimize the interference that may compromise analysis of the HRV.9,10 Thus, certain methods have been developed with this purpose in mind. Malik et al.11 suggested that two subsequent RRi with differences above 20% between them should be considered ectopic beats or artifacts. Loimaala et al.4 stated that this threshold may be expanded up to 30% or 500ms without interfering with the analysis. Additionally, while Rumenig et al.12 employed three standard deviations (3SD) of all RRi registered as the threshold, Christou and Dinov13 proposed the estimate of confidence interval (CI) around the mean to detect doubtful points.
On the other hand, several techniques have been proposed to correct the types of interference, such as: (1) exclusion of the outlier value14; (2) replacement by the average of previous values15; (3) replacement by the average of adjacent intervals16; (4) replacement by linear interpolation17; and (5) substitution by polynomial interpolation.18 Lastly, data analysis could suffer from the influence of RRi selection methods. With short-term recordings, two methods have been frequently used – the selection of the 256 highest stability points19 and using the five last minutes of the recording.1
The methodological diversity seen in the processing of the data prior to analysis becomes evident as well as the lack of a clear indication of which techniques are most adequate for identifying and correcting these interferences or selecting the section to be evaluated. From this observation, we formulated the hypothesis that the interpretation of HRV analysis could be compromised depending on the technique of identification and correction applied, and the method of selection of the section to be analyzed. Therefore, we attempted to compare three methods of identification and five techniques of correction of artifacts in short-term recordings captured by a heart rate monitor in addition to comparing two methods of RRi selection.
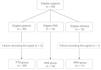
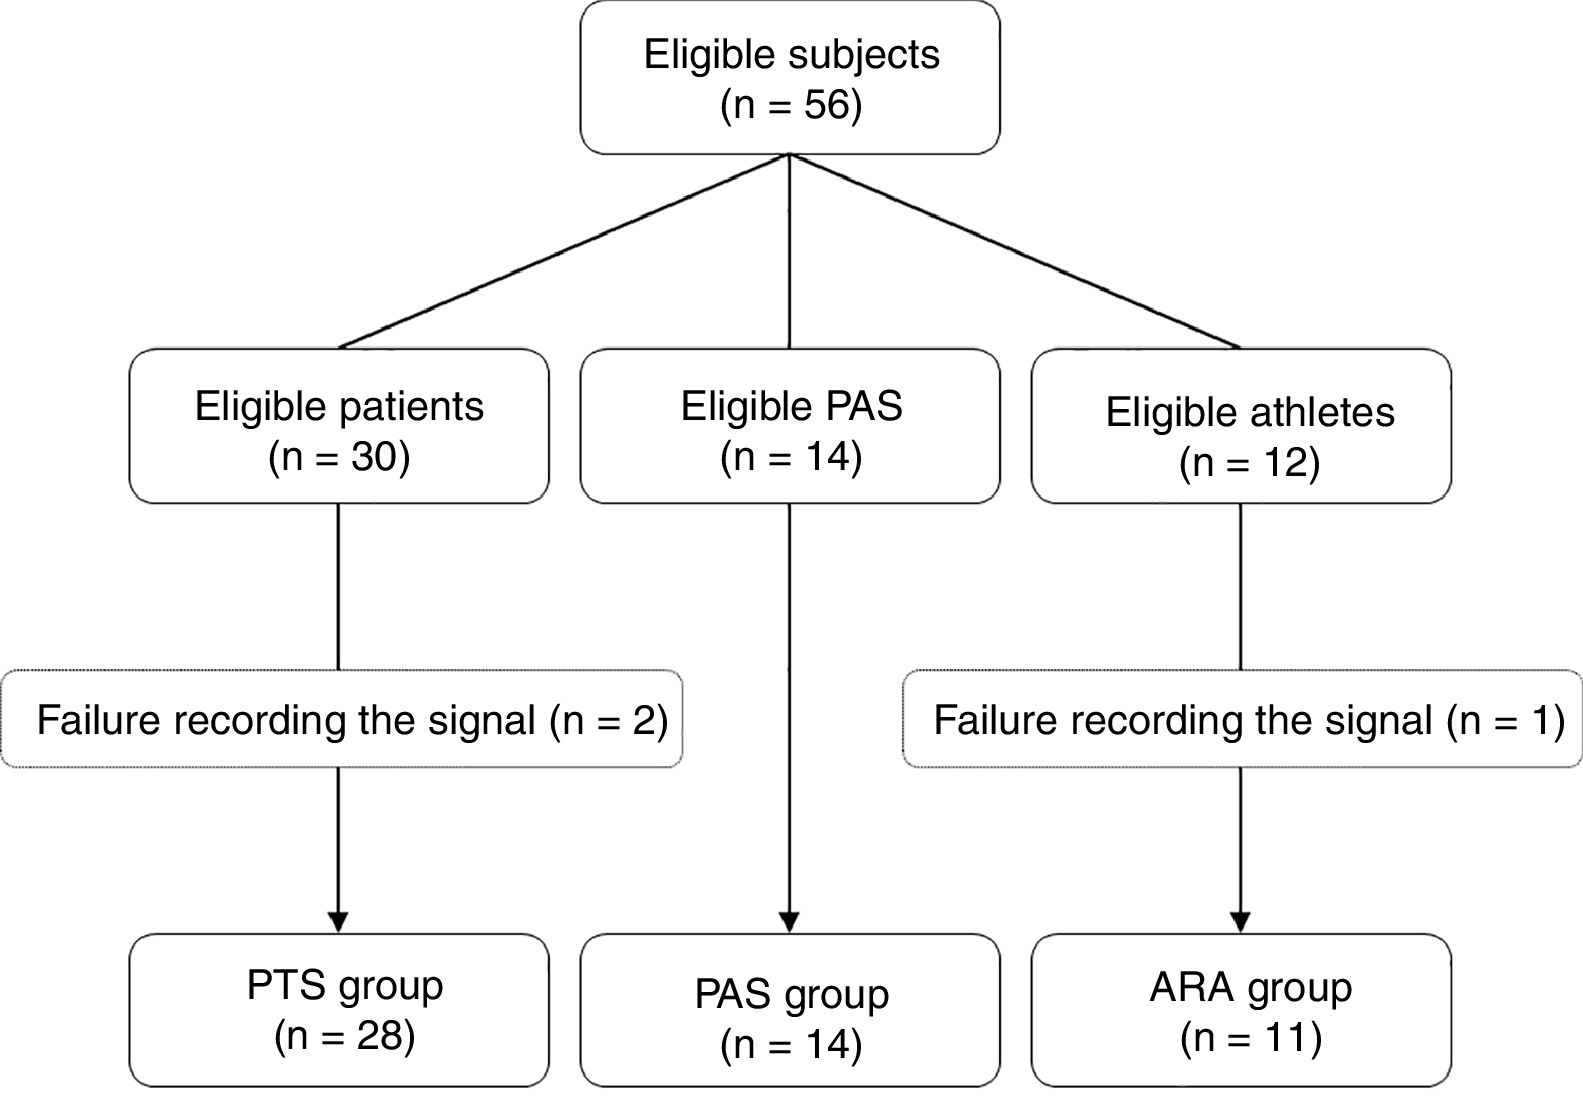
MethodsIn this study, RRi were recorded from 56 individuals, 30 of whom were patients (PTS group) with aortic stenosis before a valve repair procedure, 14 were physically active paired subjects (PAS group) and 12 were young amateur running athletes (ARA group). The subjects of the PTS group were chosen consecutively prior to a valve correction procedure. The PAS group was paired by sex and age to the PTS group, and the athletes were selected by convenience. The assessments were performed between March 2015 and June 2016. The study was previously approved by the Hospital Ethics Committee from the Santa Casa de Misericórdia from Porto Alegre (999.904/15), Porto Alegre, RS, Brazil, respecting the Helsinki declaration and Resolution 466/12 of the Brazilian National Health Council. All subjects were aware of the proceedings and signed an informed consent form. Fig. 1 details the process of allocation of participants.
Body mass and height of all the subjects were measured and utilized to calculate their Body Mass Index. The physical activity level of the PAS and groups was estimated using the Minnesota Leisure Time Activity Questionnaire. Additionally, the ARA group underwent to a cardiopulmonary exercise test.
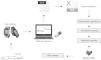
Heart rate was recorded beat to beat in a heart rate monitor (RS800cx®, Polar Electro Oy, Kempele, Finland). The assessment protocol followed the recommendations of the ESC/NASPE Task Force.1 In summary, the subjects remained in the supine position for 5min to stabilize the hemodynamic variables. The RRi were recorded for the 10 subsequent minutes (Fig. 2). During this period, subjects were requested not to talk, make gestures, or sleep.20,21 The respiratory rate was visually monitored during the entire procedure.
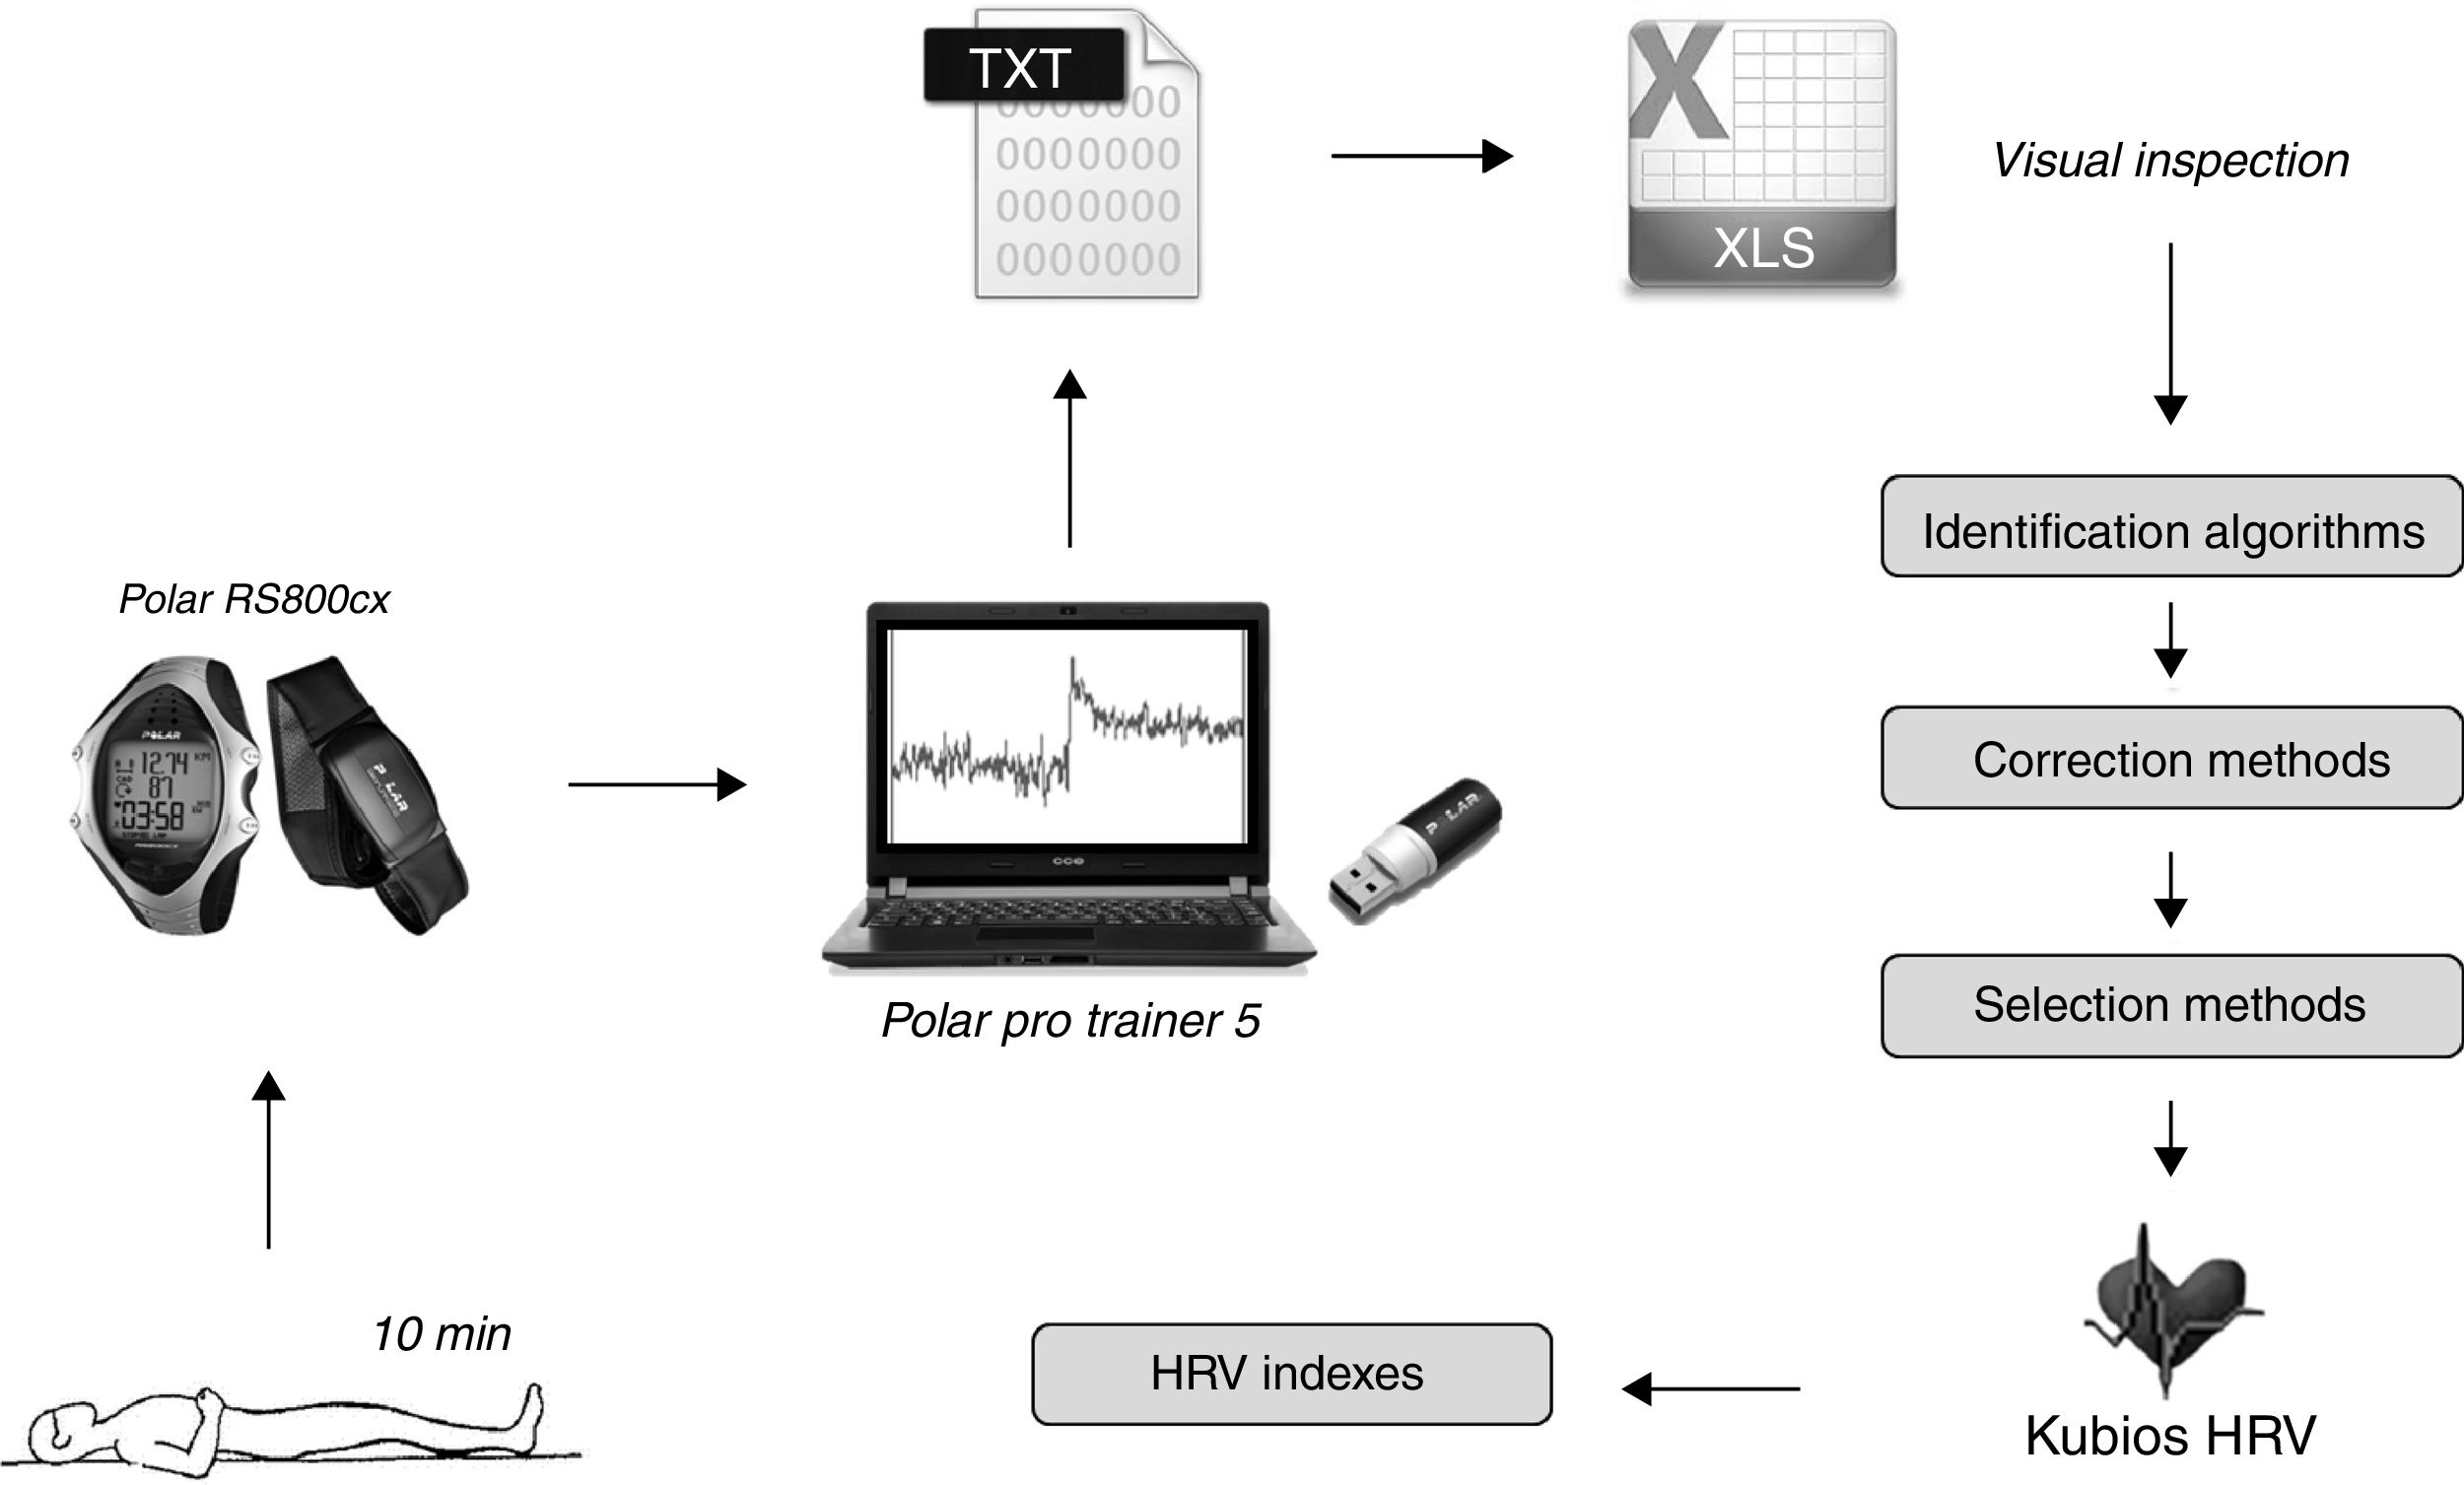
Data collection and processing sequence. For the 3 heart rate analysis groups, the data were recorded in the heart rate monitor while the subject remained at rest. The signal was transferred to the software via infrared, where it was converted to text for later analysis. The TXT file was opened in a spreadsheet where the data underwent several mathematical treatments, in the follow order: identification of artifacts and ectopic beats, and correction of the dubious points (i.e. by exclusion, substitution or interpolation techniques). After these steps, the sample base was selected for HRV analysis, either by selecting the 256 points of greatest stability or the last 5min of the recorded signal (10min). Finally, these selections were exported to the Kubios HRV to calculate the different HRV indices.
The data obtained were transferred to the Polar ProTrainer 5 software program via an infrared interface (Polar Electro Oy, Kempele, Finland) and converted to text for visual inspection within a spreadsheet (Excel 2010, Microsoft Office, Redmond, USA). The records were submitted to different techniques of identification and correction of doubtful points as well as two methods of RRi selection. The final files were exported to Kubios HRV 2.2 (University of Eastern Finland, Kuopio, Finland) program for calculation of the several HRV indices with the time-domain, frequency-domain and by non-linear methods.18
Artifacts and ectopic beats were identified using three algorithms: (1) considering as normal an adjacent RRi that presented up to three standard deviations (3SD) around the mean of all RRi12; (2) refusing data with differences above 20% of the adjacent value11; and (3) considering artifacts of the RRi that were outside the estimated 95% confidence interval around the mean of all RRi.13 This last technique was not developed a priori for HRV analysis, but its solid theoretical basis supported its application in this area.
Five techniques were applied for the correction of doubtful points14–18: (1) deletion (DEL): exclusion of the visualized artifact; (2) substitution by the average of previous data (PRV): consisting of the replacement of the artifact by the mean of the three previous and valid RRi; (3) interpolation of adjacent data (ADJ): replacing the value by the mean of the first valid previous value and the first valid value after the point; (4) linear interpolation (LIN): using the first-degree linear function to estimate the value within a discontinuous interval; and (5) polynomial interpolation (POL): replacement of the artifact for a value estimated in a smoothed curve. The linear (4) and polynomial (5) functions were calculated using the extension SRS1 Cubic Spline for Excel version 2.5.1.0 (SRS1 Software, Boston, USA).
Two sample bases, both described and accepted in the literature and broadly used within the scientific community, were employed for the HRV analyses.1,19 The first base was composed by the 256 highest stability points of the record.19 However, this method may have depended on the evaluator's subjectivity. On the other hand, although the selection of the final 5min was not evaluator-dependent, the section selected may not be the one with the highest stability. Nevertheless, this procedure is the one currently recommended by the ESC/NASPE Task Force.1
The HRV was analyzed through linear and non-linear methods.1 With regard to the time-domain, the selected indices were the mean (mean RR) and the standard deviation (SDNN) of all RRi, the square root of the mean of the squares of the differences between successive RRi (RMSSD) and the percentage of RRi above 50 milliseconds (pNN50). Besides these, two geometric indices were estimated: the width of the RRi histogram base (TINN) and the integral of the RRi histogram divided by the height of the histogram (triangular index). With respect to the spectral analysis, the low-frequency (LF) and high-frequency (HF) bands as well as the ratio between the two bands (LF/HF) were investigated. For the non-linear methods evaluated, the quantitative indices of the Poincaré plot, represented by the transverse axis (SD1) and longitudinal axis (SD2) of the ellipsis, the short-term (DFA-α1) and long-term (DFA-α2) fluctuations of the detrended fluctuation analysis and the regularity among time series, known as approximated entropy (ApEn) and sample entropy (SampEn). While some indices reflected the vagal influence (RMSSD, pNN50, AF, SD1 and ApEn), others were characterized by the sympathetic predominance (BF), respiratory influence (DFA α1) or the overall variability of the ANS activation (SDNN and SD2).1,18,22
Statistical analysisThe data were analyzed with the program GraphPAD Prism 5.01 (GraphPad Software Inc, San Diego, CA, USA). The Shapiro–Wilk test was applied to verify data distribution. Agreement among the identification methods was assessed employing the kappa index23 and prevalence-adjusted bias-adjusted kappa (PABAK),24 with differences being investigated by using the Kruskal–Wallis test. The doubtful beats and correction techniques were then analyzed via the Kruskal–Wallis test with Dunn's post hoc while the RRi selection methods and HRV indices were evaluated through the Mann–Whitney test. Data were expressed as mean±standard deviation (parametric) or median and interquartile range (non-parametric), and analyzed within their respective groups. There was no comparison among the 3 groups (PTS, PAS and ARA). The Chi-square test was applied to assess the proportions among the groups. The significance level was set at p<0.05 for all analyses.
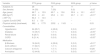
ResultsThe PTS group was predominantly composed of elderly patients with high surgical risk, left ventricular ejection fraction preserved (LVEF≥50%), arterial hypertension (86%), diabetes mellitus (36%), chronic renal failure (29%) and/or chronic obstructive pulmonary disease (22%). Moreover, 65% of the patients used medication to control their heart rate. The PAS group, paired by sex and age, presented lower prevalence of arterial hypertension (p<0.01), chronic renal failure (p<0.05) and use of beta blockers (p<0.05), besides lower body mass index (p<0.01) and a higher level of physical activity (p=0.03). The ARA group was younger than the other groups (p<0.01), did not take medications and had excellent aerobic capacity (VO2MAX=54.0±7.7mlkgmin−1). The nutritional state of this group was similar to that of the PAS group and inferior to that of the PTS group (Table 1). Two subjects from the PTS group and one from the ARA group were excluded due to failure to record the signal.
Characteristics of the 3 heart rate analysis groups: aortic stenosis patients (PTS), physically active subjects (PAS) and amateur running athletes (ARA).
| Variable | PTS group | PAS group | ARA group | p-Value |
|---|---|---|---|---|
| Subjects (n) | 28 | 14 | 11 | – |
| Sex (female) | 14 (50) | 7 (50) | 0 (0) | <0.05* |
| Age (years) | 68.7±12.9 | 65.7±13.6 | 35.9±10.1 | <0.01* |
| BMI (kg/m2) | 29.9±4.0 | 25.8±3.3 | 23.7±2.1 | <0.01† |
| LVEF (%) | 64.4±12.4 | – | – | – |
| Logistic EuroSCORE | 6.5±5.9 | – | – | – |
| Physical activity (kcal/week) | 882±1770 | 2332±1163 | – | 0.03 |
| Comorbidities | ||||
| Hypertension | 24 (85.7) | 4 (28.6) | 0 (0.0) | <0.01† |
| Diabetes | 10 (35.7) | 1 (7.1) | 0 (0.0) | <0.05† |
| Renal failure | 8 (28.7) | 0 (0.0) | 0 (0.0) | <0.05† |
| COPD | 6 (21.4) | 0 (0.0) | 0 (0.0) | <0.05† |
| Medication | ||||
| β-Blockers | 18 (64.3) | 4 (28.6) | 0 (0.0) | <0.01† |
| ACE-I/ARA-II | 17 (60.7) | 1 (7.1) | 0 (0.0) | <0.01† |
| Calcium antagonist | 3 (10.7) | 1 (7.1) | 0 (0.0) | 0.520 |
| Anxiolytics | 12 (44.9) | 1 (7.1) | 0 (0.0) | <0.01† |
BMI, body mass index; LVEF, left ventricular ejection fraction; COPD, chronic obstructive pulmonary disease; ACE-I, angiotensin converting enzyme inhibitor; ARA-II, angiotensin II receptor antagonists. Values expressed as mean±SD or n (%). Sex, comorbidities and medications were assessed through the Chi-square test and the remaining ones through the Kruskal–Wallis test.
For the artifacts and possible ectopic beats, all algorithms demonstrated a strong agreement (PABAK>0.8) independently of the group and compared methods, as follow: PTS group presented 0.91 (3SD vs 95% IC), 0.96 (3SD vs 20%) and 0.89 (20% vs 95% IC), while in the PAS group, it was 0.91 (3SD vs 95% IC), 0.95 (3SD vs 20%) and 0.88 (20% vs 95% IC). Finally, the ARA group's PABAK was 0.91 (3SD vs 95% IC), 0.98 (3SD vs 20%) and 0.90 (20% vs 95% IC). Nevertheless, the 95% CI identified a higher number of doubtful points in relation to the 20% and 3SD in the PTS group (32±55 vs 0±168 vs 3±37 points; p<0.01), in the PAS group (26±14 vs 9±15 vs 24±61 points; p<0.01) and in the ARA group (28±11 vs 7±14 vs 1±1 points; p<0.01). In addition, the reproducibility with respect to the 95% CI13 was lower in the PTS (3SD k=0.19; 20% k=0.14), PAS (3SD, k=0.20; 20%, k=0.17) and ARA (3SD, k=0.05; 20%, k=0.12) groups.
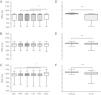
Next, the five techniques used to correct the artifacts were compared. The RRi set previously analyzed by the 95% CI method was employed as it identified the largest number of doubtful points of the three groups. Fig. 3A synthesizes the analysis in the PTS group. There was no difference (p=0.95) among the methods DEL (902±142ms), PRV (902±150ms), ADJ (901±149ms), LIN (901±149ms) and POL (901±151ms). However, the DEL method was similar to the uncorrected database (UNC 903±132ms). Fig. 3B synthesizes the analysis of the PAS group. There was no difference between the correction techniques and uncorrected databases (DEL 956±69, PRV 957±65, ADJ 956±66, LIN 956±65, POL 955±64 and UNC 956±65ms; p=0.99). Fig. 3C portrays the findings of the ARA group. There was similarity among all techniques analyzed (DEL 981±59, PRV 981±59, ADJ 981±59, LIN 981±59, POL 981±59ms; p=0.99) except when these were compared to the uncorrected database (UNC 1001±71ms; p<0.01).
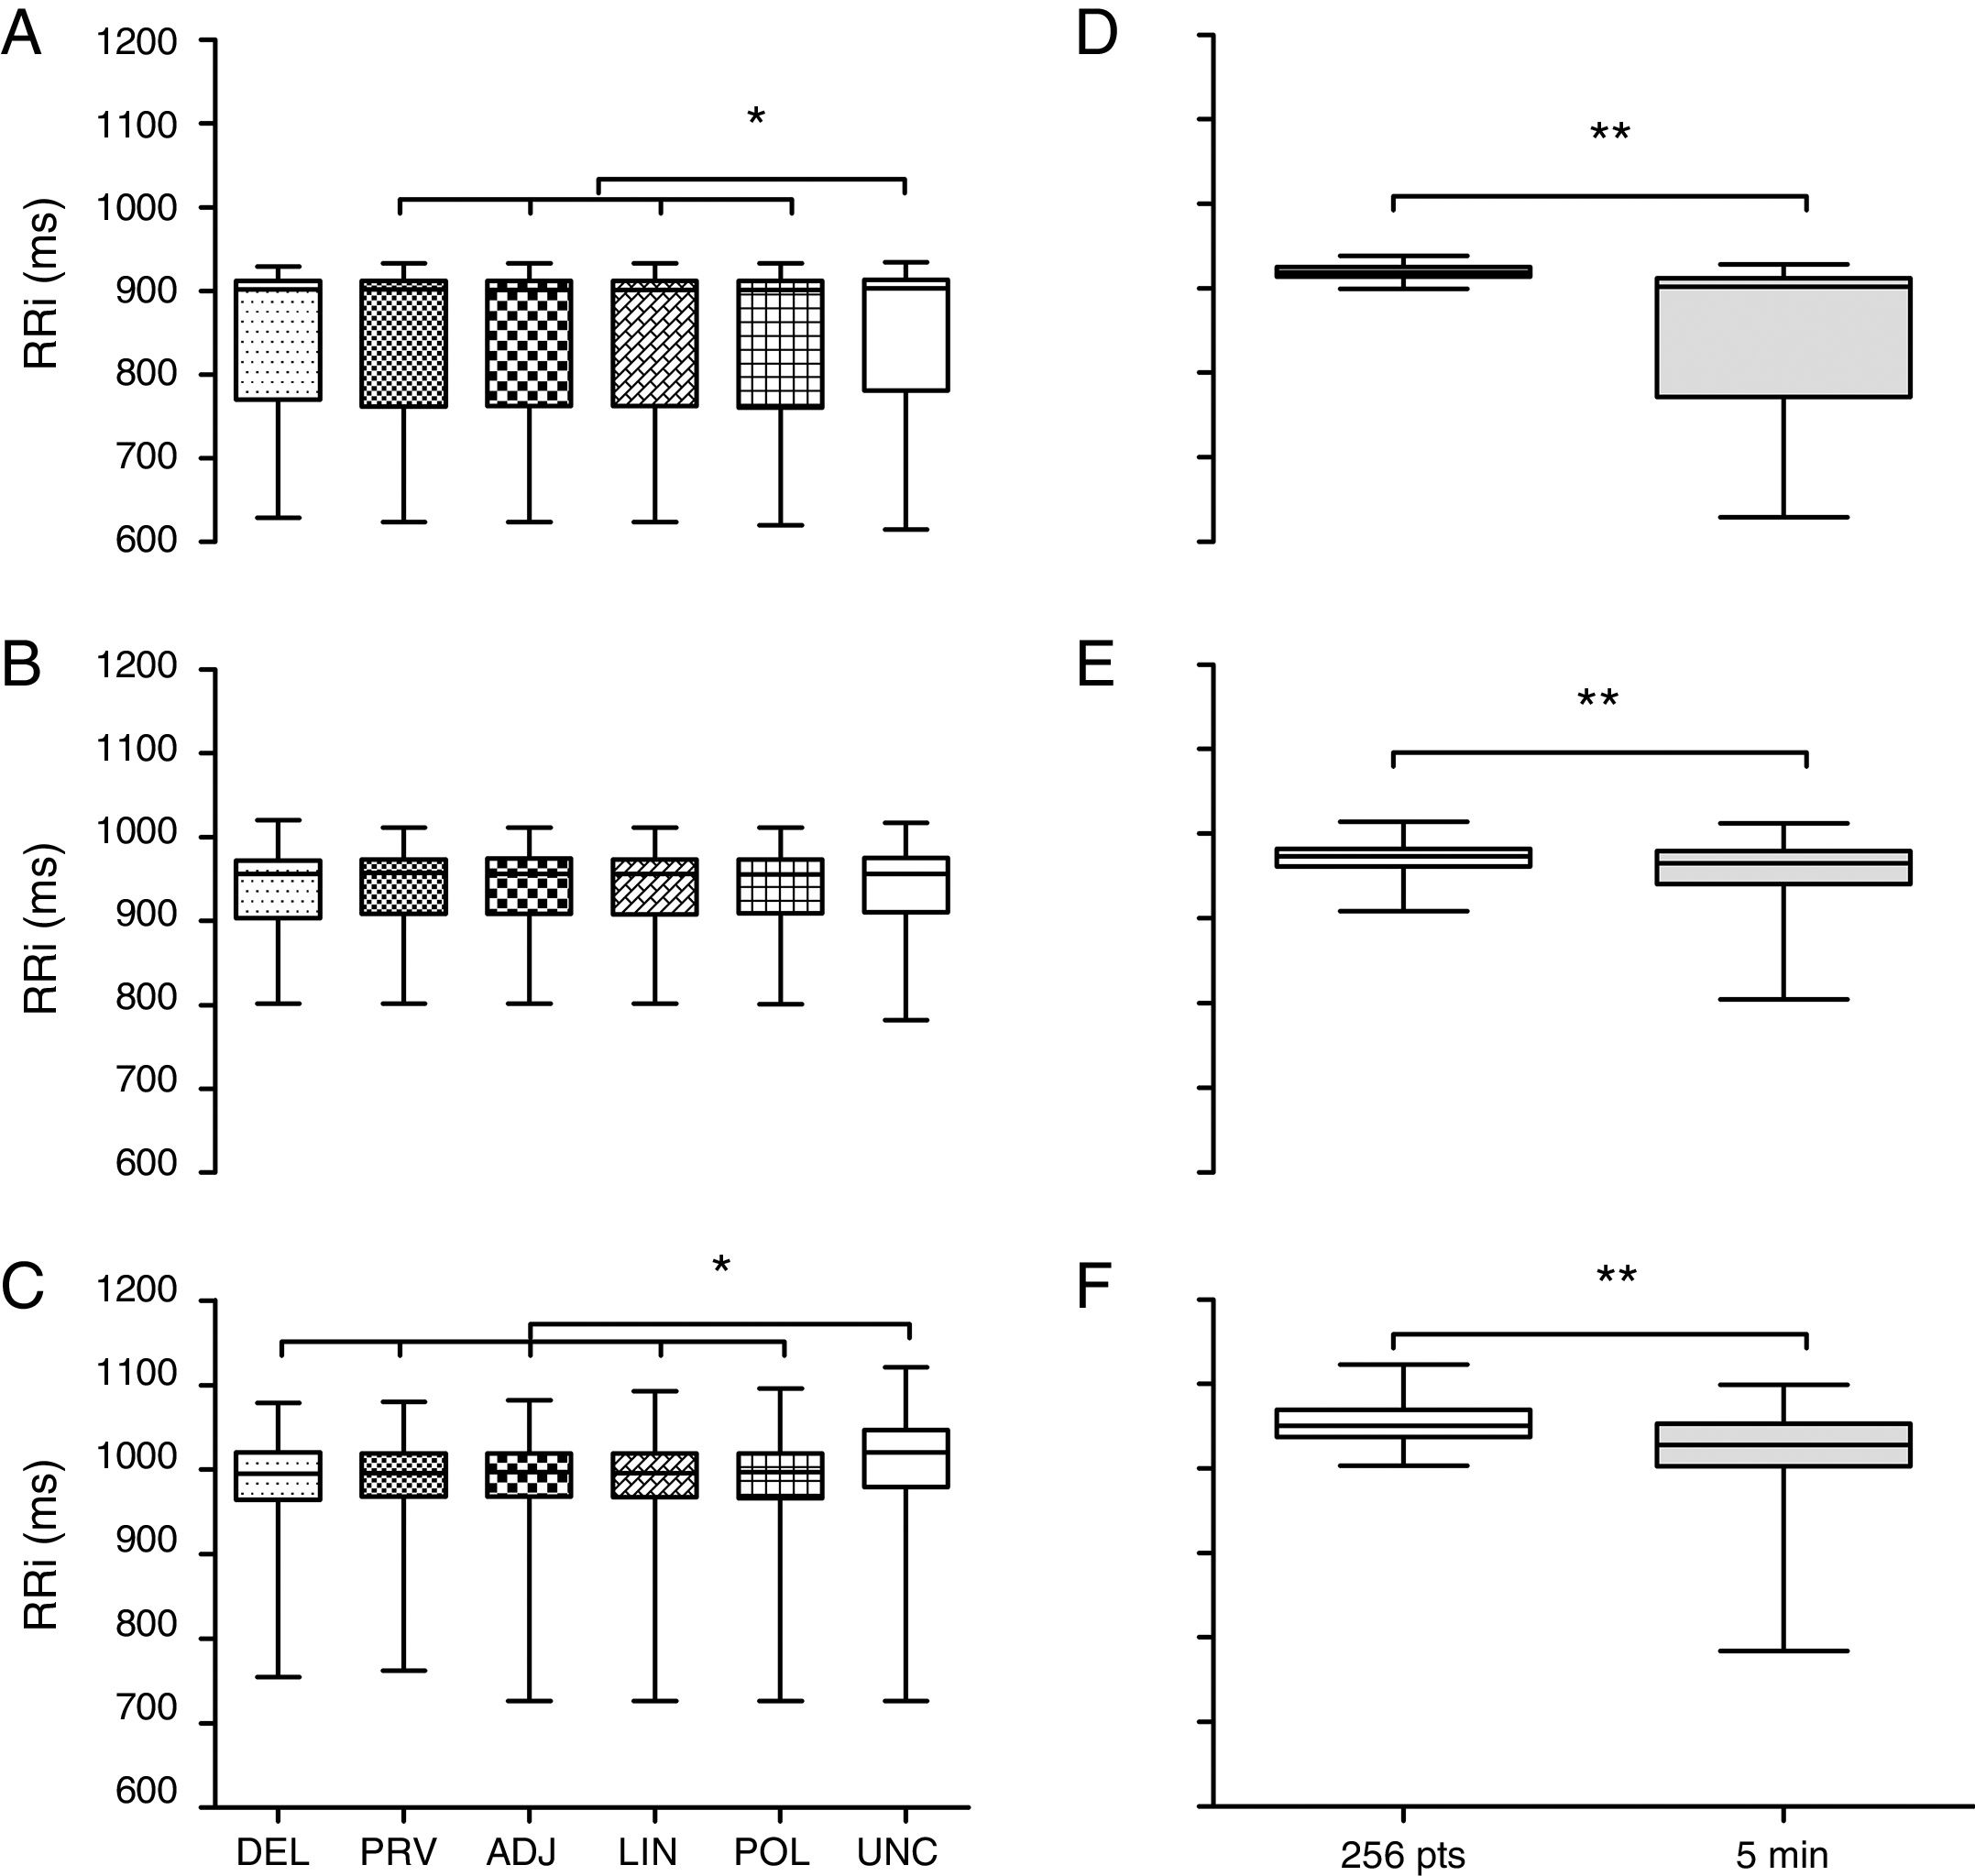
Comparison of techniques to correct artifacts and to RR interval selection for the 3 heart rate analysis groups. (A and D) PTS group. (B and E) PAS group. (C and F), ARA group. Data expressed as median, interquartile interval, maximum and minimum. RRi, RR intervals; DEL, exclusion; PRV, substitution by the average of previous data; ADJ, interpolation of adjacent data; LIN, linear interpolation; POL, polynomial interpolation; UNC, uncorrected data; 256 pts, 256 points; 5min, five minutes. *Kruskal–Wallis test followed by Dunn's post hoc (p<0.05). **Mann–Whitney test (p<0.001).
RRi selection methods were compared with data previously evaluated through 95% CI and substitution by the average of previous data as reference. The choice for this correction technique was based on the methodological simplicity and absence of divergence between the techniques investigated (DEL, PRV, ADJ, LIN and POL). Fig. 3D illustrates the analysis within the PTS group. The selection of the 256 points20 was significantly different from the last 5min of the recording, having a reduced data set (256 vs 465, p<0.01) with lower dispersion (919±11 vs 902±141ms; p<0.01). Fig. 3E depicts the analysis in the PAS group. There was a divergence in the quantity (256 vs 371, p<0.01) and quality (973±21 vs 965±39ms; p<0.001) of the RRi. Fig. 3F synthesizes the analysis in the ARA group. The selection of the 256 points exhibited lower dispersion (1100±21 vs 1000±76ms; p<0.01) and a reduced number of RRi (256 vs 354 points; p<0.01).
Tables 2 and 3 present the HRV indices obtained from the selection of the 256 highest stability points and the last 5min of the recording. The selection methods did not interfere with the mathematical and geometrical indices analyzed in the time-domain for the PTS, PAS and ARA groups. A similar behavior was observed in the spectral analysis (Table 2). None of the groups were influenced by the database utilized. Further, the selection methods did not interfere with the estimation by non-linear methods except for ApEn (Table 3). The PTS and ARA groups featured different results between the two selection methods (256 points vs 5min; p<0.05).
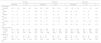
Linear methods of heart rate variability analyzed from the sample databases obtained from the selection of 256 highest stability points and the final 5min of the recording for the 3 heart rate analysis groups i.e. the cardiac patient group (PTS group), the physically active group (PAS group), and the athletic group (ARA group).
| PTS group | PAS group | ARA group | |||||||
|---|---|---|---|---|---|---|---|---|---|
| 256 points | 5min | p | 256 points | 5min | p | 256 points | 5min | p | |
| Time-domain | |||||||||
| Mean RR (ms) | 860±240 | 860±240 | 0.94 | 950±260 | 950±250 | 0.95 | 1100±140 | 1100±130 | 0.69 |
| SDNN (ms) | 16±14 | 17±13 | 0.39 | 34±52 | 44±50 | 0.63 | 50±32 | 57±21 | 0.51 |
| RMSSD (ms) | 15±24 | 15±23 | 0.97 | 27±56 | 32±52 | 0.77 | 40±46 | 41±45 | 0.95 |
| pNN50 (%) | 0.0±7.5 | 0.1±8.5 | 0.66 | 4.3±25.0 | 9.4±25.0 | 0.79 | 24±41 | 25±40 | 0.84 |
| Triangular index | 4.8±3.7 | 5.1±3.6 | 0.47 | 6.4±7.0 | 9.0±9.4 | 0.63 | 12.0±9.0 | 16.0±6.0 | 0.21 |
| TINN (ms) | 40±64 | 58±66 | 0.27 | 78±140 | 88±117 | 0.55 | 80±150 | 95±190 | 0.79 |
| Frequency-domain | |||||||||
| LF (ms2) | 38±126 | 50±141 | 0.29 | 200±949 | 320±1140 | 0.76 | 530±1530 | 810±1680 | 0.84 |
| HF (ms2) | 57±170 | 66±131 | 0.99 | 250±1171 | 270±1036 | 0.80 | 490±1440 | 440±1390 | 0.65 |
| Total power (ms2) | 200±481 | 230±460 | 0.29 | 1200±3580 | 1400±3570 | 0.66 | 2900±3900 | 3100±4700 | 0.65 |
| LF (u.n.) | 45±41 | 58±34 | 0.20 | 42±38 | 46±44 | 0.99 | 45±34 | 55±35 | 0.79 |
| HF (u.n.) | 55±41 | 41±34 | 0.19 | 58±37 | 54±44 | 0.98 | 55±34 | 45±35 | 0.79 |
| LF/HF ratio | 0.83±1.41 | 1.40±1.83 | 0.21 | 0.72±1.85 | 0.86±2.33 | 0.98 | 0.81±1.67 | 1.20±2.02 | 0.82 |
PTS, patients with aortic stenosis; PAS, physically active subjects; ARA, amateur running athletes; SDNN, the standard deviation of all RRi; RMSSD, square root of the sum of squared RRi differences; pNN50, percent of RRi above 50ms; TINN, triangular interpolation of the RRi histogram; LF, low-frequency; HF, high-frequency. Values expressed as median±interquartile range.
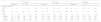
Non-linear indices of heart rate variability analyzed from the databases of the 3 heart rate analysis groups obtained from the selection of 256 highest stability points and the final 5min of the record.
| PTS group | PAS group | ARA group | |||||||
|---|---|---|---|---|---|---|---|---|---|
| 256 points | 5min | p | 256 points | 5min | p | 256 points | 5min | p | |
| Non-linear methods | |||||||||
| SD1 (ms) | 11±17 | 11±17 | 0.97 | 19±40 | 23±37 | 0.78 | 29±33 | 29±32 | 0.95 |
| SD2 (ms) | 20±12 | 22±13 | 0.29 | 43±63 | 50±58 | 0.63 | 66±39 | 77±26 | 0.60 |
| ApEn | 1.00±0.13 | 1.11±0.11 | <0.01* | 1.00±0.13 | 1.08±0.12 | 0.16 | 1.00±0.01 | 1.10±0.11 | <0.05* |
| SampEn | 1.72±0.32 | 1.58±0.56 | 0.20 | 1.62±0.56 | 1.38±0.65 | 0.31 | 1.80±0.30 | 1.60±0.70 | 0.21 |
| DFA α1 | 0.85±0.52 | 0.93±0.46 | 0.43 | 0.84±0.60 | 0.83±0.56 | 0.94 | 0.88±0.37 | 1.10±0.43 | 0.36 |
| DFA α2 | 0.85±0.31 | 0.99±0.29 | 0.17 | 1.13±0.40 | 1.05±0.45 | 0.61 | 0.94±0.64 | 1.10±0.46 | 0.72 |
PTS, patients with aortic stenosis; PAS, physically active subjects; ARA, amateur running athletes; SD1, standard deviation of the points on the transverse axis of the ellipsis; SD2, standard deviation of the points on the longitudinal axis of the ellipsis; ApEn, approximate entropy; SampEn, sample entropy; DFA α1, short-term of detrended fluctuation analysis; DFA α2, long-term of detrended fluctuation analysis. Values expressed as median±interquartile range.
The main finding of this study was the divergence observed in the RRi selection from the 256 highest stability points and the last 5min of the recording independent of age, functional status, cardiovascular impairment, or associated clinical condition. In addition, this was the first study to investigate, comprehensively, the diversity of methodologies available to perform the previous treatment of data recorded through a heart rate monitor, basing its use on the clinical practice and research environment.
Basically, the selection of the 256 points generated a more homogeneous database, that is, with lower dispersion. This finding was apparent in part owing to the specificity of the selection that limits the number of RRi independent of the recording period. The selection of the last 5min generated longer sections (PTS=82%, PAS=45% and ARA=38%), pointing to an inverse relationship between the level of physical activity and number of RRi recorded. Consequently, individuals with cardiovascular impairment would be more susceptible to the influences of the selection method. We did not find any other studies comparing the two selection methods.
Considering what was mentioned previously, it would be reasonable to expect changes in HRV index calculated from different sections. However, the data indicated similarity in the time-domain (i.e. the SDNN, RMSSD, pNN50, triangular index, and TINN), frequency-domain (i.e. the LF, HF and LF/HF ratio) and non-linear methods (i.e. the SD1, SD2, SampEn, DFA-α1 and DFA-α2), suggesting that, independent of the method selected, there is no impairment in the HRV analysis using short-term recordings. The exception was ApEn, which exhibited superiority in the section analyzed from the final 5min in the PTS and ARA groups. Considering that this index was sensitive to changes in time series, a longer section would be more likely to present greater randomness.22 In addition, both groups exhibited vagal predominance as characteristic of SNA modulation, either because of better physical conditioning or the use of drugs.
Indeed, the loss of complexity in the signal has been related to an individual's worse clinical condition.25,26 Therefore, it was believed the PTS group would have lower values for this parameter. However, the analysis performed from the final 5min demonstrated the opposite, suggesting the 256-point selection as the most adequate method. Another relevant point was the possibility that the spectral analysis might clinically point to antagonistic situations, even if there was no statistical difference among the values. For example, the normalized LF and HF bands suggested a greater vagal participation in the analysis conducted from the 256 points while the selection of the final 5min pointed to greater sympathetic influence.
In relation to the identification of the doubtful points, although the different techniques had identified a different number of artifacts and ectopic beats, there was strong agreement between them. However, the 95% CI demonstrated better applicability as it discerned a larger quantity of doubtful points. Huikuri et al.3 and Loimaala et al.4 stated that the 20% threshold may be extended to 30% without impairment to the RRi analysis. On the other hand, Malik et al.11 noted that the algorithms might not be effective in detecting all the artifacts and, for this reason, visual inspection was recommended.
Although it was not possible to visualize the electrocardiographic trace in digital telemetry devices, they did allow for the inspection of the RRi sequence. In the present study, the heart rate was not monitored with the ECG, making it impossible to compare these algorithms with the gold standard and to determine the best cut-off points. In addition, a different number of artifacts were detected by each technique, which might influence the HRV analysis. Still, the 95% CI filter seemed to present a better basis to be applied to files transferred from these devices as it located artifacts in a more homogeneous way.
The exclusion of doubtful points using the correction technique was expected to diverge from the substitution and interpolation techniques because of the smaller sample size. Contrary to this expectation, there was no difference among the methods investigated, independent of the sample being composed of individuals with cardiovascular impairment (PTS, p=0.95), physically active subjects (PAS, p=0.99) or amateur running athletes (ARA, p=0.99). We believe this finding was a consequence of the small number of doubtful beats observed (maximum of 6%) in the short-term records (10min). Lippman et al.27 supported this hypothesis when they remarked that error elimination might be as effective as other techniques in short-length records.
On the other hand, except for the exclusion technique (DEL), the substitution (ADJ and PRV) and interpolation techniques (LIN and POL) differed from the uncorrected data series in the PTS and ARA groups. Salo et al.28 showed that, among the correction methods studied in patients with myocardial infarction (DEL, PRV and LIN), none had better performance than the others with short-term records. The authors declared that there was no single method to correct these doubtful points, leaving it to researchers to execute their own routine depending on the population and the HRV index that was set to be analyzed.28
It was also observed that the polynomial interpolation did not fully correct the artifacts found in the PTS group. In certain cases, the values remained outside normality even after their substitution. In addition, the method of interpolating the beats with adjacent data exhibited a certain complexity when errors were in sequential blocks. Thus, linear interpolation or substitution by the average of previous data techniques seemed more adequate to replace these doubtful points.
Conclusions and practical applicationsIn our sample, the analyses performed on short-term records showed strong agreement among the algorithms proposed to identify artifacts, although they identified a very different number of artifacts and ectopic beats, similarities among the techniques applied to correct these points and differences among the RRi selection methods that could interfere with the non-linear HRV analysis independent of the level of physical fitness, cardiovascular impairment or associated clinical condition. Considering the higher detection power, methodological simplicity and greater data homogeneity, we believe that the confidence interval, the substitution by the average of previous data, and the selection of the 256 highest stability points of the signal are the most adequate procedures for treating the data prior to analysis.
Thus, for clinical practice and research activities, we suggest that: (1) identification and correction techniques be chosen such that they promote the adequate filtering of the signal; (2) visual inspection be performed whenever possible; (3) techniques used to identify and correct doubtful points be adequately mentioned and described in studies; (4) the selection of 256 points be preferred even if the selection criterion may have limited influence on the HRV analysis; and, (5) the procedures described may be applied to different populations without methodological losses.
Conflicts of interestThe authors declared no potential conflicts of interest with respect to the research, authorship, and/or publication of this article.
We acknowledge the support from the Coordenação de Aperfeiçoamento de Pessoal de Nível Superior (CAPES, Brazil) by financial support of research project.