Alterations in respiratory system kinematics in stroke lead to restrictive pattern associated with decreased lung volumes. Chest physical therapy, such as positive expiratory pressure, may be useful in the treatment of these patients;
however, the optimum intensity to promote volume and motion changes of the chest wall remains unclear.
ObjectiveTo assess the effect of different intensities of positive expiratory pressure on chest wall kinematics in subjects with stroke compared to healthy controls.
Methods16 subjects with chronic stroke and 16 healthy controls matched for age, gender, and body mass index were recruited. Chest wall volumes were assessed using optoelectronic plethysmography during quiet breathing, 5 minutes,
and recovery. Three different intensities of positive expiratory pressure (10, 15, and 20cmH2O) were administered in a random order with a 30 minutes rest interval between intensities.
ResultsDuring positive expiratory pressure, tidal chest wall expansion increased in both groups compared to quiet breathing; however, this increase was not significant in the subjects with stroke (0.41 vs. 1.32L, 0.56 vs. 1.54L, 0.52 vs. 1.8L, at 10, 15, 20cmH2O positive expiratory pressure, for stroke and control groups; p<0.001). End-expiratory chest wall volume decreased in controls, mainly due to the abdomen, and increased in the stroke group, mainly due the pulmonary rib cage.
ConclusionPositive expiratory pressure administration facilitates acute lung expansion of the chest wall and its compartments in restricted subjects with stroke. Positive expiratory pressure intensities above 10cmH2O should be used with caution as the increase in end-expiratory volume led to hyperinflation in subjects with stroke.
Stroke-related changes in motor control that result in hemiplegia and hemiparesis are the most common clinical signs affecting the movements of the trunk and limbs. As several trunk muscles are considered accessory to inspiration and expiration, breathing mechanics are also altered.1,2 In addition, diaphragm function is frequently impaired in these subjects and respiratory function impairment may be a consequence of respiratory muscle weakness.3,4 Studies assessing respiratory muscle strength have being widely performed, and although diaphragmatic elevation is attributed to chronic respiratory dysfunction, authors recognize the influence of inspiratory muscle weakness on its impairment.3
Changes in the breathing mechanisms of these subjects may lead to respiratory complications contributing to the primary cause of mortality unrelated to the central nervous system.5,6 In subjects with stroke, changes in the kinematics of the respiratory system result in lower ventilatory efficiency7 and progressive inefficiency of respiratory muscle mechanics leading to a restrictive pattern associated with decreased lung volumes.2,8. Ventilatory efficiency is defined when there is uniform matching of lung ventilation to perfusion regulated by arterial partial pressure of carbon dioxide (PCO2).9
The use of positive expiratory pressure (PEP) has been recommended for the rehabilitation of these subjects. PEP allows the maintenance of patent airways and lung volumes at adequate intensities to facilitate expectoration and improve gas exchange and ventilation/perfusion ratio.10 PEP also has the advantage of being an easy-to-use and portable therapeutic modality that can be frequently used by subjects as a preventive measure.11
Previous studies showed have shown interesting results regarding the impact of PEP in different conditions.12,13 A study conducted by Frazão et al.13 showed a significant increase in chest wall volumes, measured through Optoelectronic Pletismography (OEP), in subjects with Parkinson's disease during the use of three different intensities of PEP compared to quiet breathing.13 However, subjects with hemiparesis frequently show restrictive ventilatory impairment associated with respiratory muscle weakness.14 Therefore, different intensities of PEP could change the chest wall motion and breathing pattern in these subjects.
Thus, the aim of the study was to observe the effects of different PEP intensities on chest wall volumes and its different compartments and their operating volumes in subjects with stroke compared to healthy controls. To achieve this, we used the OEP, a device that provides precise, valid, and reliable measures of chest wall volumes as previously demonstrated.15 The study hypothesis was that the administration of PEP at different intensities would improve lung expansion in subjects with stroke in a different pattern when compared to healthy controls.
MethodsSubjectsSubjects with hemiparetic stroke and healthy individuals matched for age, sex, and body mass index (BMI) were included in the study. Stroke patients were recruited at the Neurology Service of Hospital Universitário Onofre Lopes/Universidade Federal do Rio Grande do Norte (HUOL/UFRN). The inclusion criteria were as follows: diagnosis of stroke confirmed by recent computerized tomography with a minimum duration of six months since the neurological event and without facial muscle involvement, BMI ranging from 18.5kg/m2 to 30kg/m2, controlled blood pressure (cut-off value of 140/90mmHg), no cardiac comorbidities, no history of brain aneurism or retinal detachment, and no intellectual comprehension issues or difficulties to perform the study assessments. Exclusion criteria were presence of hypertensive crisis, facemask discomfort, such as a feeling of suffocation, dizziness, or vertigo, and refusal to take part in the study. Healthy non-smokers with normal spirometry (cut-off point 80% predicted) and without history of pulmonary and cardiac pathologies were recruited from the community. The study was approved by the Research Ethics Committee of HUOL/UFRN, Natal, RN, Brazil (protocol number 095/2011), and all subjects provided written informed consent.
Study designPatients with stroke and healthy controls were assessed on two different days, with a maximum interval of three days. On the first day, a physical examination was performed to verify vital signs including blood pressure (BP), heart rate (HR), peripheral oxygen saturation (SpO2), anthropometric characteristics, spirometry, and respiratory muscle strength. On the second day, the subjects were evaluated using OEP before, during, and after the experimental protocol.
MeasurementsPulmonary function and respiratory muscle strengthThe measures of pulmonary function testing were: forced expiratory volume in 1st second (FEV1) and forced vital capacity (FVC) measured by a spirometer (KoKo DigiDoser, nSpire Health Inc., Longmont, CO, USA), in accordance with the technical procedures of the American Thoracic Society/European Respiratory Society (ATS/ERS).16,17 The predicted values were calculated using previously published reference values.18 Respiratory muscle strength was evaluated by maximal respiratory pressure measurements and the Sniff Nasal Inspiratory Pressure (SNIP) test using a MicroRPM spirometer (MICRO Medical Ltd., Rochester, Kent, UK), following previously described procedures17 and reference values standardized for the studied population.19,20
Optoelectronic plethysmographyOEP allows the analysis of chest wall kinematics to evaluate chest wall motion during breathing by three-dimensional (3D) analysis.21,22 OEP uses 89 reflective markers (42 on the anterior thoraco-abdominal wall, 37 on the posterior wall, and 10 on the lateral) fixed to the trunk between the sternal notch and the clavicles to the anterior superior iliac crest along seven vertical lines, five horizontal, two medium axillary, and seven extra markers.23
The OEP data were captured by six infrared cameras (OEP System, BTS-Bioengineering, Milan, Italy), three positioned in front and three behind the trunk.21,22 In OEP, the 3D marker coordinates are calculated by stereo-photogrammetry. A closed surface of the subject's total trunk is then reconstructed by connecting the coordinates of the markers, and the volume enclosed by this surface is computed by means of an algorithm based on the Gauss theorem.22
Consistent with previous studies, the chest wall was modeled in three compartments: pulmonary rib cage (Rcp), abdominal rib cage (Rca), and abdomen (Ab). The Rcp was separated from the Rca by a transverse section placed at the level of the xiphoid process, while the lower costal margin separates the Rca from the Ab.22,24–26
Experimental protocolChest wall volumes were measured during 5min of spontaneous quiet breathing in resting conditions, during 5min of three different levels of PEP (PEP10, PEP15, PEP20cmH2O) and then during 5min of recovery after PEP use. A previous pilot study with four subjects was performed to define PEP use duration. Subjects remained seated on a backless bench, with hands on thighs and arms extended away from the trunk during the protocol.13 A PEP valve with adjustable load between 0cmH2O and 20cmH2O (Mercury Medical®, Clearwater, FL, USA) coupled to an adapted face mask (Vital Signs™, Atlanta, GA, USA) was used. PEP intensities of 10, 15, and 20cmH2O were randomly chosen by drawing the pieces of paper (with PEP intensity) from a bag. PEP intensity was based on a previous study performed by Frazão et al.13 The participants were allowed to rest for 30min between measurements.13
Optoelectronic plethysmography data analysisThe OEP was performed with the subjects seated on a backless bench, with hands on thighs and arms extended away from the trunk during the protocol.13 Equipment preparation and marker positioning were performed by a single, previously trained assessor. From optoelectronic volume measurements, the following parameters were obtained: tidal volume of the chest wall (VTCw) and its compartments (VTRcp, VTRca, and VTAb); operating volumes, i.e., end-expiratory volumes (EEV) and end-inspiratory volumes (EIV) of the chest wall and its compartments; inspiratory time (TI), expiratory time (TE), total respiratory cycle time (Ttot), duty cycle (TI/Ttot), and breathing frequency (f); indexes of shortening velocity of inspiratory rib cage muscles (VTRcp/TI), expiratory muscles (VTRcp/TE), diaphragm (VTAb/TI), and expiratory abdominal muscles (VTAb/TE).13
Statistical analysisThe study's sample size was established considering the standard deviation of VTCw of 105ml from a previously published study with subjects with stroke conducted by Lanini et al.27 A power of 85% and alpha level of 0.05 were used, resulting in a sample size of 20 subjects for the stroke group. Values were expressed as means and standard deviations due to the normal distribution of data determined by the Shapiro–Wilk test. Student's t-test was used to analyze anthropometric and pulmonary function variables. Two-way ANOVA comparison test with Bonferroni's post hoc was used for intergroup assessment of the influence of the disease and PEP intensity on lung volumes, considering PEP intensity and the presence of stroke. One-way ANOVA was applied to evaluate intragroup responses at different PEP intensities in patients with stroke and healthy controls. All analyses were conducted using GraphPad Prism 5.0 (GraphPad Software Inc., La Jolla, CA, USA). A 5% significance level was set for all tests. The software G*Power, version 3.1.9.2 (Heinrich Heine, Universität Düsseldorf) was used to determine the statistical power of the study.
Sample sizeTo assess and calculate the effect size, considering p≤0.05, the mean and standard deviation from tidal volume of PEP10, PEP15, and PEP20 were used. Considering a sample size of 16 subjects in both groups, the results showed a statistical power of 0.99 (1−β err. Prob.). The effect size varied from 1.4 to 1.7 for all mean and standard deviations from tidal volume of PEP10, PEP15, and PEP20, which is considered a large effect size by Faul et al.28
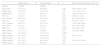
ResultsAnthropometry, pulmonary function, and respiratory muscle strengthStroke subjects were recruited at the Neurology Service of HUOL. Twenty-one subjects with stroke diagnosis and sixteen healthy individuals were recruited for the study. Five subjects with stroke were excluded during the analysis process (one due to incapacity to perform spirometric and respiratory muscle strength tests and the other four due to technically unacceptable spirometric values). The final sample consisted of 16 subjects with stroke and 16 healthy individuals. From the stroke group, three individuals had hemorrhagic stroke and 13 had ischemic stroke. There was no statistically significant difference between the groups for age, gender, and anthropometric characteristics. Subjects with stroke showed significantly lower values of FVC, FEV1, peak expiratory flow (PEF), maximum inspiratory pressure (MIP), maximum expiratory pressure (MEP), and SNIP when compared to the control group (p<0.05). When comparing FEV1/FVC values, the values were similar for both groups (p>0.05). The anthropometric, spirometric, and respiratory muscle strength values are described in Table 1 for both groups.
Anthropometric, spirometric, and global respiratory muscle strength data.
| Stroke group (n=16) | Control group (n=16) | p | Between-group differences (95% CI) | |
|---|---|---|---|---|
| Gender | 11M/5F | 11M/5F | – | |
| Age (years) | 55.7 (9.3) | 56.3 (9.8) | 0.86 | 0.56 (−6.35 to 7.47) |
| Height (cm) | 163.9 (8.7) | 165.8 (8.3) | 0.42 | −2.4 (−8.58 to 3.7) |
| BMI (kg/m2) | 27.2 (3.5) | 26.9 (3.7) | 0.81 | −0.29 (−2.89 to 2.3) |
| FVC (L) | 3.2 (0.7) | 3.8 (0.6) | 0.01* | 0.59 (0.11–1.06) |
| FVC (%pred.) | 88.2 (12.7) | 97.4 (12.7) | 0.04* | 9.21 (0.00–18.42) |
| FEV1 (L) | 2.5 (0.6) | 3.1 (0.5) | 0.01* | 0.54 (0.15–0.93) |
| FEV1 (%pred.) | 86 (11.4) | 97.7 (12.5) | 0.01* | 11.67 (2.99–20.34) |
| FEV1/FVC | 0.8 (0.1) | 0.8 (0.1) | 0.22 | 0.02 (−0.01–0.05) |
| PEF (L/s) | 5.0 (1.9) | 7.0 (1.7) | 0.003* | 1.97 (0.68–3.26) |
| MIP (cmH2O) | 75.1 (31.8) | 116 (46) | 0.01* | 41 (12.42–69.58) |
| MIP (%pred.) | 76.1 (28.7) | 111.8 (38.7) | 0.005* | – |
| MEP (cmH2O) | 91.7 (22.8) | 124.8 (34.1) | 0.01* | 33 (12.1–54) |
| MEP (%pred.) | 92.1 (23) | 114.5 (30.8) | 0.02* | – |
| SNIP (cmH2O) | 61.7 (20.7) | 96.5 (25.2) | 0.01* | 34.7 (18.12–51.38) |
| SNIP (%pred.) | 64.7 (21.2) | 98.9 (23) | 0.01* | – |
M, males; F, females; BMI, body mass index; FVC, forced vital capacity; FEV1, forced expiratory volume in 1s; PEF, peak expiratory flow; MIP, maximum inspiratory pressure; MEP, maximum expiratory pressure; SNIP, sniff nasal inspiratory pressure; %pred., percentage of predicted value. Data are shown as mean (SD); statistics performed using unpaired t test.
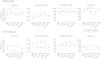
Total and compartmental VTCw were similar in both groups during quiet breathing (p>0.05). The control group showed a significant increase in VTCw during different intensities of PEP compared to quiet breathing [1.32L at PEP10 (p<0.001; 95% CI 0.69–1.88), 1.54L at PEP15 (p<0.001; 95% CI 0.93–2.12) and 1.80L at PEP20 (p<0.001; 95% CI 1.21–2.40)], respectively. The stroke group showed a lower increase in VTCw during PEP10, PEP15 and PEP20 compared to quiet breathing [0.41L (p>0.05; 95% CI −0.16 to 1.02), 0.56L (p<0.05; 95% CI 0.06–1.13) and 0.52L (p>0.05; 95% CI −0.11 to 1.08)], respectively. During the recovery period, the VT returned to baseline values in both groups. When we analyzed the chest wall compartments, we found an increase in VT for both groups; however, it was considerably larger in the control group: VTRcp [0.412L (p>0.05; 95% CI −0.026 to 0.850); 1.89L (p<0.001; 95% CI 1.451–2.329) and 2.157L (p<0.001; 95% CI 1.718–2.596)]; VTRca [0.239L (p>0.001; 95% CI 0.121–0.356); 0.277L (p>0.001; 95% CI 0.159–0.394); 0.338L (p>0.001; 95% CI 0.220–0.455)]; VTAb [0.654L (p>0.001; 95% CI 0.375–0.932); 0.747L (p<0.001; 95% CI 0.468–1.026); 0.871L (p<0.001; 95% CI 0.592–1.150)] during PEP10, PEP15, and PEP20, respectively.
The stroke group showed the following values: VTRcp [0.150L (p>0.05; 95% CI −0.288 to 0.588); 0.876L (p<0.001; 95% CI 0.437–1.315) and 0.829L (p<0.001; 95% CI 0.390–1.268)]; VTRca [0.056L (p>0.05; 95% CI 0.061–0.173); 0.093L (p>0.05; 95% CI 0.024–0.021); 0.075L (p>0.05; 95% CI −0.042 to 0.192)]; VTAb [0.002L (p>0.05; 95% CI −0.281 to 0.276); 0.270L (p<0.05; 95% CI −0.008 to 0.549); 0.329L (p<0.01; 95% CI 0.050–0.608)] during PEP10, PEP15, and PEP20, respectively. In this group, the increase was due to a higher contribution of the abdominal compartment at the different intensities of PEP compared to quiet breathing. Control individuals showed a proportional contribution of Rcp and Ab compartment during quiet breathing and PEP administration.
Fig. 1 shows the mean VT values for total chest wall and its compartments (VTRcp, VTRca, and VTAb) during quiet breathing, PEP10, PEP15, and PEP20, and the recovery period in both groups.
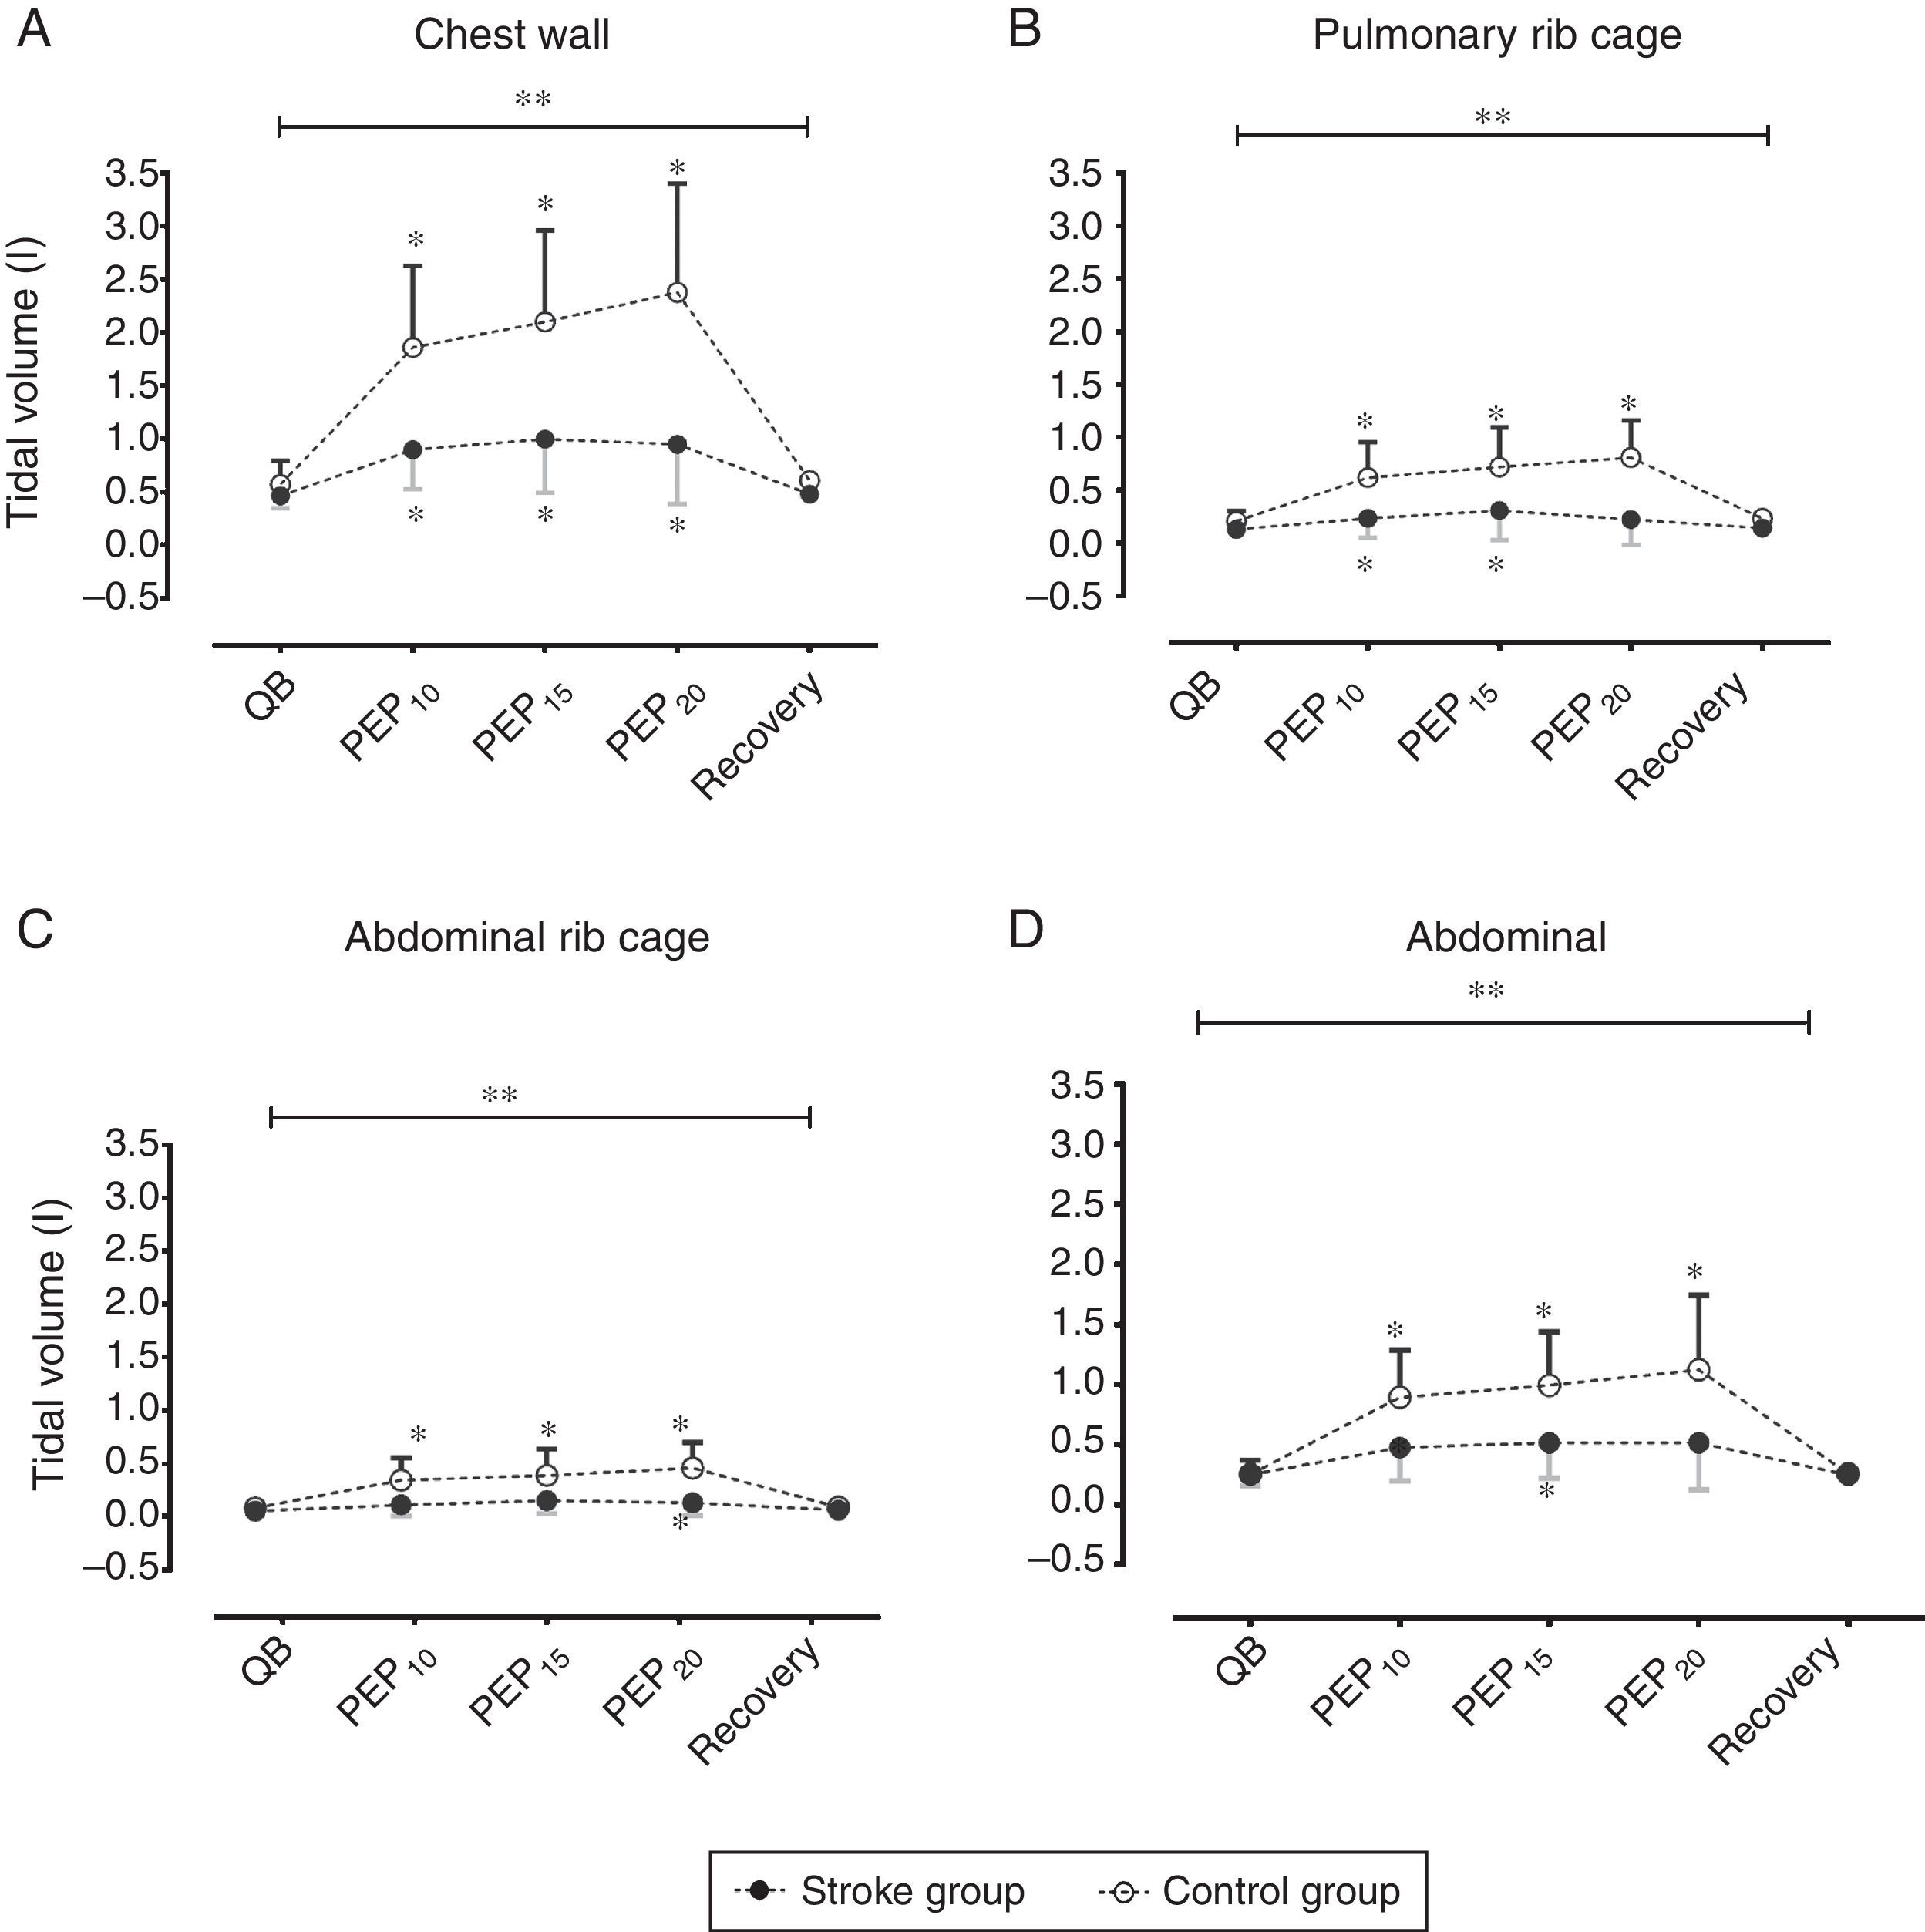
(A) Tidal volume of chest wall; (B) tidal volume of pulmonary rib cage; (C) tidal volume of abdominal rib cage; and (D) tidal volume of abdominal compartment in stroke group (closed symbols) and controls (open symbols) during quiet breathing (QB), PEP10, PEP15, PEP20cmH2O, and recovery (Rec). Data are presented as means and standard deviation. **p<0.05 for two-way ANOVA interaction between disease and PEP and *p<0.05 for Bonferroni comparisons.
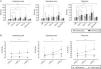
Fig. 2 shows the effect of PEP on total and compartmental chest wall operational volumes, i.e., the variations of EEV and EIV compared to quiet breathing. Intragroup analysis showed no significant difference in EEV and EIV when quiet breathing was compared to the different intensities of PEP and the recovery period in the stroke group. Control group EEV was significantly decreased for total chest wall and Ab compartment during all PEP intensities compared to quiet breathing and recovery period. When the groups were compared, a different pattern was observed for operational volumes. While controls showed decreased EEV, the subjects with stroke showed a slight increase in the same operational volume. The EEV was significantly higher for total chest wall and Ab compartment in subjects with stroke compared to controls (p<0.05). EIV and EEV returned to baseline values during the recovery phase in both groups.
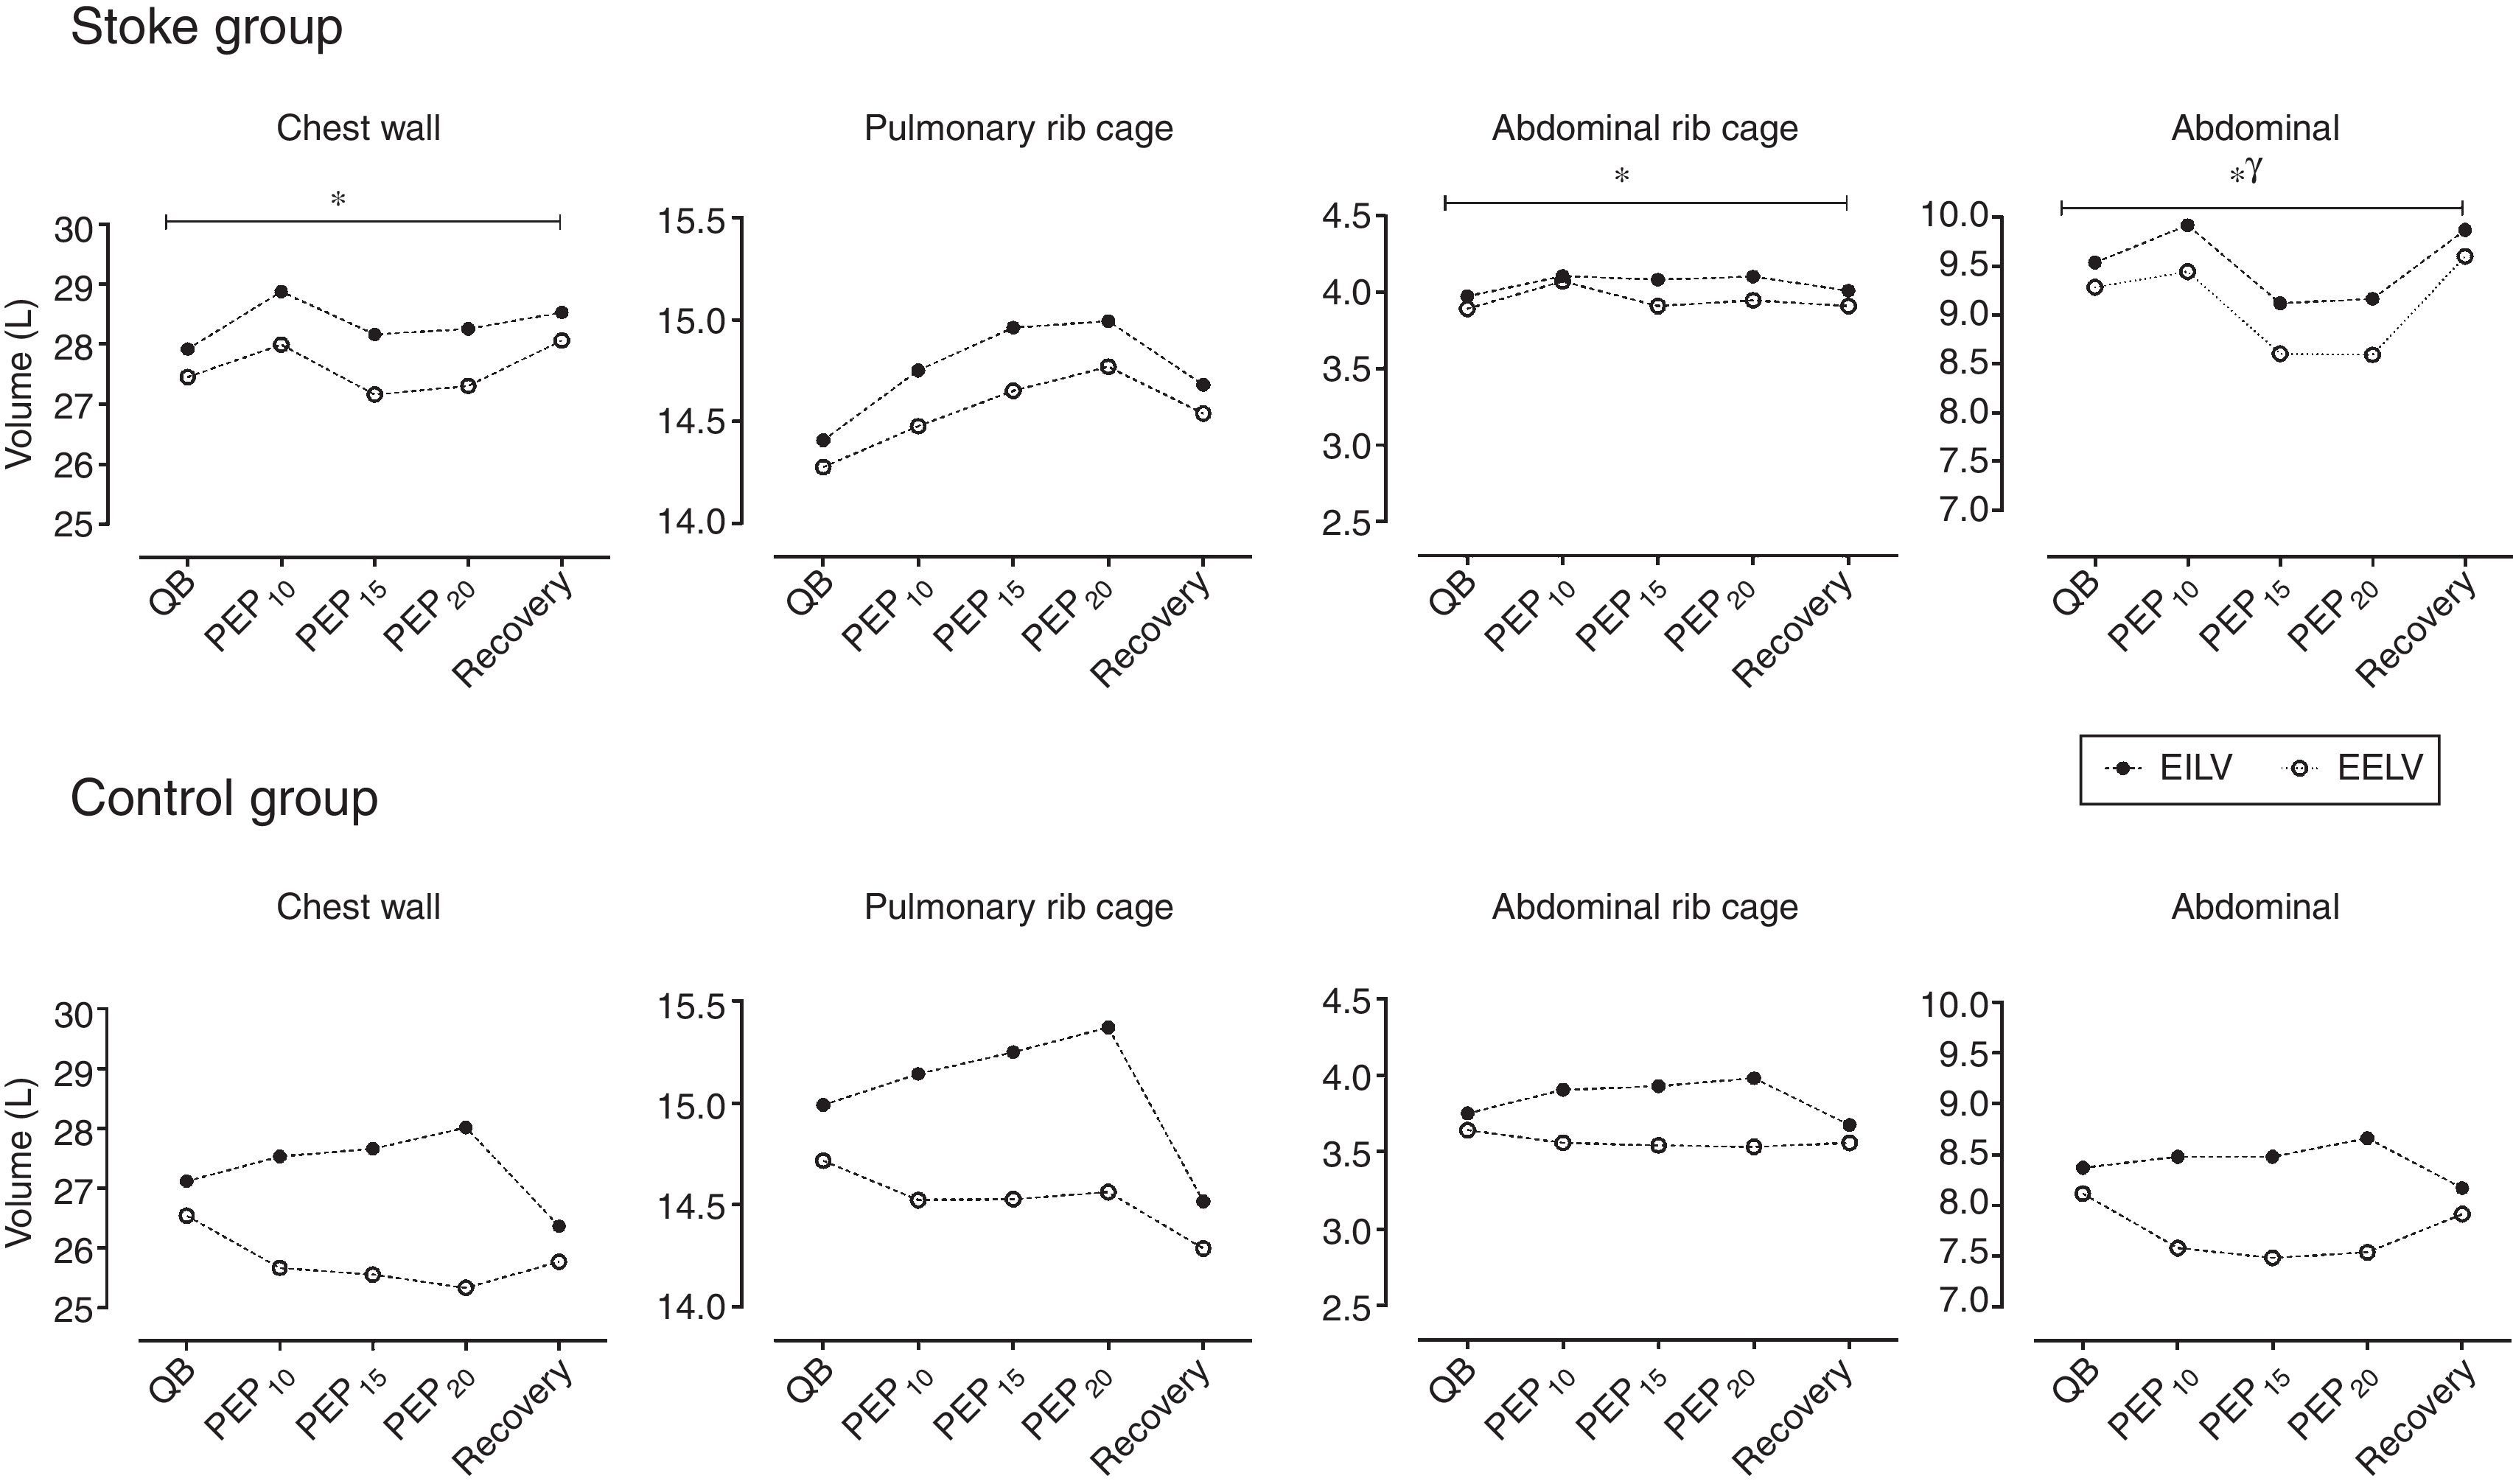
Operational volumes of total chest wall, pulmonary rib cage, abdominal rib cage, and abdominal compartments in stroke group (upper panels) and control group (lower panels). End-expiratory volume (EEV, open symbols) and end-inspiratory volume (EIV, closed symbols) during quiet breathing (QB), PEP10, PEP15, PEP20cmH2O, and recovery (Rec). Data are presented as means. Statistics performed using two-way ANOVA with Bonferroni post hoc test to compare EEV and EIV between groups. *p<0.05 for intragroup differences in EEV and **p<0.05 for intergroup differences in EEV.
Fig. 3 shows the differences in the variation of respiratory timing in controls. Inspiratory and expiratory times increased significantly during PEP15 and PEP20 compared to quiet breathing in the control group: TI of quiet breathing=1.09 SD=0.25s, PEP15=2.55 SD=1.18s (p<0.001; 95% CI 0.82–2.08), PEP20=2.75 SD=1.52s (p<0.001; 95% CI 1.01–2.29); TE of quiet breathing=1.79 SD=0.33s, PEP15=3.35 SD=3.15s (p<0.05; 95% CI 0.003–3.11), PEP20=4.63 SD=3.09s (p<0.001; 95% CI 1.01–4.12). The Ttot in the control group showed a significant increase in all intensities of PEP compared to quiet breathing: quiet breathing=2.89 SD=0.54s, PEP10=4.99 SD=3.27s (p<0.01; 95% CI 0.26–3.93), PEP15=5.90 SD=3.70s (p<0.001; 95% CI 1.17–4.84), PEP20=7.11 SD=3.47s (p<0.001; 95% CI 2.38–6.05). The TI, TE, and Ttot variations were not significantly different (p>0.05) in the stroke group when PEP was compared to quiet breathing. Fig. 3B shows the difference in respiratory timing between the groups.
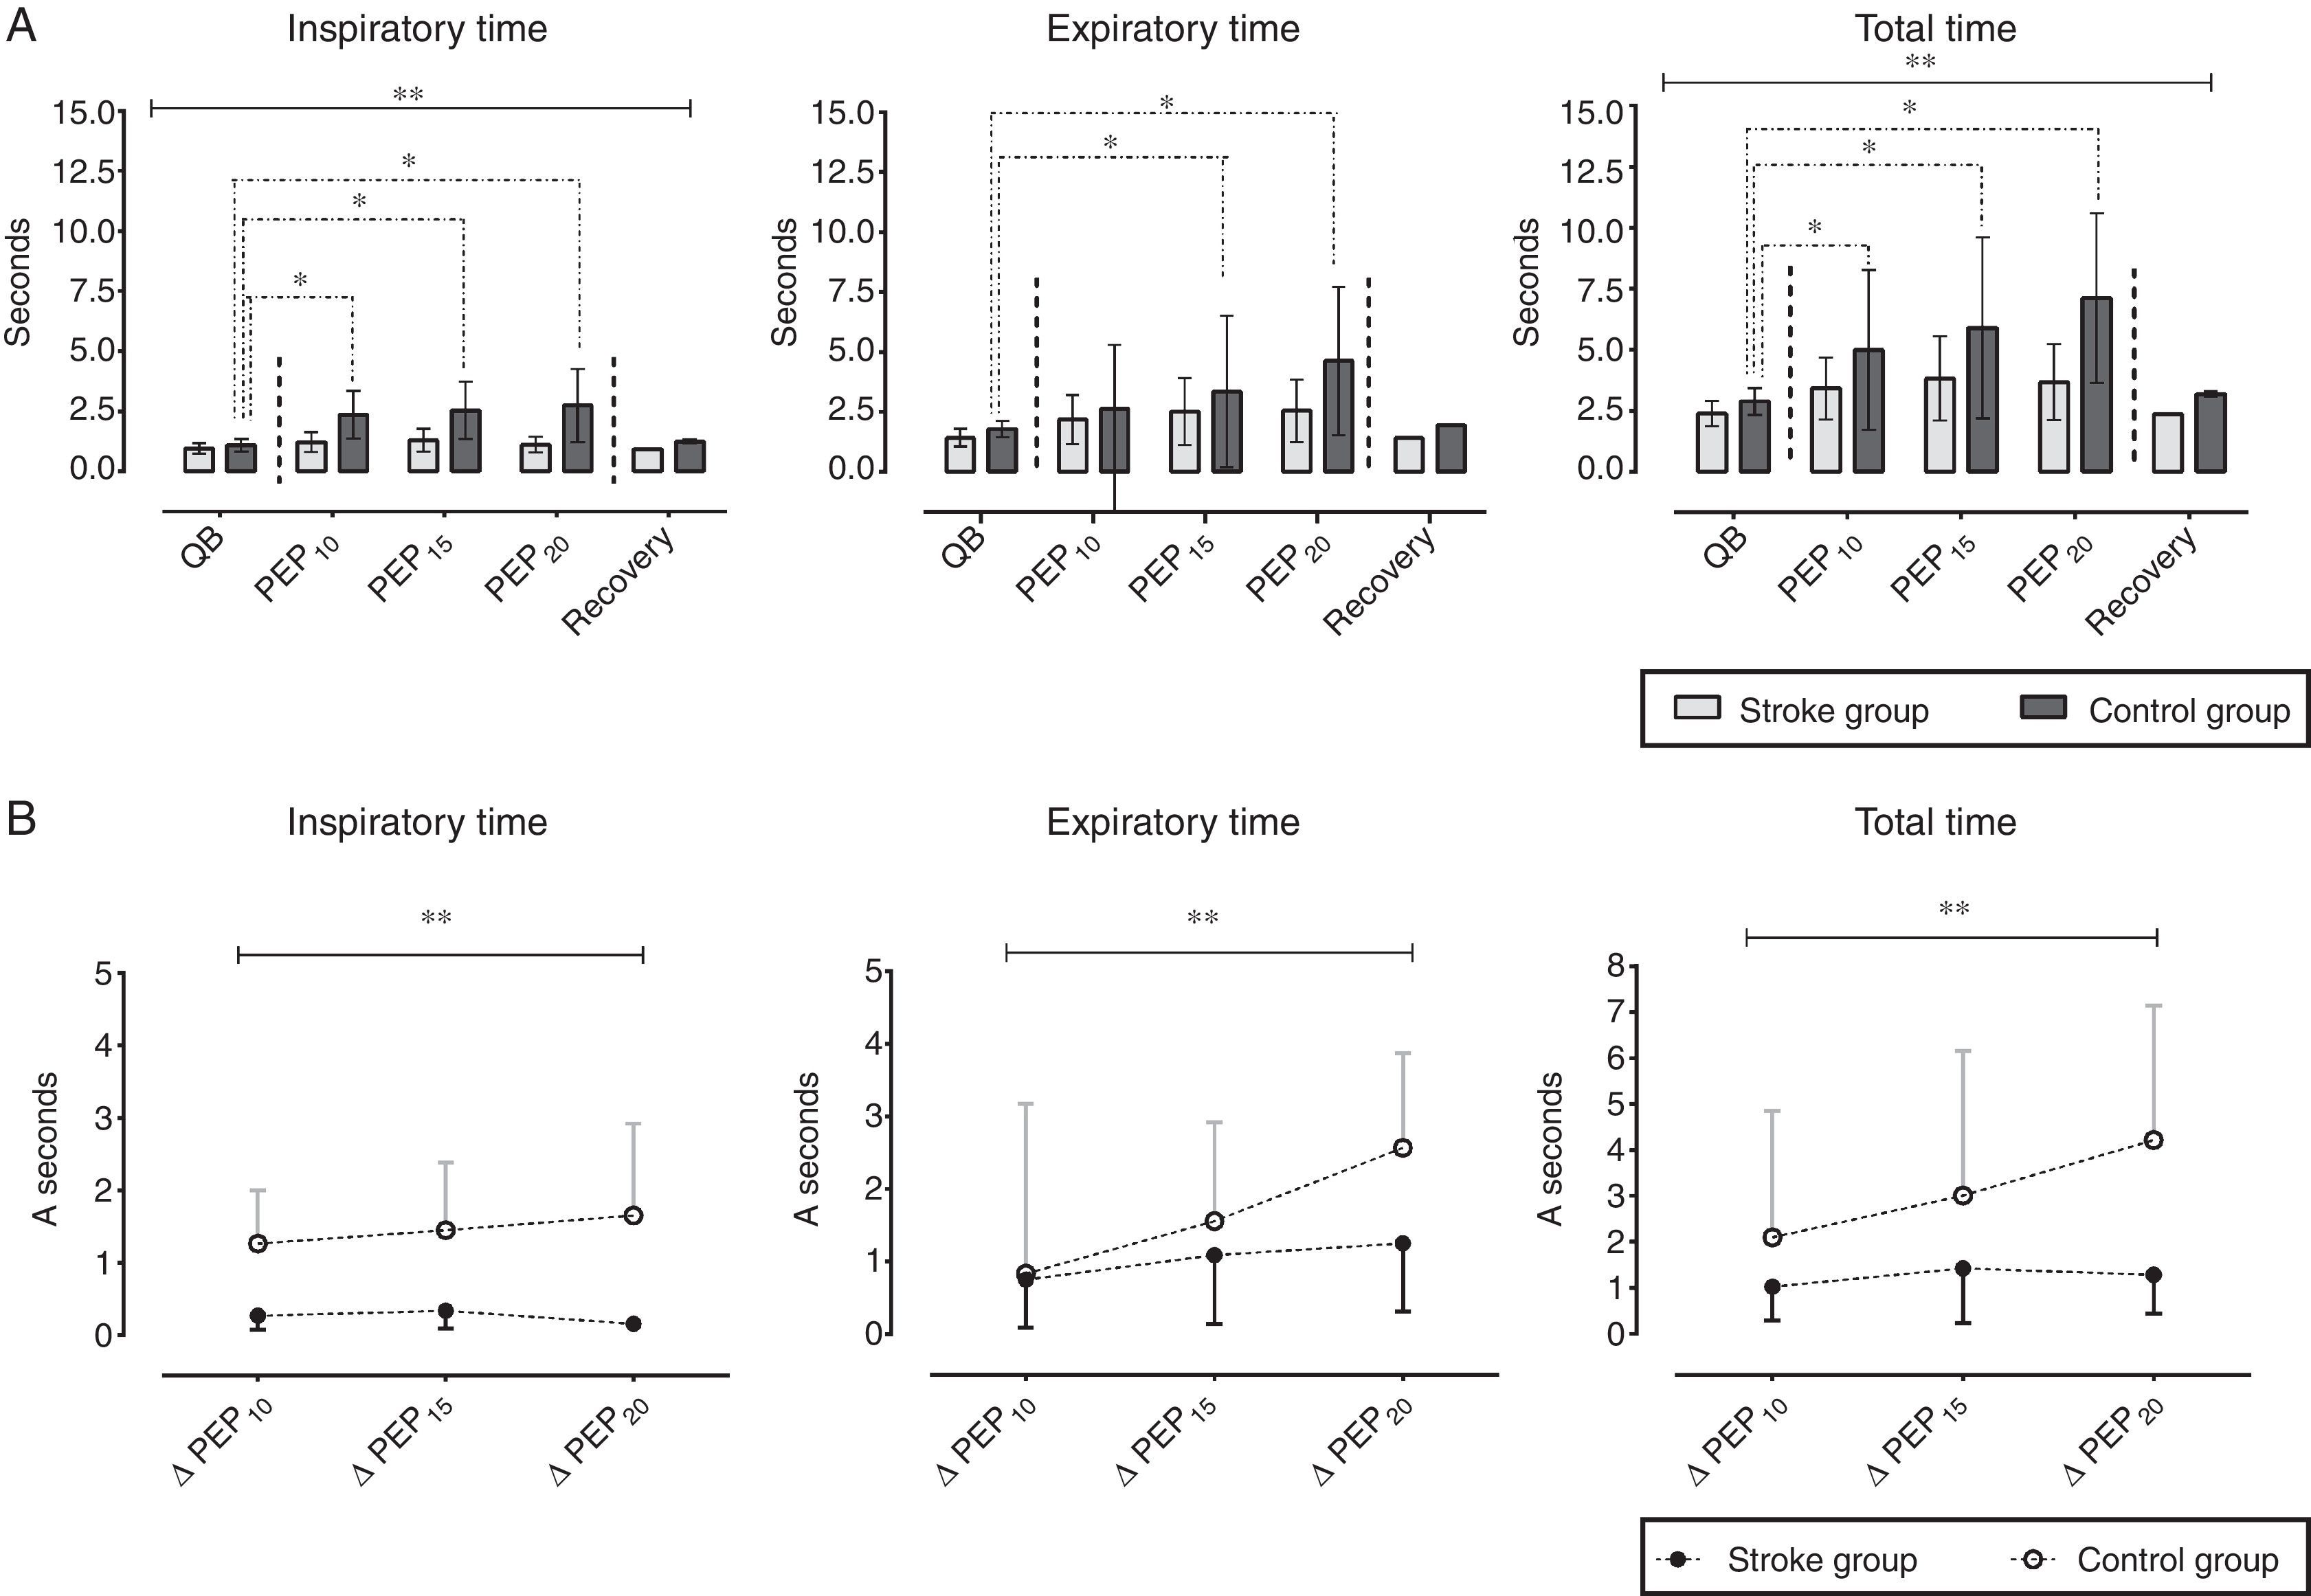
(A) Inspiratory time, expiratory time, and total respiratory cycle time for stroke group (light gray) and controls (dark gray) during quiet breathing (QB), PEP10, PEP15, PEP20cmH2O, and recovery. (B) Δ Inspiratory time, expiratory time, and total respiratory cycle time in subjects with stroke (closed symbols) and healthy controls (open symbols). Data are presented as means and standard deviation. Statistics performed using two-way ANOVA. **p<0.05 for disease versus PEP interaction and *p<0.05 for Bonferroni comparisons.
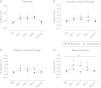
Fig. 4 shows the quantitative indexes of the shortening velocity of different respiratory muscle groups. The intragroup analysis showed a significant increase in the indexes of shortening velocity of the diaphragm (Vt,Ab/Ti – Fig. 4A), inspiratory muscles (Vt,Rcp/Ti – Fig. 4B), expiratory muscles (Vt,Rcp/Te – Fig. 4C), and abdominal muscles (Vt,Ab/Te – Fig. 4D) at different intensities of PEP compared to quiet breathing in controls (p<0.05). Stroke subjects only showed a significant increase in diaphragm muscle shortening velocity index during PEP20 when compared to quiet breathing (p<0.05). Intergroup comparison showed that inspiratory and expiratory muscle shortening velocity indexes were significantly higher in controls during the administration of PEP20 (p<0.05) and the abdominal muscle shortening velocity index was significantly higher in controls during PEP15 (p<0.05).
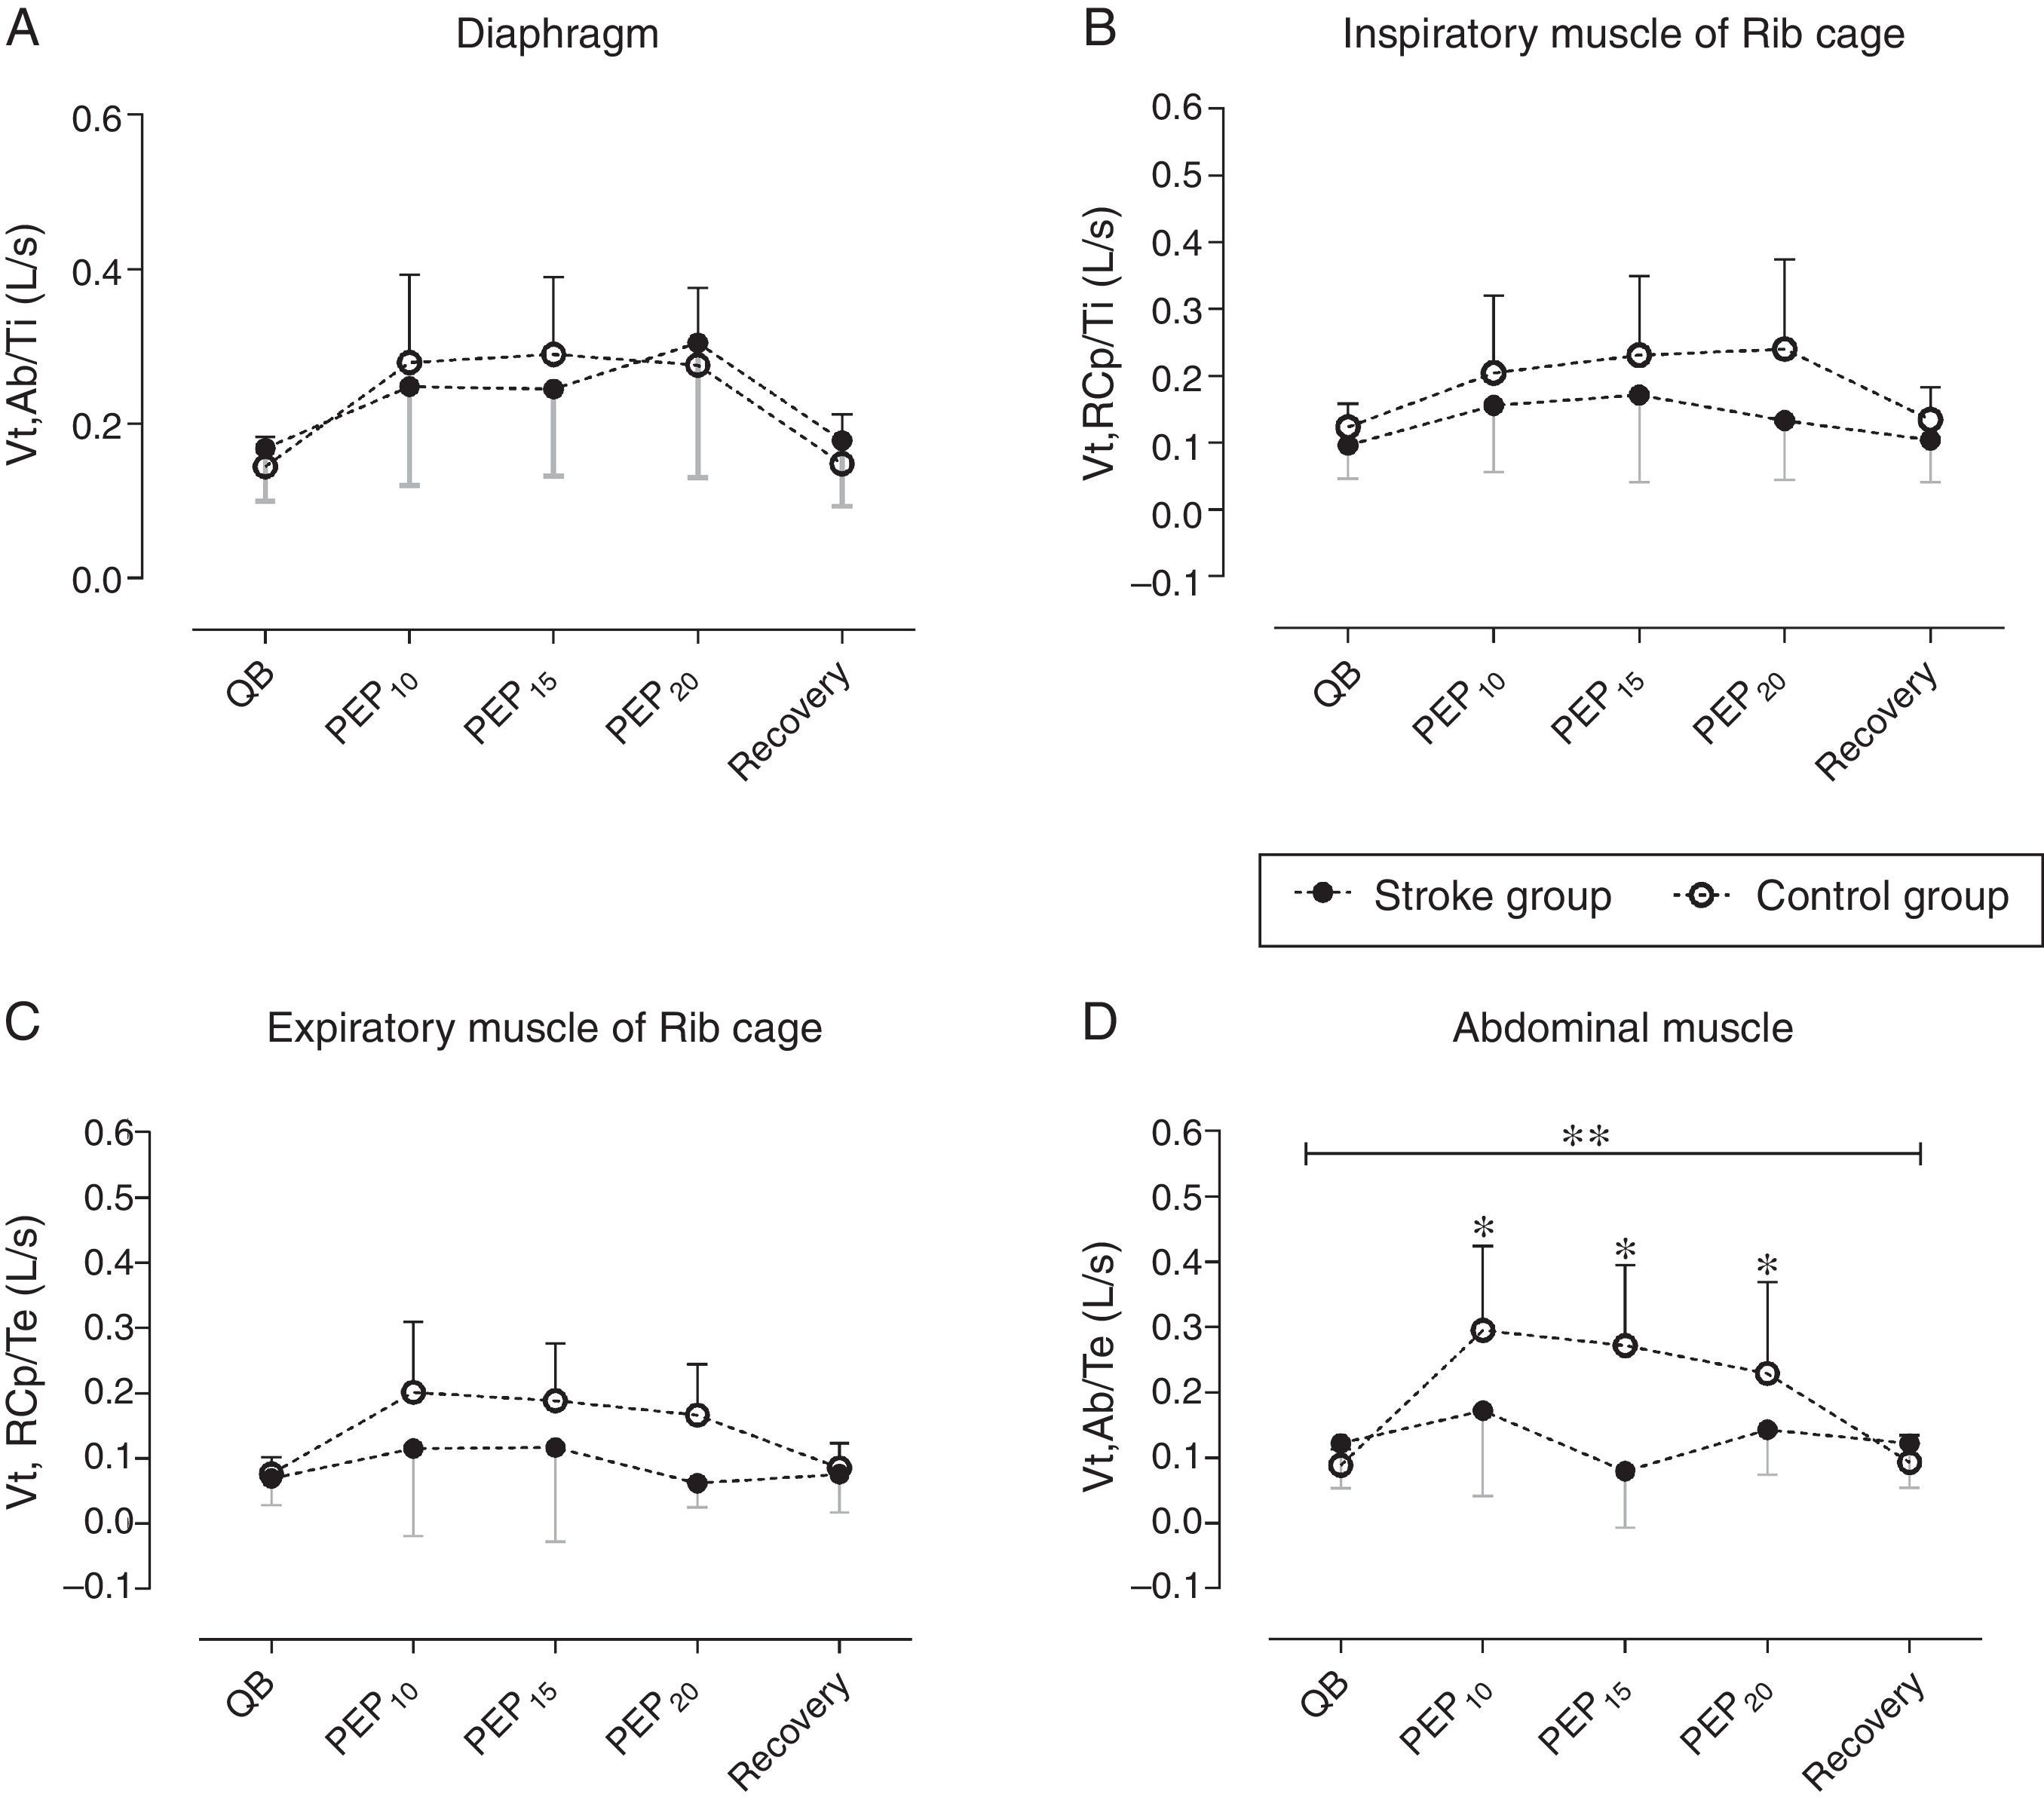
Indexes of shortening velocity for different respiratory muscles groups. (A) Vt,Ab/Ti (shortening velocity index of diaphragm); (B) Vt,Rcp/Ti (shortening velocity index of inspiratory muscles); (C) Vt,Rcp/Te (shortening velocity index of expiratory muscles); (D) Vt,Ab/Te (shortening velocity index of abdominal muscles). Stroke group (closed symbols) and control group (open symbols) during quiet breathing (QB), PEP10, PEP15, PEP20cmH2O, and recovery (Rec). Data are presented as means and standard deviation. Statistical analysis performed using two-way ANOVA; *p<0.05 for Bonferroni comparisons in healthy individuals; **p<0.05 for Bonferroni comparisons in stroke group; #p<0.05 for intergroup comparisons.
The aim of this study was to observe the effect of different intensities of PEP on chest wall kinematics in subjects with stroke compared to healthy controls. During the administration of different intensities of PEP, the changes in total and compartmental chest wall volumes and operating volumes differed between healthy controls and subjects with stroke in both pattern and magnitude. Consistent with previous studies, subjects with stroke show altered pulmonary function, which leads to a restrictive pattern.2 Based on this finding, one of the aims of respiratory therapy in the stroke population is to expand the chest wall and consequently increase lung volumes, which is essential to prevent the development of respiratory complications in these individuals.2,27
Our results show that the use of PEP in subjects with stroke changed chest wall kinematics significantly in terms of VT and operational volumes, as well as respiratory pattern. The response to PEP, however, was different in subjects with stroke compared to healthy individuals. Although PEP increased VT and decreased respiratory rate in both groups, the magnitude of PEP-induced responses in the stroke group was lower when compared to controls. The increase in VT in subjects with stroke was very limited, particularly due to the limited increase in the Rcp and Rca compartments. These results indicate that, in subjects with stroke, the restriction is located mainly in the rib cage, where the stiffness is increased, and that the weakness of inspiratory rib cage muscles is particularly marked. Moreover, the lower increase in VT on stroke group compared to controls may be due to the similar increase in operational volumes, which means, the increase in EIV was followed by an increase in EEV that characterizes lung hyperinflation (Fig. 2 – upper panel).
Other important differences between stroke subjects and healthy controls that were found during PEP administration are related to timing and operational volumes. While healthy controls showed an increase in both TI and TE during PEP, subjects with stroke did not significantly increase these values although respiratory rate decrease showed the same magnitude during PEP15 and PEP20 when we compared controls with stroke. This pattern, spontaneously adopted by subjects with stroke during PEP, was independent of PEP intensities and determined lung dynamic hyperinflation, particularly due to the unchanged expiratory time and the consequent insufficient time to deflate the lung. Hyperinflation was due to the progressive increase in EEV of Rcp that the Ab compartment tried to counter-balance without success.
The literature about PEP therapy in subjects with stroke is quite scarce and therefore it is difficult to compare and discuss current results.2 A study that assessed breathing pattern and the contribution of the rib cage and abdomen in 16 hemiparetic subjects and 19 healthy individuals using respiratory inductance plethysmography found similar results to the present study regarding VT changes, i.e., VT increase of 13.5% and 5.1% in healthy and subjects with stroke, respectively. Due to the differences in assessment techniques and body posture, the comparison of our results with those of Teixeira-Salmela et al.29 is not fully adequate.27,29 Lanini et al.27 evaluated volume variations in eight subjects with stroke during voluntary hyperventilation and hypercapnic stimulation by OEP. Although Lanini et al.27 focused their attention on the changes in the hemiparetic and non-hemiparetic side, striking differences were observed between VT at rest in subjects with stroke and that obtained in this study (mean 819ml versus 478ml, respectively). These discrepancies may be due to the fact that those authors performed the measurements with a mouthpiece, to concomitant measure flow and chest wall volume, which may have altered the breathing pattern due to the increase in dead space.
We observed that PEP 10cmH2O or higher determines a clear and progressive increase in EEV in the Rcp compartment, characterized by compartment hyperinflation. Possible consequences of the administration of PEP higher than 10cmH2O could be respiratory discomfort, dyspnea, and subsequent early abandonment of the therapy. Considering that PEP therapy has the advantage of being an easy-to-use, portable therapeutic device, it is important to plan strategies to optimize adherence and achieve successful treatment outcomes.
Regarding clinical implications, we found that the use of PEP at an intensity of 10cmH2O leads to lung volume increase in subjects with stroke. It can also be used in different places such as the subject's home without any risk. The present study has some limitations, including the lack of assessment of symptoms during the protocol, which could have reinforced the results obtained regarding the intensity of recommended PEPs. In addition, subjects with stroke are known to be heterogeneous in terms of symptoms and motor impairment and this determines heterogeneity in the response to different interventions including PEP.
In conclusion, this study shows that the use of PEP promotes different changes in breathing pattern and chest wall volumes in subjects with stroke and healthy individuals. The differences observed between the groups regarding VT may be due to different mechanisms such as rib cage stiffness, inspiratory muscle weakness, and particularly impaired ventilatory motor unit. Chest expansion in subjects with stroke, however, is different from that observed in healthy individuals, as the restriction determines limited ability to decrease frequency during PEP and this causes lung and pulmonary rib cage hyperinflation that progressively increases with higher intensities of PEP. Thus, the administration of PEP in subjects with stroke should be used with caution, especially at intensities above 10cmH2O to avoid respiratory discomfort and early interruption of therapy.
Conflicts of interestThe authors declare no conflicts of interest.