


One of the most frequent complaints among people with musculoskeletal pain is pain during physical activity, commonly referred to as movement-evoked pain. It is suggested to be associated with quantitative sensory testing measures of central pain process in individuals with musculoskeletal pain.
ObjectiveTo investigate the predictive association between movement-evoked pain scores and measures of central sensitization in patients with chronic nonspecific low back pain. The secondary aim was to determine whether changes in movement-evoked pain scores are associated with changes in measures of central sensitization.
MethodsIn this longitudinal prospective study, 50 participants with chronic low back pain were included. Pain pressure thresholds, temporal summation of pain, descending pain modulation, and the central sensitization index were assessed as measures of central sensitization. Movement-evoked pain was evaluated using the Back Performance Scale and a 5-minute walk test.
ResultsMeasures of central sensitization, specifically pressure pain thresholds and temporal summation, demonstrated predictive associations with movement-evoked pain measures. In response to treatment, improvements in movement-evoked pain were associated with improvements in measures of central sensitization (i.e., pressure pain thresholds and temporal summation) and improved pressure pain thresholds in the plantar toe significantly predict movement-evoked pain measures experienced during the 5-minute walk test.
ConclusionsThese results imply that movement-evoked pain is related to processes related to central modulation of pain in patients with nonspecific chronic low back pain.
One of the most frequent complaints among people with musculoskeletal pain is pain during physical activity,1 commonly referred to as movement-evoked pain (MEP).2 Researchers in the field suggest MEP to be characterized by distinct underlying mechanisms3,4 compared to pain at rest or spontaneous pain, and evidence for both peripherally5-7 and centrally-oriented mechanisms8-10 has been reported. Clarifying the underlying mechanisms of MEP is essential for making the appropriate treatment choice. An optimal treatment of MEP is important as persistent musculoskeletal pain interferes with one's overall quality of life and is implicated as the global leader in disability11,12 and socio-economic burden.13
Two types of outcome measures are used to evaluate MEP: a maximum or average pain score; representing the pain experienced during a specific movement task, and a MEP index score; representing a maximum or average pain score, yet corrected for baseline pain (to calculate the MEP index score, the baseline pain score – assessed at rest, before completing any movement task – is subtracted from the maximum [or average] pain score).14-18 The latter represents how pain evolves during the movement task and is associated with quantitative sensory testing measures of central pain processing8,9 in individuals with musculoskeletal pain.
Central sensitization (CS) encompasses various related dysfunctions within the central nervous system.19 These dysfunctions of the central nervous system include altered sensory processing in the brain,20,21 malfunctioning of descending anti-nociceptive mechanisms,22,23 increased activity of nociceptive facilitatory pathways, and enhanced temporal summation of pain.24-26 The underlying processes related to CS cannot directly be measured in clinical practice.27 Therefore, quantitative sensory testing measures are used.28 Researchers utilize various diagnostic markers for CS, including widespread sensitization, temporal summation (TS), spatial summation, conditioned pain modulation (CPM), and questionnaires.29
Pressure pain thresholds (PPTs) and TS have been previously implemented to investigate the relation between MEP scores and sensory hypersensitivity, but little is known whether a link with CPM30 and sensitivity questionnaires exists. A frequently used sensitivity questionnaire for investigating CS is the central sensitization inventory (CSI),31 for which a relation with MEP has been demonstrated in patients with postoperative pain.32 Additionally, there is proof of a relation between MEP index scores and measures of CS (i.e. PTT and TS) in patients with knee osteoarthritis18,33 and musculoskeletal pain,34 but not in patients with chronic low back pain. A recent randomized controlled trial35 investigating MEP in shoulder pain suggested that future research should investigate the predictive role of CS measures on clinical outcomes in patients with pain. Moreover, measuring MEP scores, and more specifically, MEP index scores, is possibly a feasible alternative for clinicians to gain insight into CS in patients, because these are more related to their activity-related symptoms than quantitative sensory testing.34 Providing more insight into how MEP relates to measures of CS in patients with chronic low back pain possibly allows opportunities to improve MEP measurement and treatment in clinical practice. In this study, the primary aim was to investigate the predictive association between MEP (index) scores and measures of CS in patients with chronic nonspecific low back pain (CNLBP). The secondary aim was to determine whether changes in MEP (index) scores are associated with changes in measures of CS in patients with CNLBP. These research questions were attempted to be answered through a longitudinal prospective study design, using PPT, TS, CPM, and the CSI as measures of CS.
MethodsStudy designThis study used a longitudinal prospective design and was conducted as a secondary analysis in a randomized controlled trial36 performed at the University Hospital of Brussels and the Vrije Universiteit Brussel. It was approved by the local ethics committees of the University Hospital of Brussels, Belgium (B.U.N. 143,201,836,092) and was conducted between August 2018 and June 2019. The study protocol was preregistered online on ClinicalTrials.gov (NCT03643731) and reported according to the STROBE guidelines.37 In this randomized controlled trial, the effectiveness of heat and transcutaneous electrical nerve stimulation on pain was compared to no treatment in patients with CNLBP. Pain measures were assessed at baseline, after 30 min of transcutaneous electrical nerve stimulation, and after 4 weeks of daily transcutaneous electrical nerve stimulation. For more details regarding the study methodology, refer to the paper reporting the main trial findings.38 The present study has a different focus, exploring the underlying mechanisms of movement evoked pain in these patients.
Study population and sample sizeA sample of 50 participants with CNLBP (>3 months)39 was recruited trough posters and flyers distributed in the University Hospital of Brussels and the Vrije Universiteit Brussel, and via social media. All participants provided written consent. Participants were considered eligible when experiencing CNLBP and aged between 25 and 80 years. Patients were not allowed to report leg pain of 7 or higher (on a maximum of 10) on a numeric rating scale (NRS), or to have any evidence of specific spinal pathology (e.g., hernia, spinal stenosis, spondylolisthesis, infection, spinal fracture, or malignancy). They were excluded in the following cases: (1) spinal surgery in the past 6 months, (2) diagnosed with chronic fatigue syndrome, fibromyalgia, or severe underlying comorbidities (neurological conditions, cardiovascular problems, or rheumatologic diseases), (3) pregnant or given birth in the preceding year, and (4) initiated a new low back pain treatment in the 6 weeks prior to study participation.
Outcome measuresDemographic dataDemographic data included age, sex, body mass index (BMI), and information on pain intensity measures and duration of complaints. An 11-point NRS was used for pain intensity measurements.40 Participants were instructed to provide a pain rating score for average pain during the last 24 h, maximum pain during the last 24 h, and MEP. Pain scores ranged from ‘‘no pain’’ (0) to ‘‘excruciating pain’’ (10).
Quantitative sensory testingPPTs (i.e., the least amount of pressure applied to evoke a pain response)41 were measured using a digital pressure algometer (Wagner Force Ten). Four bilateral areas were tested: (1) 2 cm lateral to the L3 spinous process, (2) 2 cm lateral to the L5 spinous process,3 (3) near the posterior superior iliac spines,42 and the plantar side of the second toe.43 TS was used to evaluate endogenous pain facilitation and started two minutes after PPT measurements. TS was induced through 10 pressure pulses with the hand-held algometer at the PPT intensity.44 Participants were instructed to rate their pain level according to a NRS at the first, fifth, and tenth pulse.44,45 TS was calculated by subtracting the pain rating provided in response to the 10th stimulation by the pain rating provided in response to the first stimulation.44 Low scores indicate normal TS, whereas high scores indicate minor efficacy of TS.46 CPM was used to evaluate the efficacy of the descending inhibitory modulation of pain. The cold-pressor task (0.7 ± 0.1 °C, VersaCool TM) was used as conditioning stimulus and pressure pain tolerance threshold at the second toe was used as the test stimulus.43 The water was recirculated to maintain temperature and avoid thermal barrier to be created. Pressure pain tolerance threshold was defined as the point at which the participant felt the pain as intolerable. They were instructed to say ‘‘stop’’ when this point was reached43 and the number on the digital pressure algometer was noted. Participants needed to put their hand, up to the wrist, in the water for a maximum of two minutes. Pressure pain tolerance threshold was assessed once before and immediately after the cold pressor task.47 CPM was calculated by subtracting pressure pain tolerance score after the cold-pressor task by the scores before the cold-pressor task.47 CPM was coded as numerical data. Negative values indicate impaired endogenous pain inhibition.41
Movement-evoked painPrior to measuring MEP, pain at rest was assessed. Participants were to lay or sit in a comfortable position and needed to rate their pain after keeping this position for five minutes. MEP intensity was measured in response to two physical tasks: the Back Performance Scale (BPS)48,49 and a 5-minute walk test (5MWT).50,51 The BPS consists of five functional tasks (i.e., sock test, pick up test, roll-up test, finger to floor test, and lift test). Participants rated their level of ‘‘peak pain’’ during each task. Peak pain scores of the most painful movement task and MEP index scores for both 5MWT and BPS were collected and used for analyses.
Central sensitization inventoryThe CSI is a self-reported tool to identify key symptoms that are associated with CS.52 It contains a ‘‘part A’’ of 25 statements related to current health symptoms, indicative of CS (scored on a five-point Likert scale ranging from 0 to 4). The CSI has excellent measurement properties.21
ProcedureClinical indices of sensory hypersensitivity were assessed in all participants (i.e., PPT, TS, and CPM) after providing informed consent and health-related demographic data. Afterward, the participants completed the BPS and the 5MWT to measure MEP. Finally, participants completed the CSI. These measurements were repeated after a four-week period of HeatTens therapy in the experimental group and no treatment in the control group.38
Statistical analysisAll data were analyzed using IMB SPSS Statistics 29. Means and standard deviations for demographic characteristics were calculated using descriptive statistics. A correlation analysis was conducted to determine whether MEP (index) scores were significantly related to measures of CS (i.e., PPT, TS, CPM, and the CSI). We interpreted 0.10 as a weak correlation, 0.30 as moderate, and 0.50 as a strong correlation.53 In addition, a second correlation analysis was conducted to explore whether improvements in MEP (index) scores were associated with improvements in measures of CS. A backward regression analysis was conducted to identify possible predictors of MEP (index) measures and improvements in MEP (index) measures. Variables that demonstrated a significant correlation with MEP (index) measures or their improvements were initially considered for entry into the primary model. During the stepwise procedure, variables were removed from the model if their associated p-value exceeded 0.10. Given that at least 15 participants per predictor parameter are required,54 no more than 4 predictors were entered in the model for a sample size of 50 participants.
Groups based on CPMCPM is used – along with PPT and TS - to identify CS. Exploring whether CPM is related to MEP, and thus whether patients with negative CPM values experience more MEP, may help identify the underlying processes and mechanisms of MEP. Participants were divided in two groups based on CPM scores. Positive values indicated normal endogenous pain inhibition, while negative values indicated dysfunctional endogenous pain inhibition.41 MEP scores were compared between both CPM groups.
Groups based on CSI scoresComparable procedures were used to create different groups based on CSI scores, with a total score of 40 as cut-off value for CS.31,55 In addition to this general and conventional classification, participants were divided into three groups based on the study of Cuesta-Vargas et al.56 These CSI groups are suggested to be an accurate method for determining CS-related symptom severity levels and add to the ability of clinicians and researchers to interpret CSI scores. Three clusters were labeled as follows: (i) low level of CS-related symptom severity, (ii) medium level of CS-related symptom severity, and (iii) high level of CS-related symptom severity.
To determine differences between groups based on CPM and the conventional CSI classification (i.e., 40 cut-off value), Mann-Whitney U tests were performed. To identify differences between groups based on the CSI three-cluster distribution, a Kruskal-Wallis test was used.
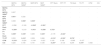
ResultsA total of 50 participants with CNLBP were included in the study. Patient demographic data are shown in Table 1. Strong associations could be observed between MEP index scores and their corresponding peak pain scores (BPS: 0.601 (p < 0.001); 5MWT: 0.666 (p < 0.001)) and weak to moderate associations with TS scores in the lower back region (BPS: 0.299 (p = 0.041); 5MWT: 0.345 (p < 0.018), Table 2). Further, peak MEP scores were weakly and negatively associated with PPT scores of the lower back (BPS: −0.384 (p = 0.008); 5MWT: −0.381 (p = 0.008)) and moderately and negatively associated with PPT scores of the second plantar toe (BPS: −0.431 (p = 0.002); 5MWT: 0.506 (p < 0.001), Table 2).
Demographic data for people with chronic nonspecific low back pain (n = 50).
BMI, body mass index; NRS, numeric rating scale.
Pearson correlation matrix in people with chronic nonspecific low back pain (n = 50).
5MWT, 5 Min Walk Test; BMI, body mass index; BPS, Back Performance Scale; CPM, conditioned pain modulation; CSI, central sensitization inventory; MEP, movement-evoked pain; MEP (I), movement-evoked pain index; PPT, pressure point threshold; PT, 2nd plantar toe; TS, temporal summation *p-value < 0.05.
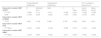
Backward regression analysis revealed that PTT at the plantar toe and CPM predicted 19.7 % of the variance in MEP index scores on the BPS in patients with CNLBP (F(2,47)=5.751 (p = 0.006)). 13.6 % of the variance in MEP index scores on the 5MWT was predicted by TS scores for the plantar toe (F(1,48)=7.539 (p = 0.008)). Furthermore, 12.2 % and 10.8 % of the variance in MEP peak scores for the BPS and 5MWT, respectively, was predicted by PTT scores in the lower back (BPS: F(1,48)=6.667 (p = 0.013) and 5MWT: F(1,48)=5.815 (p = 0.020)) in patients with CNLBP. Table 3 shows a summary of these findings.
Backward stepwise linear regression for predictors of MEP measures in people with chronic nonspecific low back pain (n = 50).
5MWT, 5 Min Walk Test; BPS, Back Performance Scale; CPM, conditioned pain modulation; MEP, movement-evoked pain; MEP (I), movement-evoked pain index; PT, 2nd plantar toe; TS, temporal summation *p-value < 0.05.
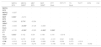
Concerning the analysis investigating pre- to post-intervention changes (observed in the randomized controlled trial that examined the impact of transcutaneous electrical nerve stimulation after 4 weeks of follow-up36), improvements in MEP index scores during the BPS were moderately associated with improvements in TS scores at the lower back region (BPS: 0.302 (p = 0.041)) and improvements in the MEP index scores during the 5MWT were moderately and negatively associated with PTT scores in the lower back (5MWT: −0.356 (p = 0.015)) and the plantar toe (5MWT: −0.383 (p = 0.09); Table 4).
Pearson correlation matrix of pre- to post-intervention changes∇ in people with chronic nonspecific low back pain (n = 46).
∇ this study is a secondary analysis from a RCT investigating the effects of transcutaneous electrical nerve stimulations after 4 weeks follow-up.
5MWT, 5 Min Walk Test; BPS, Back Performance Scale; CPM, conditioned pain modulation; CSI, central sensitization inventory; MEP, movement-evoked pain; MEP (I), movement-evoked pain index; PPT, pressure point threshold; PT, 2nd plantar toe; RCT, randomized controlled trial; TS, temporal summation*p-value < 0.05.
Backward regression analysis revealed that improvements in MEP index and peak scores for the BPS were not predicted by CS related outcomes (p > 0.05). 14.6 % and 21.3 % of the variance in MEP index and peak scores on the 5MWT respectively, was predicted by PTT scores at the plantar toe (MEP (I) 5MWT: F(1,44)=7.546 (p = 0.009) and MEP 5MWT: F(1,44)=11.940 (p = 0.001)). Table 5 shows a summary of these findings.
Backward stepwise linear regression for predictors of MEP pre- to post-intervention changes in people with chronic non-specific low back pain (n = 46).
5MWT, 5 Min Walk Test; MEP, movement-evoked pain; MEP (I), movement-evoked pain index; PPT, pressure point threshold; PT, 2nd plantar toe; TS, temporal summation; *p-value < 0.05.
Although MEP index scores were related to TS measures, no significant differences could be observed between subgroups within the CNLBP sample based on either CPM or CSI scores (p > 0.05, Supplementary material, Tables 1–3). Nevertheless, the results do suggest that higher MEP (index) scores are associated with measures of CS in patients with CNLBP: dysfunctional CPM is seen with higher MEP scores (Supplementary material, Table 1), and MEP scores increase as scores on the CSI are enhanced (Supplementary material, Tables 2 and 3, Fig. 1).
DiscussionThis study investigated associations between MEP (index) scores and measures of CS (i.e., PPT, TS, CPM, and the CSI) in patients with CNLBP using data from a randomized controlled trial.38 At baseline, a Pearson's correlation matrix (Table 2) revealed significant associations between MEP index scores and TS measures in the lower back region. Table 3 shows that 19.7 % of the variance of MEP index scores for the BPS can be predicted by PTT measures in the plantar toe and CPM, and that 13.6 % of the variance of MEP index scores for the 5MWT can be predicted by TS scores in the plantar toe. Additionally, Table 4 indicates that improved MEP index scores for the BPS were associated with improved TS scores in the lower back region and improved MEP index scores for the 5 MWT were associated with improved PTT scores. Additionally, 14.6 % and 21.3 % of the variance in MEP index and peak scores on the 5MWT respectively, was predicted by PTT scores at the plantar toe (Table 5). These findings add evidence to the notion that MEP index scores are related to processes related to central modulation of pain, not only in knee osteoarthritis18,33 and musculoskeletal pain34 but also in patients with CNLBP.
Based on the CSI scores, 2 between-groups analyses were performed. First, the Mann-Whitney U test determined differences between groups based on the conventional classification: a cut-off score of 40 has been recommended for alerting healthcare providers that a patient's symptoms might be related to CS31,57 (Supplementary material, Table 2). Second, we examined whether between-groups differences were present based on the CSI Symptom Severity subgroups (Supplementary material, Table 3). With this new classification, Cuesta-Vargas et al.56 aimed to provide additional help to the clinical interpretation of CSI scores. After all, CS is a continuum of altered nociceptive processing mechanism with more profound central nervous system changes resulting into a greater number and severity of CS-related symptoms.56 Furthermore, the CSI is not a tool to diagnose CS but rather to evaluate symptoms related to CS.21 It is, therefore, possible that CS symptoms, or even MEP scores, were insufficiently severe to allow associations or between-group differences to be identified in this group of patients with CNLBP. In two studies,58,59 participants with knee osteoarthritis were divided by the intensity of MEP, using cut-off scores based on average pain intensity scores and the interference items from the Brief Pain Inventory.60 The first group (i.e., the mild pain group) reported MEP scores between 0 and 7, the moderate pain group scores between 7 and 14, and the third (i.e., severe pain) group reported scores greater than 14 on the 0–20 NRS. If Hadlandsmyth's et al.58 reasoning is followed, and the data of the current study are classified similarly, yet based on cut-off scores for low back pain (i.e., 1 to 5 is mild pain, >5 to 8 is moderate pain, and >8 to 10 is severe pain, based on the Brief Pain Inventory average pain scale),61 48 % of the participants would belong to the mild group, 48 % to the moderate group, and only 4 % to the severe group based on their BPS scores. The classification based on the 5MWT is even more remarkable: 80 % of the participants would be assigned to the mild group, 18 % to the moderate group, and 2 % to the severe group. The lack of participants with increased levels of MEP may explain why no significant results were found.
It is possible that these findings have important implications for clinicians in clinical practice, considering MEP index measurements better capture the way sensitization impacts a patient's activity-related symptoms than quantitative sensory testing.34 According to these data, we can infer that elevated MEP index scores should be an indication for modified therapy, compared with patients who suffer from MEP but do not show elevated MEP index scores. Previous research has shown that exercise therapy effectively reduces MEP in patients with musculoskeletal pain.62-67 A proposed clinical guideline68 suggests that, when CS is suspected or identified, (pain) clinicians should offer an individually tailored multimodal treatment plan for optimal treatment outcomes. The conservative treatment modalities best considered are pain neuroscience education, cognition-targeted exercise therapy, sleep and stress management, and behavioral graded activity.68,69 It seems reasonable that MEP should also be addressed differently when centrally sensitized processes are suspected to be involved. Indeed, these observations may support the hypothesis that patients experiencing pain scores of 1 and 7 during respectively rest and movement, should possibly be approached differently than patients with respective pain scores of 6 and 7. For although they report identical maximal MEP scores, the MEP index scores are very different, suggesting other mechanisms involved in their individual pain experience.
Strengths and limitationsStudy strengths include the wide variety of measures used for assessing patient reported as well as psychophysiological aspects of CS, the a priori trial registration, the prospective longitudinal study design, and blinded nature of the outcome assessments. This study also contains some limitations that should be taken into account. A limitation of our study is the sample size. This study is a secondary analysis of a randomized controlled trial38 and might be insufficiently powered to detect group differences based on CSI scores. Because the minimal important difference for MEP index scores is currently unknown, we must look to other studies that have examined differences between groups based on MEP index scores. Finally, this study does not consider the possible influence of medication use on CS. Participants had to record medication use (i.e., analgesics and non-steroidal anti-inflammatory drugs). Although it is stated that this "bottom-up" oriented treatment method has little to no effect on the course of CS,68 this seems an interesting angle worth exploring.
Despite these limitations, our findings are helpful in advancing the scientific literature, but also clinical implications, in the field of MEP. Further research is needed to gain more insight into possibly different treatment approaches of patients experiencing MEP with and without elevated index scores, and these exploratory suggestions for treatment need to be validated by a randomized controlled trial, designed specifically for this purpose. An exciting avenue would be to determine the most ideal (multimodal) treatment plan for patients with MEP with elevated MEP index values and investigate whether this intervention similarly affects patients with MEP without elevated index values.
ConclusionThis study investigated the relation between measures of CS and MEP in patients with CNLBP. Measures of CS, specifically PTT and TS, demonstrated predictive associations with MEP (index) measures. In response to treatment, improvements in MEP were associated with improvements in measures of CS (i.e., PTT and TS) and improved PTTs in the plantar toe significantly predict MEP (index) measures experienced during the 5MWT. Future research is needed to determine the optimal treatment for patients suffering from MEP with and without elevated MEP index scores.
We thank the University hospital of Brussels, the Department of Physical Medicine and Rehabilitation, and the Frailty in Ageing research department of the Vrije Universiteit Brussel for the use of their infrastructure. This work was supported by the Wetenschappelijk Fonds Willy Gepts of the University hospital of Brussels.


