


Handheld dynamometers (HHD) provide quick and low-cost assessments of muscle strength and their use has been increasing in clinical practice. There is no available data related to the validity of HHD for this measurement.
ObjectiveTo verify the concurrent validity of scapular protraction measurements using an HHD.
MethodsIndividuals with traumatic anterior glenohumeral instability were allocated in Instability Group (n=20), healthy swimmers were allocated in Athletes Group (n=19) and healthy subjects were allocated in Sedentary Group (n=21). Concurrent validity was verified by the Pearson correlation test between HHD and isokinetic measurements. The agreement between instruments was verified by Bland–Altman plots, for each of the two HHD positions.
ResultsA moderate correlation was observed between seated (r=0.59) and lying supine HHD (r=0.54) and isokinetic dynamometer measurements for the all groups. Separated group analysis exhibited a strong correlation between seated HHD and isokinetic dynamometer measurements in the Instability Group (r=0.80), Sedentary Group (r=0.79) and Athletes Group (r=0.76). The Bland–Altman plot showed greater agreement in the seated position than the lying supine position when comparing measurements with the HHD and isokinetic in both the general sample and separated groups.
ConclusionThe HHD may be considered a valid tool for assessing scapular protraction muscle strength among healthy athletes, non-athletes and subjects with shoulder instability. We recommend to assess subjects in the seated position and to be aware that the HHD tends to overestimate the peak force, compared with the gold-standard isokinetic dynamometer.
The shoulder is considered an unstable joint due to its anatomical features associated with a wide range of motion.1,2 Glenohumeral joint stability is provided mainly by the rotator cuff force couples, associated with scapular muscle balance to provide a stable basis for their action.3,4 Besides their importance for shoulder stability, strength of the scapular protractor muscles (serratus anterior, pectoralis major and minor) is also essential for daily living activities and sports performance.4,5 These muscles are continuously recruited in swimming, assisting the proper scapular movement during the swimming stroke.6,7
Furthermore, it has been demonstrated that athletes with shoulder pain and anterior instability present lower strength of scapular protraction compared to healthy athletes.8 Therefore, objective assessment of scapular protraction strength is an important component of physical examination, for detecting deficits and providing information for planning and following the progress of shoulder rehabilitation and injury prevention programs.9,10 The handheld dynamometer (HHD) allows identification of small changes in muscle strength.11–13 The use of HHD has been increasing in clinical practice, since it is portable and provides quick and low-cost assessment, in comparison to isokinetic dynamometry, which is considered the gold-standard for muscle strength assessment.14,15
The validity and reliability of HHD muscle strength measurements have been reported for several upper limb muscle groups.14–16 Stark et al.14 performed a systematic review of HHD studies and the validity of the HHD was verified for shoulder flexion, extension, internal and external rotation, abduction, adduction, and elbow flexion/extension. However, there is a lack of studies assessing the measurement validity of scapular muscle strength. To the best of our knowledge, only one study has investigated the validity of HHD to assess the strength of scapular protractor muscles and identified lack of construct validity with serratus anterior activation using surface electromyography.16
Considering the importance of a valid measurement of scapular protraction strength in the clinical environment, the aim of this study was to investigate concurrent validity between HHD and isokinetic dynamometer measurements for scapular protractor muscles between three different populations: healthy swimmers, sedentary subjects and subjects with anterior shoulder instability.
MethodsParticipantsA convenience sample composed of men and women with anterior shoulder instability (Instability Group, n=20), healthy swimmers (Athletes Group, n=19), and healthy sedentary subjects (Sedentary Group, n=21) were invited to participate on this cross-sectional study. The groups were homogenous regarding age, height, weight, body mass index. Anthropometric data and peak of strength are presented in Table 1. This study was conducted at the Universidade Federal de São Carlos (UFSCar), São Carlos, SP, Brazil according to the Helsinki Declaration and was approved by a Local Ethics Committee in Human Research (Process number: 186.596). All participants provided a signed consent form prior to data collection.
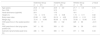
Sample demographics, anthropometric and isometric muscle strength assessment data.
| Sedentary Group (n=21) | Instability Group (n=20) | Athletes Group (n=19) | p-Value | |
|---|---|---|---|---|
| Age (years) | 24.8±5.0 | 23.9±4.9 | 21.7±4.9 | 0.15 |
| Sex (F/M) | 6/15 | 5/15 | 8/11 | – |
| Hand-dominance (right/left) | 20/1 | 17/3 | 18/1 | – |
| Height (m) | 1.73±0.10 | 1.75±0.08 | 1.74±0.11 | 0.82 |
| Body mass index | 23.96±3.90 | 26.16±4.20 | 23.09±2.10 | 0.20 |
| Weight (kg) | 72.41±16.90 | 80.09±15.70 | 70.58±10.06 | 0.10 |
| HHD peak force in the seated position (N) | 343±71 | 306±132 | 425±86 | <0.01 |
| HHD peak force in the lying supine position (N) | 347±62 | 309±63 | 384±56 | <0.01 |
| Isokinetic dynamometer peak force (N) | 438±161 | 306±73 | 371±158 | 0.34 |
Data are presented as mean±standard deviation, except for sex and hand dominance, which are presented as absolute numbers.
Individuals with instability were included if they had a diagnosis of traumatic anterior shoulder instability given by a specialized-board Orthopedic physician and had not received physical therapy treatment within the 6 months prior to this study. Swimmers were included if they had no history of upper limb injuries, had been training at a competitive level for at least a year, at a frequency of three to five times a week, with a training volume greater than twenty kilometers a week.7,17 The inclusion criteria for sedentary participants were no involvement in physical activities related to the upper limbs and no history of upper limb injuries. Exclusion criteria for all subjects were atraumatic instability, inferior or posterior traumatic instability, generalized laxity, a history of shoulder surgery, or previous use of corticosteroid injections.
Seventy-seven individuals were recruited in this study and seventeen were enrolled after been screened for inclusion. Ten individuals were excluded for presenting another type of glenohumeral instability, four subjects presented positive shoulder provocative tests, two had received physical therapy treatment or a shoulder injection within the previous 6 months, and one had undergone shoulder surgery.
ProceduresEach subject performed all the tests on the same day and were assessed by the same examiner (i.e. a physical therapist with experience in these assessments). Protractor muscle maximal isometric strength was measured using an HHD (Lafayette Instrument, Lafayette, IN) and an isokinetic dynamometer (Biodex System 3, Computer Sports Medicine Inc., Stoughton, MA). While the dominant side was assessed in healthy subjects, the affected side was assessed in subjects with shoulder instability. Before the strength assessment, participants performed a standardized warm-up with 10 repetitions on the following movements: arm circumduction, and shoulder flexion, extension, abduction, and adduction. Three submaximal familiarization trials were performed with the isokinetic dynamometer and HHD prior to maximal tests in each condition assessed.18
HHD evaluationThe protraction strength assessments were performed in two different positions: seated19–21 and lying supine,16,22,23 in a random order. In the seated position, the participant was instructed to sit on a stool, 60cm high with no back support, keeping their feet on the floor and knees at 90° of flexion. The back and head were supported on a wall and the contralateral arm was positioned on the leg (Fig. 1A). In the lying supine position, the participants were instructed to lie on a mattress with the knees at 90° of flexion (Fig. 1B). In both positions, the assessed shoulder was positioned at 90° of flexion, full elbow extension, and neutral forearm.24
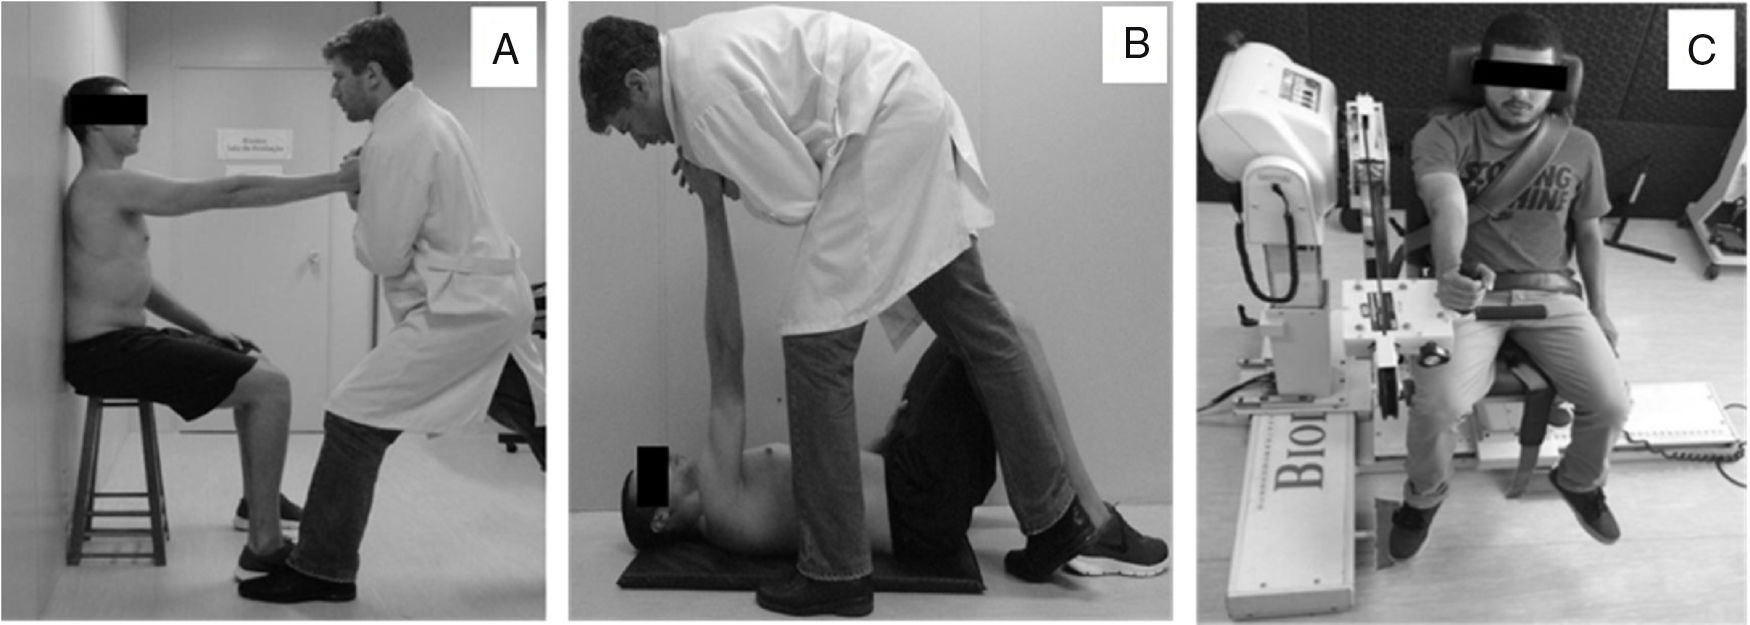
During the assessments, the examiner provided manual resistance by holding the HHD between their trunk and the palmar face of the participant's hand. The test position was set as the midpoint between maximal scapular protraction and retraction, which was determined by the examiner. First, the examiner moved the arm of the participant through the maximal range of motion of protraction and retraction and then oriented the subject to maintain the arm approximately in the middle point of the range. Participants were asked to provide maximal strength like punching against the dynamometer after the evaluator's verbal command.
Isokinetic dynamometer evaluationFor the tests using the isokinetic dynamometer, participants were seated with the trunk and waist fixed by non-elastic belts. The assessment was performed with the shoulder at 90° of flexion, full elbow extension, and neutral forearm position, using the closed kinetic chain device of the isokinetic dynamometer (Fig. 1C). The dynamometer axis was aligned to the estimated glenohumeral joint center and fixed at zero degrees. Initially, maximal protraction and retraction ranges of motion were measured in this position, using the Biodex system. The mean position between maximum protraction and retraction was set as the strength test position. For maximal test performance, subjects were oriented to hold the handgrip of the device and push like punching with maximal strength.
For each test position, subjects performed three maximal isometric contractions of 5s each, with a 30-s interval between them. All participants rested for a period of 30-min between each position of HHD and between the instruments. The three groups were evaluated in three different days. The peak force of each trial was recorded in Newton (N).
Statistical analysisSample size calculation was performed a posteriori using the correlation test to determine the statistical power for the number of individuals in each group. In all comparisons between the HHD and isokinetic, effect sizes greater than 0.7 were verified, resulting in a statistical power of at least 80%. All anthropometric data, isometric peak force recorded with the HHD and with the isokinetic dynamometer were found to present normal distribution in the Shapiro–Wilk test for all three groups. Participants age, body mass, BMI and height were compared between groups using one-way ANOVAs. The mean of the three repetitions of HHD and isokinetic dynamometer was registered and normalized by the participant's body mass.
The correlations between HHD and isokinetic dynamometer strength measures were calculated using Pearson's correlation estimates. The correlations between HHD and isokinetic strength measures were calculated using Pearson's correlation estimates. Results were interpreted as follows: values less than 0.3 meaning weak correlation; 0.3–0.7, moderate correlation; and more than, 0.7 strong correlation.25
In addition, linear regression coefficient (r2) was calculated to determine if a variation in the results of the tested instrument (HHD) could be explained by the variation in the gold standard (isokinetic dynamometer).
Bland–Altman plots were generated for each of the two HHD positions contrasted with the isokinetic dynamometer in order to assess agreement between both instruments. Limits of agreement were calculated as well as the linear regression coefficient (r2) and their respective bias in relation to the maximum agreement. The analysis was conducted using – SPSS version 21 and Microsoft Excel and the significance level was set at 5% for all the tests.
ResultsValidationA moderate correlation was observed between HHD measurements in the seated (r=0.59) and lying supine (r=0.54) positions compared to the isokinetic dynamometer for all individuals. Moreover, a strong correlation was observed between the HHD and isokinetic dynamometer in the seated position in the Sedentary Group (r=0.79), Instability Group (r=0.80), and Athletes Group (r=0.76). All these correlations were significant (p<0.001) (Table 2).
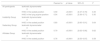
Pearson correlation and linear regression between handheld dynamometer (HHD) and isokinetic dynamometer measurements.
| Pearson's r | p-Value | 95% CI | r2 | ||
|---|---|---|---|---|---|
| All participants | Isokinetic dynamometer | ||||
| X | |||||
| HHD in the seated position | 0.59 | <0.0001 | [0.47–0.70] | 0.35 | |
| HHD in the lying supine position | 0.54 | <0.0001 | [0.36–0.71] | 0.30 | |
| Instability Group | Isokinetic dynamometer | ||||
| X | |||||
| HHD in the seated position | 0.80 | <0.0001 | [0.60–0.91] | 0.64 | |
| Sedentary Group | Isokinetic dynamometer | ||||
| X | |||||
| HHD in the seated position | 0.79 | <0.0001 | [0.62–0.90] | 0.62 | |
| Athletes Group | Isokinetic dynamometer | ||||
| X | |||||
| HHD in the seated position | 0.76 | <0.0001 | [0.55–0.97] | 0.58 |
CI: confidence interval.
For all individuals, the limits of agreement (LoA) between the HHD and isokinetic dynamometer in the seated position had a range of 281.51N to −194.89N with a bias of 43.31N (95% CI: −0.18N to 86.60N, p>0.05) (Fig. 2A). The LoA between the HHD and isokinetic dynamometer in the lying supine position was between 303.96N and −196.01N with a statistically significant bias of 53.98N (95% CI: 8.34N to 99.62N, p<0.05) (Fig. 2B). Although almost all individuals are in the 95% limits of agreement range of the Bland–Altman plots, the CIs are considered very wide, indicating that the measures tended to disagree. Furthermore, the mean difference between HHD and isokinetic dynamometer were biased positively and statistically significant just in the lying position of the HHD, i.e., measurements were overestimated in HHD evaluation.
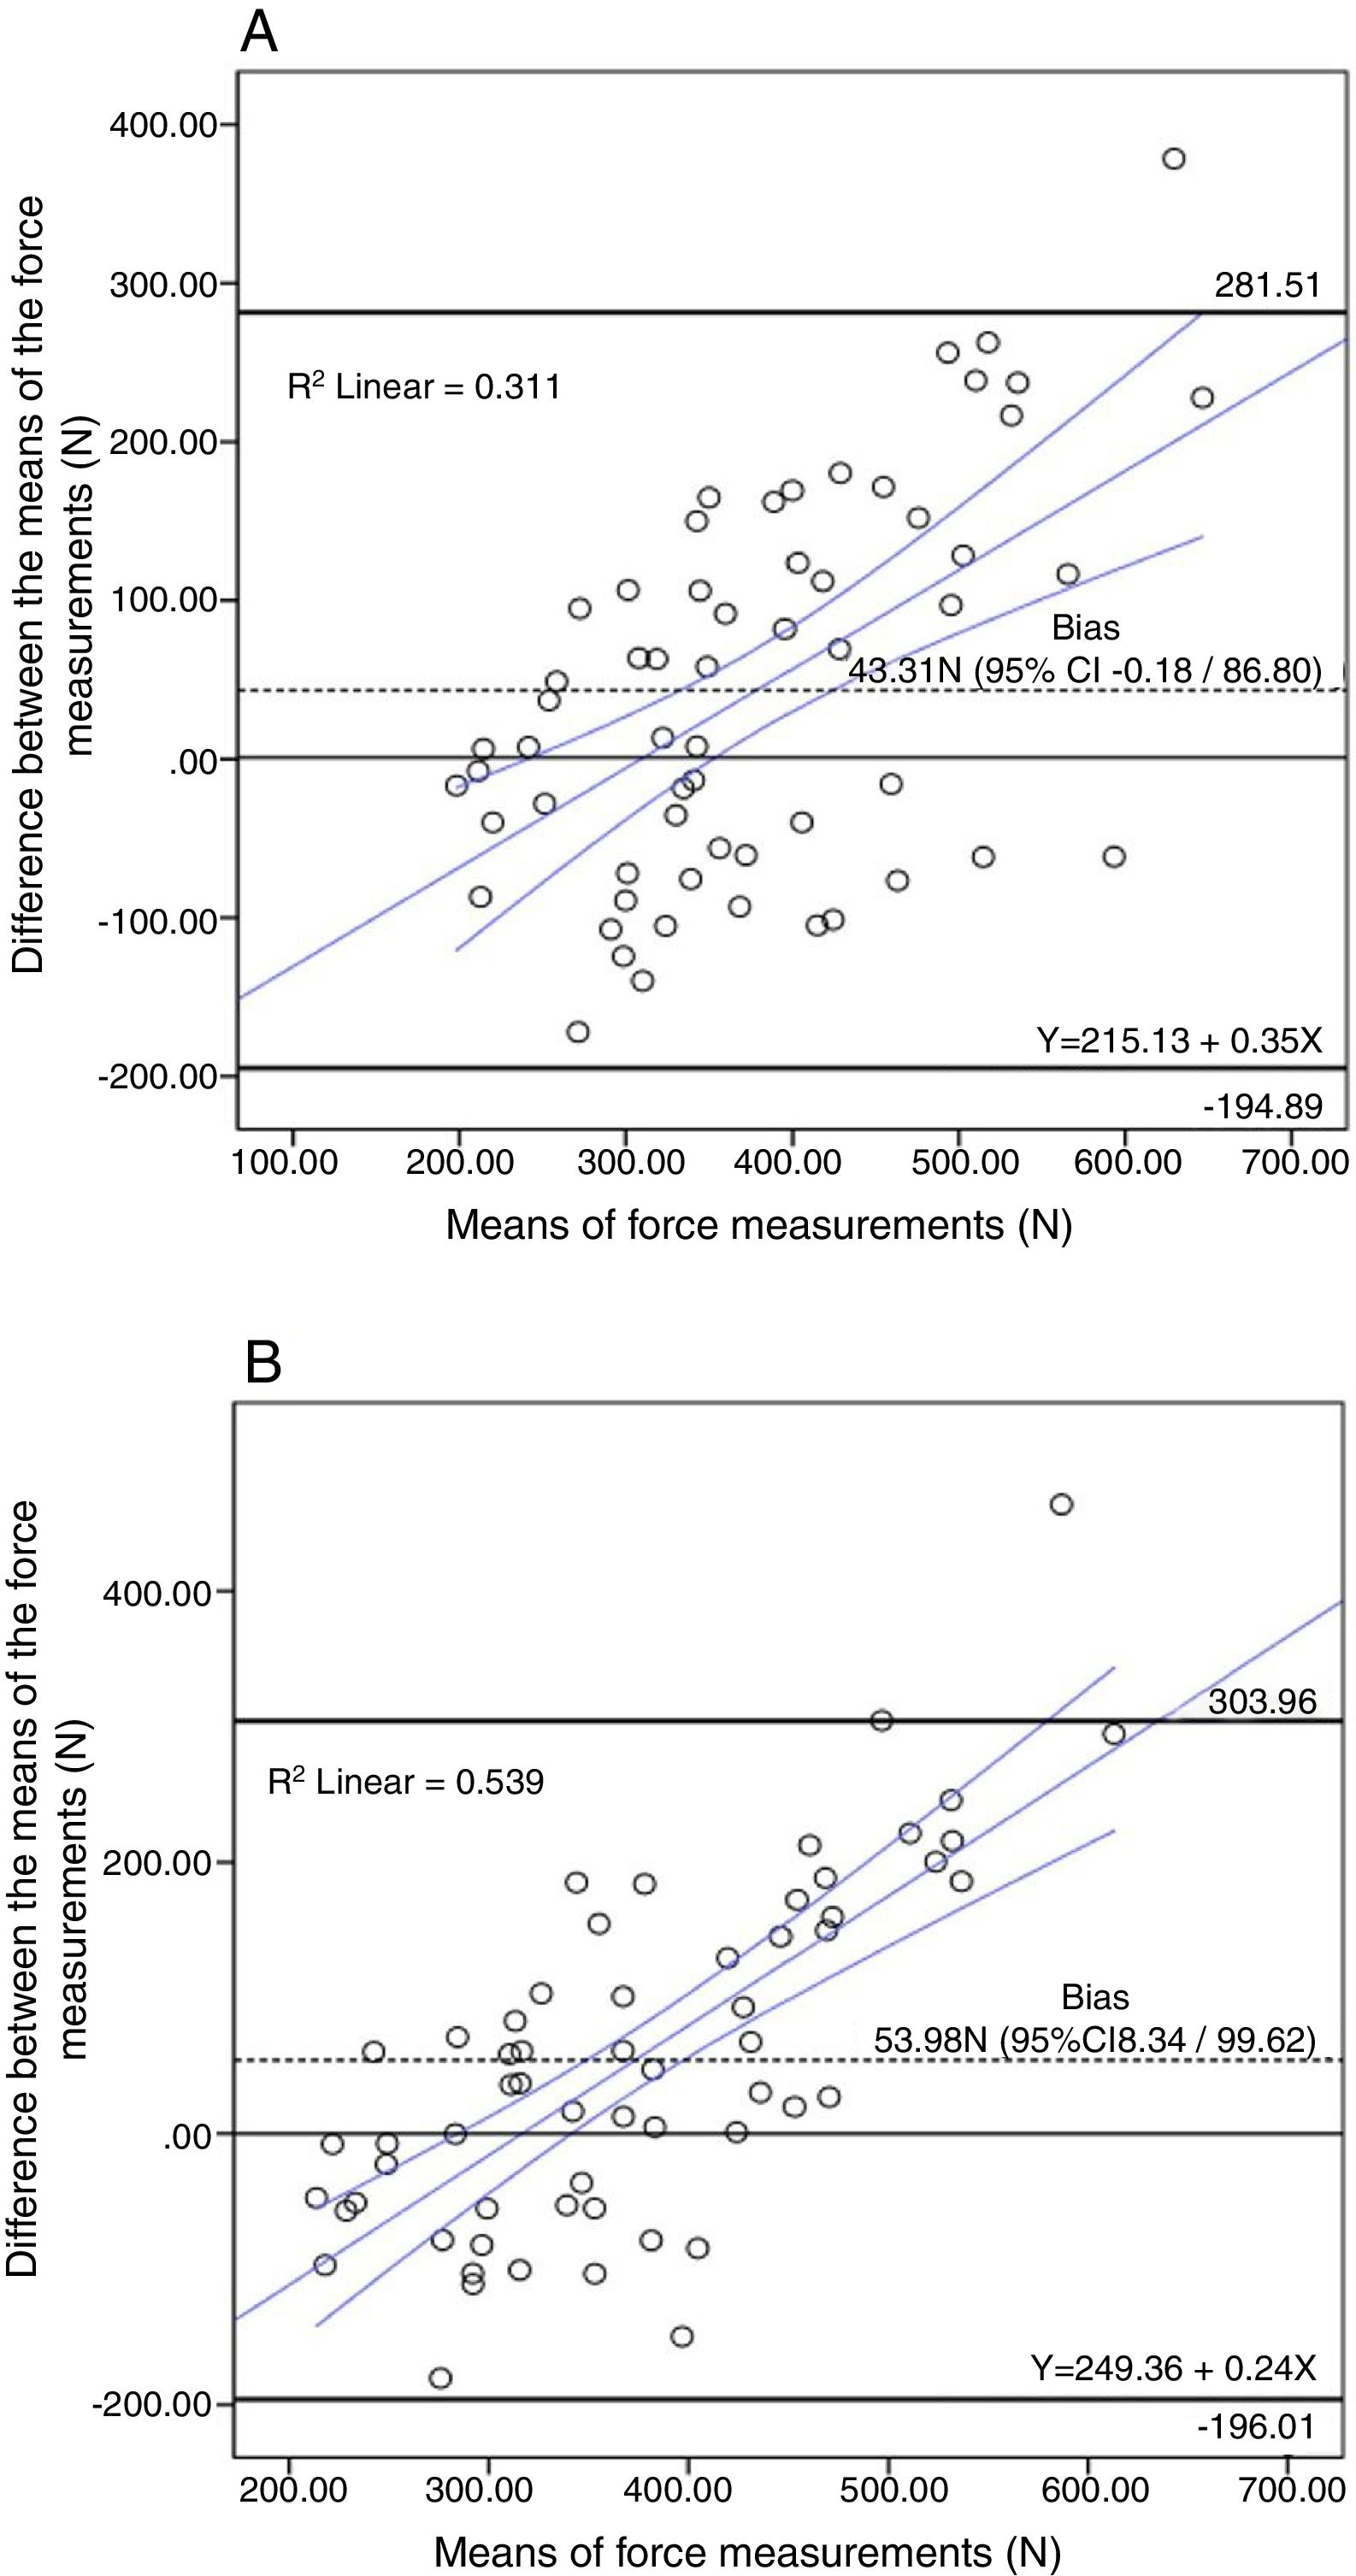
After the verification of lower agreement between the HHD and isokinetic dynamometer in the lying supine position in all groups together and considering that the sitting position is closest to the position adopted in the isokinetic assessment, we opted to include the results of Bland–Altman plots for each group only in the seated position of the HHD.
The LoA between the HHD in the seated position and isokinetic dynamometer for the Instability Group had a range of 249.25N to −86.22N with a bias of 81.51N (95% CI: 50.88N to 112.13N, p<0.05) (Fig. 3A). The LoA for the Athletes Group in the same position was between 155.88N and −264.43N with a bias of −54.27N (95% CI: −92.63N to −15.90N, p<0.05) (Fig. 3B). Finally, the LoA for the Sedentary Group was between 318.10N and −127.70N with a bias of 95.20N (95% CI: 54.51N to 135.89N, p<0.05) (Fig. 3C).
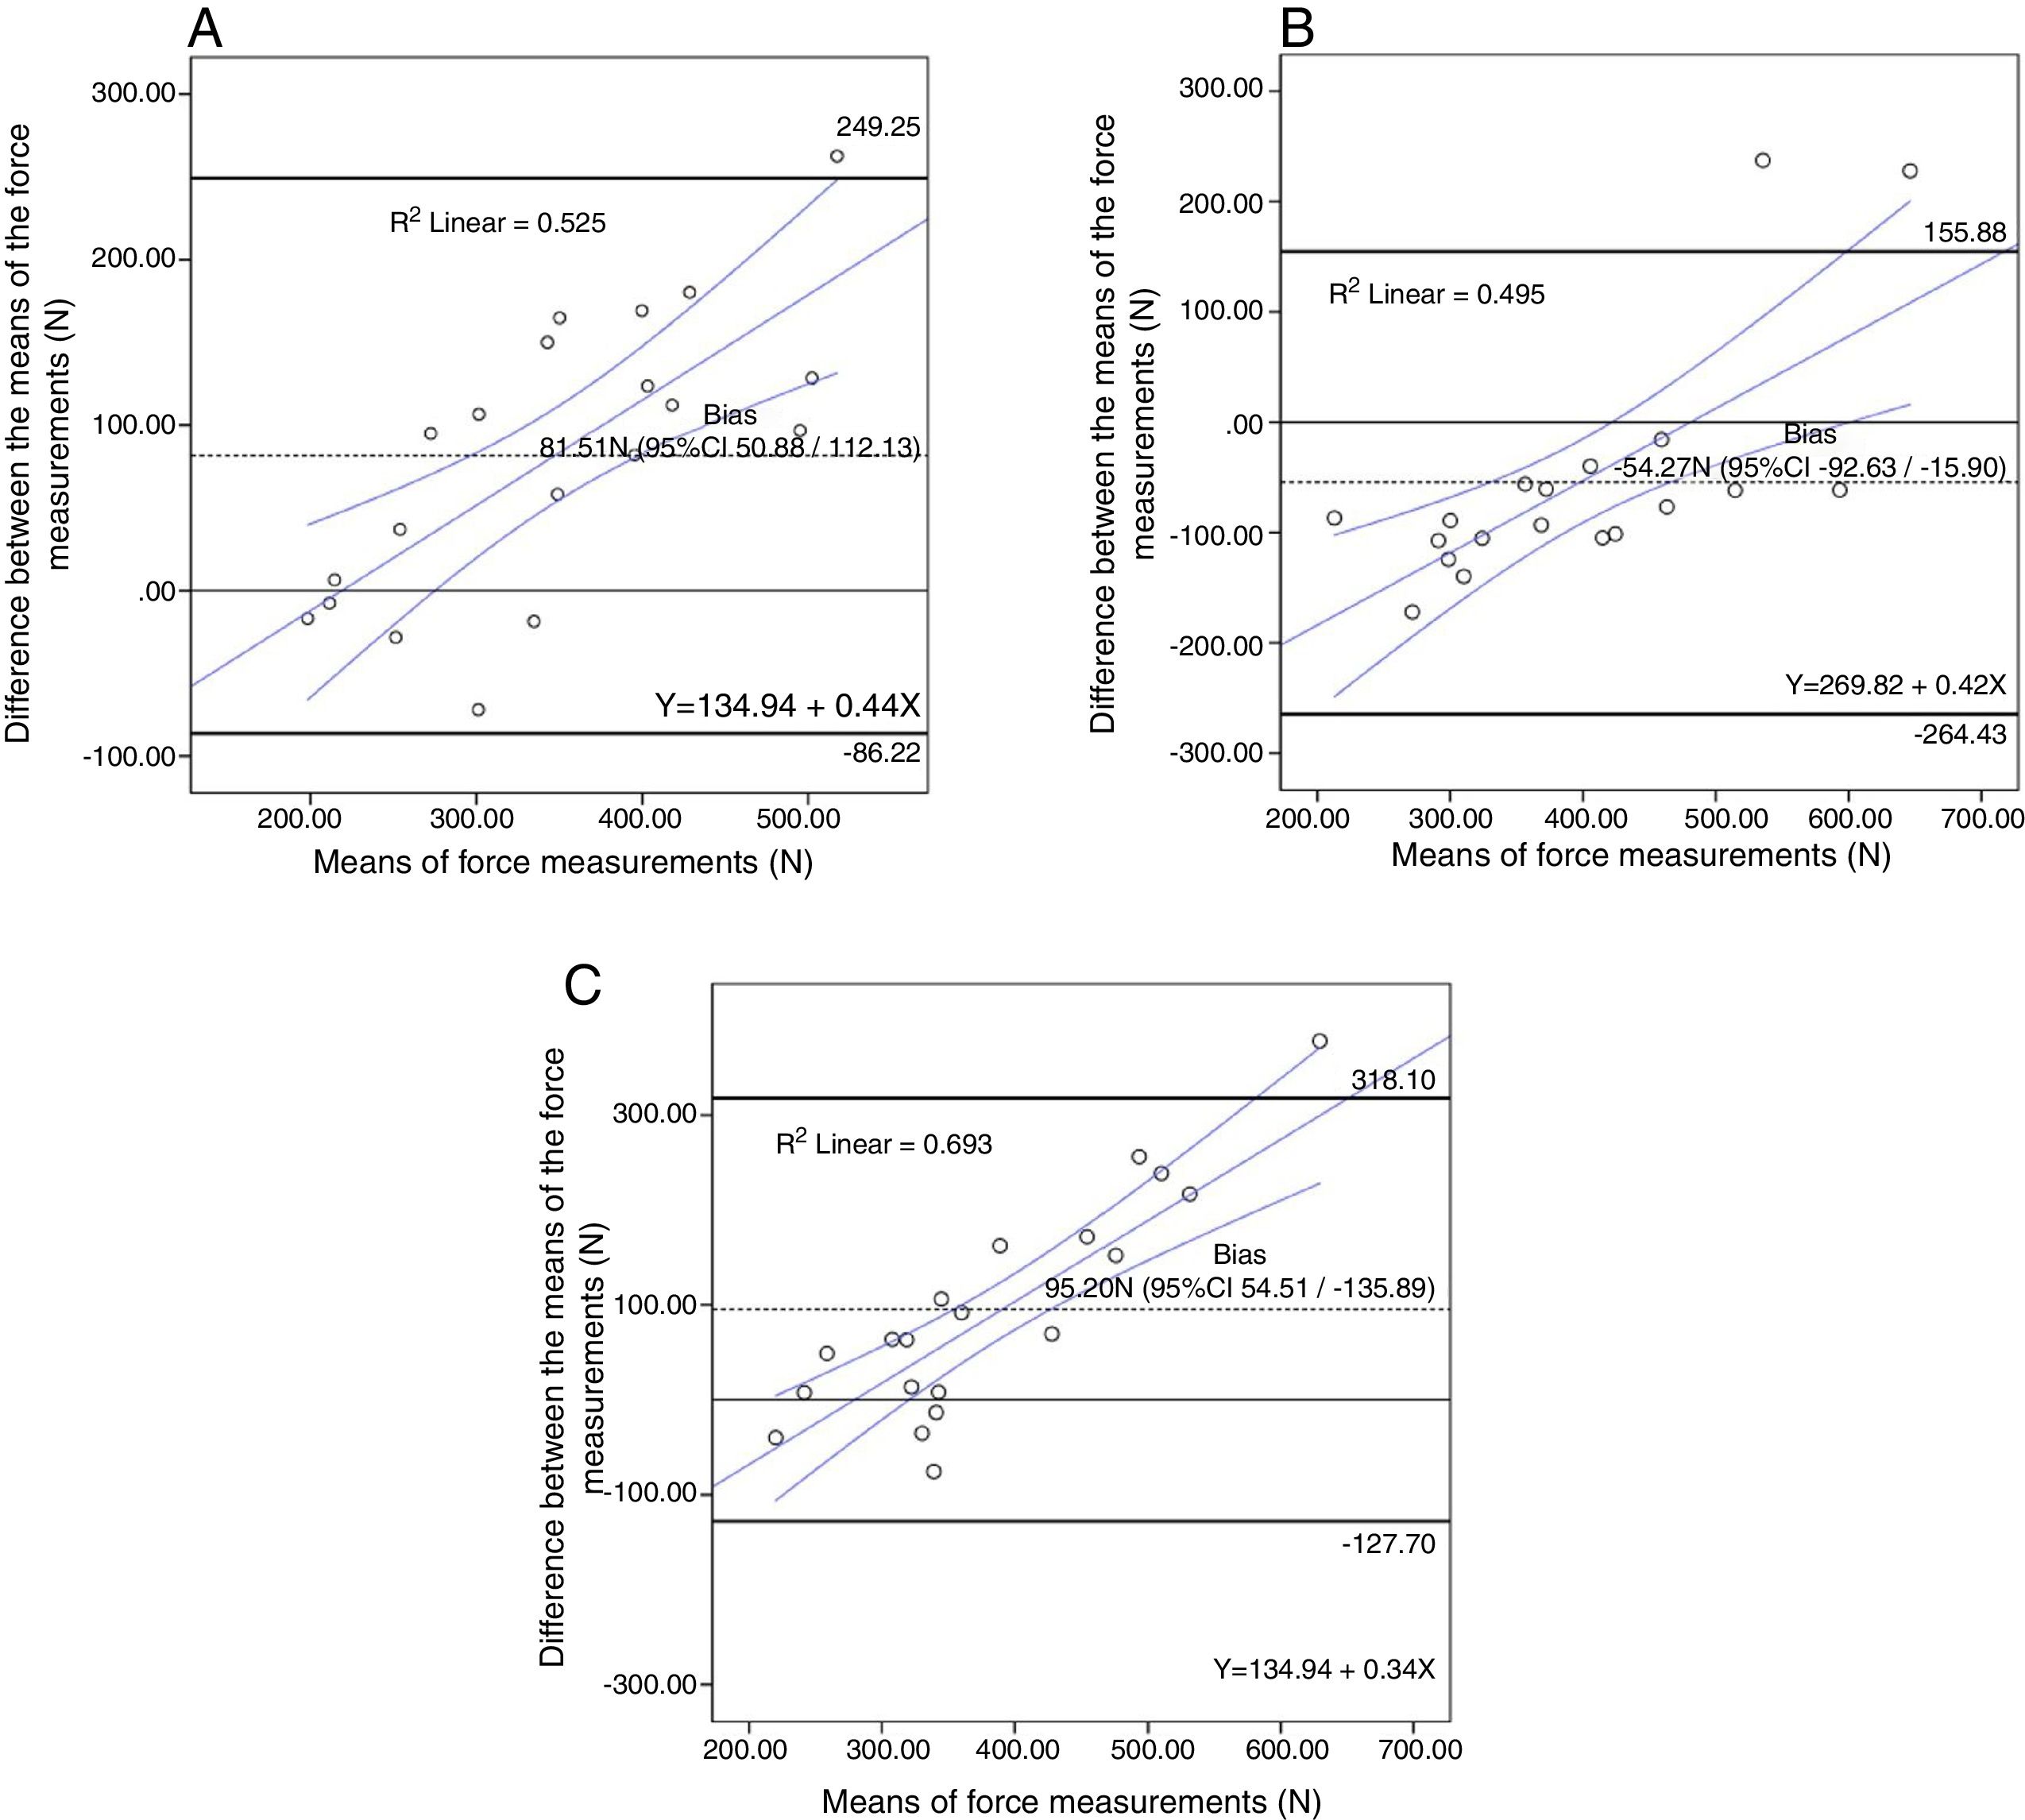
(A) Bland–Altman plot of the Instability Group measurements with the comparison between the isokinetic dynamometry versus Seated HHD. (B) Bland–Altman plot of the Athletes Group measurements with the comparison between the isokinetic dynamometry versus Seated HHD. (C) Bland–Altman plot of Sedentary Group measurements with comparison between the isokinetic dynamometry versus Seated HHD.
Almost all individuals are in the 95% limits of agreement range of the Bland–Altman plots of each study group, but the CIs are also considered very wide, indicating that the measures tended to disagree. The mean difference between HHD and isokinetic strength were biased positively (p<0.05) for the Instability and Sedentary groups, indicating that HHD measurements were higher compared to isokinetic dynamometer measurements. In the Athletes Group, the mean difference between HHD and isokinetic strength were negatively biased (p<0.05), indicating that HHD measurements were lower compared to isokinetic dynamometer measurements.
DiscussionThe main finding of this study was the strong correlation between scapular protraction peak force measurements using the HHD in the seated position and the isokinetic dynamometer for all groups assessed. However, the HHD tended to overestimate the peak force when compared to the isokinetic dynamometer.
A greater correlation between the HHD and the isokinetic dynamometer measurements in the seated position was expected, considering the similarity between test positions using both equipment. Although scapular protraction strength assessment with HHD has been frequently performed in lying supine position in previous studies16,21,23 and clinical practice, it is not possible to test in this position using the isokinetic dynamometer. Considering that this is the first study investigating concurrent validity of scapular protraction strength assessment, we have opted to include the lying supine position. The examiner's difficulty with resisting to the protraction movement with subjects lying supine may have contributed to the greater peak force overestimation at this position. Aiming to avoid this kind of measurement bias and to improve subject stabilization and movement resistance, some authors have advocated the use of fixed non-elastic straps instead of manual resistance in HHD tests.26–28 We have opted for using manual resistance in this study, since it is more frequently used in clinical practice.
Different ways for positioning the HHD have also been reported in the literature. Turner et al.19 have assessed subjects in the seated position and placed the HHD over the deltoid muscle insertion. The authors have reported difficulty with keeping the HHD stable during tests. Kang et al.23 positioned the HHD over the olecranon with the elbow flexed at 90°, with subjects in lying supine and seated positions. However, in our pilot tests, subjects reported discomfort when the HHD was positioned on the olecranon and the device stabilization during maximal tests was difficult. Therefore, we have chosen to position the HHD as reported by Cools et al.,29 on the ventral portion of the individual's hand, decreasing discomfort and increasing the dynamometer stability during the tests.
A previous study has investigated the construct validity of serratus anterior strength assessment using a HHD during scapular protraction testing and surface electromyography in subjects with shoulder pain.16 Participants were tested in the lying supine position, with the shoulder and the elbow at 90° of flexion, and the HHD was positioned on the olecranon. The measurements of peak force and muscle activation were not correlated, what was attributed to the difficulty with serratus anterior electromyographic recording and the fact that this is not the only muscle involved in scapular protraction. It is important to emphasize, however, that the association between electromyographic signal and muscle strength is still not clear and may not be directly related.30 In the present study, we investigated the concurrent validity using an isokinetic dynamometer, since it is the gold-standard for isometric muscle strength assessment.31
According to the results of this study, the HHD is a valid tool for scapular protraction strength assessment in healthy subjects, subjects with shoulder instability and in swimmers. We recommend to perform the tests with subjects in the seated position, with 90° of shoulder flexion, with the HHD secured by the examiner on the ventral surface of the subjects hand. However, although the correlation between the HHD and the isokinetic dynamometer was strong in this position, the agreement verified with the Bland–Altman plot analysis was low, suggesting the HHD should not replace the isokinetic dynamometer measurements.
Although scapular retraction strength assessment is also of great importance, but was not included in this study because there is no well-established method for its evaluation using the HHD in the literature. To the best of our knowledge, only one study has reported the use of HHD for assessing scapular retraction strength, by positioning the dynamometer in the posterior aspect of the scapula, with the subject lying prone.16 However, at this positioning, subjects have to push against the HHD while they need to pull the handle during tests using the isokinetic dynamometer. Therefore, we consider it would not be suitable to compare both equipments. Other studies have assessed isometric strength of scapular retraction using other kinds of dynamometers,26,27 which measure traction force, but these devices are not usual in the clinical setting. Further studies are necessary in order to improve the methods for assessing scapular retraction strength in clinical setting and their validity.
ConclusionThe HHD may be considered a valid tool for assessing scapular protraction muscle strength among healthy athletes, non-athletes and subjects with shoulder instability. We recommend to assess subjects in the seated position and to be aware that the HHD tends to overestimate the peak force, compared with the gold-standard isokinetic dynamometer.
Conflicts of interestThe authors declare no conflicts of interest.


