


Cost-utility analysis uses utility indexes to assess treatment effects. Some discrepancies between different utility indexes instruments are suggested and need to be identified in health conditions not yet investigated.
ObjectiveTo compare different utility indexes instruments in Brazilian patients with fibromyalgia and identify variables associated with these instruments.
MethodsImpact of fibromyalgia (Fibromyalgia Impact Questionnaire [FIQ]) and utility indexes (Short-Form 6 Dimensions [SF-6D], EuroQol 5 Dimensions [EQ-5D], and EuroQol - Visual Analogue Scale [EQ-VAS]) were assessed in 97 patients with fibromyalgia at baseline, 8-week (after an exercise-based intervention), and 6- and 12-month follow-up. Construct validity and responsiveness of the utility indexes instruments were compared. Multiple regression models were used to verify the variables associated with the utility indexes instruments.
ResultsConstruct validity analysis showed that FIQ presented moderate correlation with the SF-6D, the EQ-5D, and the EQ-VAS (r=-0.43, -0.41, -0.30, respectively, all p < .01). There was a moderate correlation between the SF-6D and the EQ-5D (r = 0.51, p < .001), moderate correlation between the SF-6D and the EQ-VAS (r = 0.41, p < .001), and no correlation between the EQ-VAS and the EQ-5D. The EQ-5D was responsive at the 8-week and 6-month follow-up, the SF-6D was responsive only at 6-month follow-up and the EQ-VAS was not responsive. The FIQ was associated with the EQ-5D and the SF-6D indexes, and symptom duration and depression with the EQ-VAS index.
ConclusionThe EQ-5D better assessed the clinical change in patients with fibromyalgia. Furthermore, impact of fibromyalgia, symptom duration, and depression seem to be associated with the utility indexes.
Economic evaluation identifies the balance between the costs and benefits associated with an intervention, being a helpful tool in selecting optimal treatment options for a condition.1–4 Among the types of economic evaluation in healthcare,1–4 cost-effectiveness and cost-utility analyses are essential for an in-depth assessment of available interventions.2–5 In a cost-utility analysis, utility indexes enable the assessment of treatment effects and are used to calculate quality-adjusted life years (QALY).1–4
QALY is a clinical measure that combines lifetime benefits with quality of life (QoL).1–4 QALY enables the comparison of incremental cost-utility ratios of intervention programs for different health conditions.6 The utility indexes can be evaluated by direct and indirect methods.7 In the direct method, patients make a judgment about the numerical value of a particular health state, and one of the instruments that can be used is the Visual Analogue Scale (VAS).7 In the indirect method, generic instruments are used, including the Short-Form 6 Dimensions (SF-6D) and the EuroQol 5 Dimensions (EQ-5D).8–12
The results provided by the instruments are stratified in different health states and are usually validated in a community population, due to differences in the cultural context between different countries.8,9,12 However, some studies showed13–15 that different results can be generated by different instruments even though they are theoretically measuring the same construct. One study14 observed that the SF-6D and EQ-5D may favor different treatment options for knee pain at the same willingness to pay threshold. Other studies13,15 showed that the EQ-5D presented higher measurement error while the SF-6D was more responsive to detect disability changes in patients with low back pain. Therefore, these results suggest that the two instruments do not measure exactly the same construct,13 and these discrepancies prevent them to be used interchangeably.15
A systematic review about the use of health state utility indexes instruments in economic evaluation recommends that measurement properties of instruments be tested to verify their practicality, reliability, and validity when applied to different health states and severity levels.16 Given that discrepancies between different utility indexes instruments can have implications for calculating the incremental cost-utility ratio when comparing different interventions for the same health condition,8,10,14,17 it is extremely important to identify whether these discrepancies occur in different cross-cultural adaptations of the instruments, as well as in health conditions not yet investigated10 such as fibromyalgia.
Fibromyalgia is one of the most common rheumatic diseases in the world,18–21 with an overall prevalence of 2.7% and more commonly affect women.22,23 Estimations show that the prevalence of fibromyalgia in the Brazilian population aged 35–60 years is 4.4%, being higher in older adults.24,25 Although fibromyalgia has a reasonably low prevalence compared to other chronic conditions, economic impact studies show that patients with fibromyalgia lead to high healthcare and lost productivity costs.26–28 Due to the economic impact generated by fibromyalgia, cost-effective interventions must be identified.
Thus, the main objective of this study was to evaluate whether different health state utility indexes instruments available in Brazilian-Portuguese are comparable when applied to Brazilian patients with fibromyalgia. A secondary objective was to identify variables that may be associated with health state utility indexes instruments in these patients.
MethodsStudy designThis longitudinal study is a secondary analysis of data from a randomized controlled trial (RCT) on patients with fibromyalgia.29 In that trial, data were collected at baseline and in three post-treatment periods: eight-week and six- and 12-month follow-ups (Fig. 1). The RCT was previously approved by the Research Ethics Committee of Universidade Cidade de São Paulo, Brazil (CAAE: 51328215.1.0000.0064) and was registered in Clinical Trials Database (number: NCT03050606). All patients signed a consent form to participate in the study. Details of the RCT protocol were previously published.29

The aim of the RCT was to evaluate the clinical and cost-effectiveness of Pilates compared to aerobic exercises in the treatment of patients with fibromyalgia. In this study, which included 97 randomly assigned patients with fibromyalgia, the main results showed that, except for the EQ-5D at 12-month follow-up, there was no difference between Pilates and aerobic exercises for the impact of fibromyalgia and health-related quality of life (HRQoL) at eight-week and six- and 12-month follow-ups. Based on these results, we decided to combine both groups in a unique group for the analysis in this study.
Study settingThe study was conducted at the Center of Excellence in Clinical Research in Physical Therapy at Universidade Cidade de São Paulo, Sao Paulo, Brazil.
ParticipantsThe study included 97 patients of both sexes, aged 20–75 years, who met the 2010 fibromyalgia classification criteria of the American College of Rheumatology,30 and with pain intensity of three or more points on the Pain Numerical Rating Scale (PNRS).31 Exclusion criteria were any contraindication to physical activity, pregnancy, uncontrolled systemic disease, any neurological, cardiorespiratory, and musculoskeletal condition that could interfere with treatment, advanced joint disease, severe lower limb joint injury or pain, partial or total muscle tear, amputations, recent surgery, and inability to speak or read Brazilian-Portuguese.
ProceduresPatients were assessed by a blinded assessor for eligibility and demographic and anthropometric data. The following clinical outcomes were measured at baseline and at the eight-week and six- and 12-month follow-ups: HRQoL (utility indexes), pain intensity, impact of fibromyalgia, kinesiophobia, sleep quality, and depression. Baseline and eight-week follow-up were face to face, while the six- and 12-month follow-ups were conducted via telephone by two blinded assessors, trained to administer the questionnaires used in the study. All questionnaires used in this study were translated and validated to Brazilian-Portuguese.9,31–40
The evaluation instruments used in this study included the: SF-6D, EQ-5D, EQ-visual analog scale (EQ-VAS), Fibromyalgia Impact Questionnaire (FIQ), PNRS, Tampa Scale for Kinesiophobia (TSK-11), Pittsburgh Sleep Quality Index (PSQI), and Beck Depression Inventory I (BDI-I).
The SF-6D measures HRQoL with six domains: physical functioning, role limitation, mental health, social functioning, pain, and vitality.9,33,34 The score ranges from 0 (worst health state) to 1 (best health state).9,33,34 The EQ-5D measures HRQoL with five dimensions: mobility, self-care, usual activities, pain/discomfort, and anxiety/depression. Each dimension has three levels of severity: no problems, some problems, and extreme problems.39,41 The score ranges from 0 (worst health state) to 1 (best health state).39,41 The EQ-5D questionnaire contains a 20-cm VAS, which is not included in the calculation of the final EQ-5D score and can be independently assessed. The EQ-VAS is a direct measure of the patient's health state and the score ranges from 0 (worst health state) to 100 (best health state).41 A numerical scale from 0 to 100 points was used instead of the original VAS to allow for follow-ups via telephone, based on the good correlation between the VAS and the Numerical Rating Scale (NRS).31 The FIQ assesses the impact of fibromyalgia on QoL with 10 questions. Question 1 contains a 10-item subscale related to physical function. In items 2 and 3, the participant marks the number of days they felt well and the number of days they were unable to work due to fibromyalgia in the last seven days. Items 4–10 are numerical scales on which the patient rates work difficulty, pain, fatigue, morning tiredness, stiffness, anxiety, and depression. A NRS from 0 to 10 was used instead of the original VAS to allow for follow-ups via telephone, based again on the good correlation between VAS and NRS.31 The FIQ score ranges from 0 to 100, with higher values indicating greater impact of fibromyalgia on QoL.38
The PNRS is an 11-point scale (0–10) that assesses the patient's mean pain intensity over the past seven days, where 0 represents “no pain” and 10 represents “pain as bad as it could be.”31 The TSK is composed of 17 questions addressing kinesiophobia. The score of each question ranges from 1 to 4. The total score varies between 17 and 68, with higher scores representing a higher degree of kinesiophobia.35,40 The PSQI consists of 19 questions distributed into seven components (subjective sleep quality, sleep latency, sleep duration, habitual sleep efficiency, sleep disturbances, use of sleeping medication, and daytime dysfunction), which are rated on a score ranging from 0 to 3. The sum of the scores from the seven components ranges from 0 to 21, and higher scores indicate worst sleep quality.32 The BDI-I is a 21-item self-report rating inventory, with answers generating a score that varies from 0 to 3. The individual item scores are added up to calculate the final score. Scores below 10 correspond to no depression, scores between 10 and 16 correspond to mild to moderate depression, scores from 17 to 29 correspond to moderate to severe depression, and scores above 30 correspond to severe depression.36,37,42
InterventionsBoth groups received an educational intervention in the first session.29 Additionally, patients randomized to the Pilates group received Pilates-based exercises including exercises on a mat with accessories, and on apparatus, with activation of the core muscles while exhaling. Patients randomized to the aerobic exercise group received aerobic exercises on a stationary bike or treadmill, with training heart rate of 57 to 76% of the maximum heart rate, corresponding to mild to moderate intensity of exercise.29 Both groups received 16 one-hour individualized exercise sessions over eight weeks.29 Due to the nature of the intervention, patients and therapists were not blinded to group allocation.
Data analysisAll statistical analyses were conducted with SPSS software version 19 for Windows (SPSS Inc., Chicago, Illinois). Baseline characteristics were presented descriptively. The COnsensus-based Standards for the selection of health Measurement INstruments (COSMIN) initiative considers a sample size of at least 50 patients as very good for the analysis of construct validity and responsiveness. Thus, the sample size of this study (n = 97 patients) may be considered relevant for both analyzes.43 Construct validity was analyzed based on the correlation between the impact of fibromyalgia and the utility indexes instruments SF-6D, EQ-5D, and EQ-VAS at baseline using Spearman’s correlation coefficient (r) due to the ordinal nature of the instruments’ scores. The hypotheses established for this measurement property are described in the first column of Table 1. Construct validity was considered high when less than 25% of the hypotheses are rejected, moderate when 25 to 50% of the hypotheses are rejected, and poor when more than 50% of the hypotheses are rejected.44
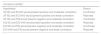
Hypotheses of the study for construct validity and responsiveness analyses.
| Construct validitya | |||
|---|---|---|---|
| Hypothesis | Result | ||
| SF-6D and EQ-5D would present positive and moderate correlation | Confirmed | ||
| SF-6D and EQ-VAS would present positive and weak correlation | Rejected | ||
| SF-6D and FIQ would present negative and moderate correlation | Confirmed | ||
| EQ-5D and EQ-VAS would present positive and weak correlation | Rejected | ||
| EQ-5D and FIQ would present negative and moderate correlation | Confirmed | ||
| EQ-VAS and FIQ would present negative and weak correlation | Rejected | ||
| Responsivenessb | |||
|---|---|---|---|
| Hypothesis | Results | ||
| 8-week follow-up | 6-month follow-up | 12-month follow-up | |
| The change in the SF-6D and EQ-5D scores would present a positive and moderate correlation | Confirmed | Confirmed | Confirmed |
| The change in the SF-6D and EQ-VAS scores would present a positive and weak correlation | Confirmed | Rejected | Confirmed |
| The change in the SF-6D and FIQ scores would present a negative and moderate correlation | Rejected | Rejected | Rejected |
| The change in the EQ-5D and EQ-VAS scores would present a positive and weak correlation | Confirmed | Rejected | Rejected |
| The change in the EQ-5D and FIQ scores would present a negative and moderate correlation | Confirmed | Confirmed | Confirmed |
| The change in the EQ-VAS and FIQ scores would present a negative and weak correlation | Rejected | Confirmed | Rejected |
Construct validity was considered high when less than 25% of the hypotheses are rejected, moderate when 25 to 50% of the hypotheses are rejected, and poor when more than 50% of the hypotheses are rejected.44
Responsiveness was considered high when less than 25% of hypotheses are rejected, moderate when 25 to 50% of hypotheses are rejected, and poor when more than 50% of hypotheses are rejected.46
Responsiveness was assessed based on the correlation between the change scores of the impact of fibromyalgia and each utility index instrument at baseline and in the eight-week and six- and 12-month follow-ups, also using Spearman’s correlation coefficient (r) due to the ordinal nature of the instruments’ scores. Responsiveness was also analyzed using the hypothesis and constructing a receiver operating characteristic (ROC) curve using the FIQ as the change criterion. For this last analysis, the FIQ scores were converted into categorical outcomes considering the minimum clinically relevant improvement of 14%.45 Patients who achieved 14% or greater improvement in the FIQ at eight-week and six and 12-month follow-ups were categorized as “improved” and patients who did not achieve 14% improvement were categorized as “not improved.” The hypothesis test established to assess responsiveness is described in the first column of the Table 1. Responsiveness was considered high when less than 25% of hypotheses are rejected, moderate when 25 to 50% of hypotheses are rejected, and poor when more than 50% of hypotheses are rejected.46 Additionally, for a scale to be considered responsive, the area under the curve (AUC) must be ≥0.70.43 To classify the magnitude of the correlations for construct validity and responsiveness, r<0.30 indicate weak correlation, r ≥ 0.30 and <0.60 indicate moderate correlation, and r ≥ 0.60 indicate good correlation.47
Linear regression models were also performed to explore clinical and sociodemographic factors associated with the utility indexes instruments in the Brazilian population with fibromyalgia at baseline. Thus, for each of the three dependent continuous variables (SF-6D, EQ-5D, and EQ-VAS), the following independent variables at baseline were considered: educational level expressed as low and high level of education (categorical variable), age expressed in years, income expressed in number of minimum wages, symptom duration expressed in months, and pain intensity, impact of fibromyalgia, kinesiophobia, sleep quality, and depression (continuous variables). All variables were forced in the multiple linear regression model using the backward method, and the variables with p < 0.05 remained in the model (entry criteria of p ≤ 0.05 and removal criteria of p ≥ 0.10). The assumptions of normality, multicollinearity, and linearity were not violated in all models and were considered present in the occurrence of tolerance <0.10. A test of normal distribution of the linear regression models was conducted by plotting both residuals and normal distribution.
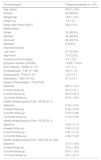
ResultsPatient characteristics are presented in Table 2. Construct validity was considered moderate, as three hypotheses were confirmed (second column of the Table 1). The correlation between the EQ-5D and the SF-6D was moderate (r = 0.51, p < 0.001). The EQ-VAS showed a moderate correlation with the SF-6D (r = 0.41, p < 0.001) and was not correlated with the EQ-5D (r = 0.20, p = 0.05). The correlation between SF-6D, EQ-5D, and EQ-VAS with the FIQ was moderate (r=-0.43, p < 0.001; r=-0.41, p < 0.001; r=-0.30, p = 0.003 respectively).
Patient characteristics at baseline and impact of fibromyalgia and HRQoL at baseline and 8-week, 6- and 12-month follow-ups.
| Characteristics | Patients assessed (n = 97) |
|---|---|
| Age (years) | 49.9 ± 10.6 |
| Female | 96 (99.0%) |
| Weight (kg) | 76.9 ± 14.5 |
| Height (m) | 1.6 ± 0.1 |
| Body mass index (kg/m2) | 29.5 ± 5.4 |
| Marital status | |
| Single | 20 (20.6%) |
| Married | 45 (46.4%) |
| Divorced | 24 (24.7%) |
| Widower | 8 (8.3%) |
| Educational level | |
| Low level | 27 (27.8%) |
| High level | 70 (72.2%) |
| Income (minimum wage) | 3.7 ± 2.8 |
| Symptom duration (months) | 119.8 ± 104.4 |
| Pain intensity - PNRS (0−10) | 7.6 ± 1.3 |
| Kinesiophobia - TSK (17−68) | 43.0 ± 7.9 |
| Sleep quality - PSQI (0−21) | 13.5 ± 3.1 |
| Depression – BDI-I (0−63) | 21.4 ± 6.1 |
| Impact of fibromyalgia - FIQ (0100) | |
| Baseline | 69.4 ± 11.3 |
| 8-week follow-up | 41.3 ± 21.1 |
| 6-month follow-up | 56.3 ± 20.3 |
| 12-month follow-up | 57.9 ± 19.0 |
| Health-related quality of life - SF-6D (0−1) | |
| Baseline | 0.70 ± 0.04 |
| 8-week follow-up | 0.72 ± 0.04 |
| 6-month follow-up | 0.73 ± 0.06 |
| 12-month follow-up | 0.74 ± 0.06 |
| Health-related quality of life - EQ-5D (0−1) | |
| Baseline | 0.54 ± 0.10 |
| 8-week follow-up | 0.66 ± 0.12 |
| 6-month follow-up | 0.61 ± 0.13 |
| 12-month follow-up | 0.62 ± 0.20 |
| Health-related quality of life - EQ-VAS (0−100) | |
| Baseline | 57.0 ± 19.6 |
| 8-week follow-up | 70.3 ± 18.4 |
| 6-month follow-up | 60.3 ± 19.8 |
| 12-month follow-up | 63.1 ± 21.2 |
Data are mean ± standard deviation or frequency (proportion).
Minimum wage: R$ 880.00.
Higher scores in the PNRS, FIQ, TSK, PSQI and BDI-I indicate the worst condition, and in the instruments SF-6D, EQ-5D and EQ-VAS indicate the best condition.
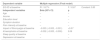
Responsiveness was considered moderate in all follow-ups, as three (at six- and 12-month follow-ups) and four hypotheses (at eight-week) were confirmed. ROC curve analysis showed that the EQ-5D and the SF-6D were responsive at the eight-week follow-up, only the EQ-5D was responsive at the six-month follow-up, and the EQ-5D, the SF-6D, and the EQ-VAS were not responsive at the 12-month follow-up. Responsiveness analyses are presented in the second column of Table 1 and in Table 3.
Results of the responsiveness analysis.
| 8-week follow-up (n = 97) | ||||
|---|---|---|---|---|
| Instruments | SF-6D | EQ-5D | EQ-VAS | AUC (95% CI) |
| FIQ | −0.13 (0.21) | −0.37 (<0.01)* | −0.30 (<0.01)* | NA |
| SF-6D | – | 0.35 (<0.01)* | 0.27 (0.01)* | 0.72 (0.60, 0.84) |
| EQ-5D | – | – | 0.25 (0.01)* | 0.76 (0.62, 0.91) |
| EQ-VAS | – | – | – | 0.63 (0.43, 0.83) |
| 6-month follow-up (n = 97) | ||||
|---|---|---|---|---|
| SF-6D | EQ-5D | EQ-VAS | AUC (95% CI) | |
| FIQ | −0.20 (0.048)* | −0.43 (<0.01)* | −0.29 (<0.01)* | NA |
| SF-6D | – | 0.33 (0.001)* | 0.10 (0.35) | 0.63 (0.52, 0.74) |
| EQ-5D | – | – | 0.11 (0.30) | 0.72 (0.62, 0.82) |
| EQ-VAS | – | – | – | 0.64 (0.53, 0.76) |
| 12-month follow-up (n = 97) | ||||
|---|---|---|---|---|
| SF-6D | EQ-5D | EQ-VAS | AUC (95% CI) | |
| FIQ | −0.22 (0.03)* | −0.32 (<0.01)* | −0.32 (<0.01)* | NA |
| SF-6D | – | 0.51 (<0.01)* | 0.26 (0.01)* | 0.66 (0.55, 0.77) |
| EQ-5D | – | – | 0.19 (0.07) | 0.68 (0.58, 0.79) |
| EQ-VAS | – | – | – | 0.69 (0.59, 0.81) |
Values are described in r (p-value).
AUC: area under the curve; CI: confidence interval; – : not applicable; NA: not assessed.
*Statistically significant value (p < 0.05).
For the AUC analysis at the 8-week follow-up: 84 patients improved and 13 did not improve, at the 6-month follow-up: 53 patients improved and 44 did not improve, and at the 12-month follow-up: 47 patients improved and 50 did not improve.
Table 4 shows the results of the multiple linear regression analysis. The final equation for predicting the health state utility index measured by the EQ-5D at baseline was as follows: EQ-5D at baseline = 0.85 + (-0.003 x impact of fibromyalgia at baseline). The final equation for predicting the health state utility index measured by the SF-6D at baseline was as follows: SF-6D at baseline = 0.84 + (-0.001 x impact of fibromyalgia at baseline). The final equation for predicting the health state utility index measured by the EQ-VAS at baseline was as follows: EQ-VAS at baseline = 0.84 + (0.04 x symptom duration) + (-1.23 x depression). Therefore, the impact of fibromyalgia at baseline was associated with the EQ-5D and the SF-6D at baseline, whereas symptom duration and depression at baseline were associated with the EQ-VAS at baseline. For example, when comparing a patient with five years of symptom duration to a patient with 10 years of symptom duration, both with 20 points of depression, the EQ-VAS difference at baseline is equal to 0.2 point.
Regression analysis.
| Dependent variable | Multiple regression (Final model) | ||
|---|---|---|---|
| EQ-5D at baseline | R²: 18.7% | F: 10.67 | Constant: 0.85 |
| Independent variables | Beta (95% CI) | p | |
| Age | – | – | |
| Income | – | – | |
| Education level | – | – | |
| Symptom duration | – | – | |
| Pain intensity at baseline | – | – | |
| Impact of fibromyalgia at baseline | −0.003 (−0.005, −0.001) | <0.01* | |
| Kinesiophobia at baseline | −0.002 (−0.005, −0.000) | 0.06 | |
| Sleep quality at baseline | – | – | |
| Depression at baseline | – | – | |
| Dependent variable | Multiple regression (Final model) | ||
|---|---|---|---|
| SF-6D at baseline | R²: 22.9% | F: 9.09 | Constant: 0.84 |
| Independent variables | Beta (95% CI) | p | |
| Age | – | – | |
| Income | – | – | |
| Education level | – | – | |
| Symptom duration | – | – | |
| Pain intensity at baseline | – | – | |
| Impact of fibromyalgia at baseline | −0.001 (−0.002, −0.001) | <0.01* | |
| Kinesiophobia at baseline | −0.002 (−0.002, 0.000) | 0.07 | |
| Sleep quality at baseline | – | – | |
| Depression at baseline | −0.001 (-−0.002, 0.000) | 0.05 | |
| Dependent variable | Multiple regression (Final model) | ||
|---|---|---|---|
| EQ-VAS at baseline | R²: 16.4% | F: 9.15 | Constant: 0.84 |
| Independent variables | Beta (95% CI) | p | |
| Age | – | – | |
| Income | – | – | |
| Education level | – | – | |
| Symptom duration | 0.04 (0.004, 0.07) | 0.03* | |
| Pain intensity at baseline | – | – | |
| Impact of fibromyalgia at baseline | – | – | |
| Kinesiophobia at baseline | – | – | |
| Sleep quality at baseline | – | – | |
| Depression at baseline | −1.23 (−1.85, −0.61) | <0.01* | |
95% CI: confidence interval.
*Statistically significant value (p < 0.05).
-: Not applicable.
The main objectives of this study were to determine whether the different instruments used to assess health state utility indexes are comparable, and which clinical variables are associated with the index of each instrument. In the construct validity analysis, the correlation between the EQ-5D and the SF-6D was moderate. The EQ-VAS showed a moderate correlation with the SF-6D and was not correlated with the EQ-5D. The correlations between the SF-6D, the EQ-5D, and the EQ-VAS with the FIQ were moderate. In the responsiveness analysis, the EQ-5D was more responsive in the assessment of clinical change at eight-week and six-month follow-up, while the SF-6D was responsive only in the eight-week follow-up. The EQ-VAS was not responsive in any of the follow-ups, and no instrument was responsive in the 12-month follow-up. In the multiple regression analysis, the impact of fibromyalgia was associated with the EQ-5D and the SF-6D health state utility indexes. In contrast, symptom duration and depression were associated with the utility indexes measured by the EQ-VAS. Although the beta coefficients were statistically significant, the effect sizes seem to be small and not clinically important.
Comparison with other studiesThe most common health state utility indexes instruments used to calculate QALY are the EQ-5D and SF-6D.21 The health state utility indexes instruments should evaluate the same construct. However, some studies show that these questionnaires present different results at the same willingness-to-pay threshold per QALY.14,15 Thus, these instruments seem to measure different aspects of HRQoL,10 which explains the differences found in the measurement properties in the present study.
A study13 tested the Norwegian versions of the SF-6D and EQ-5D in patients with chronic low back pain and the results for construct validity were similar to those of our study. The SF-6D and EQ-5D presented a moderate correlation with the Oswestry disability index (r = 0.38 and r = 0.58, respectively). However, the authors did not investigate the correlation between the two health state utility indexes instruments. Unlike the present study, the responsiveness values for these instruments were higher for patients with chronic low back pain (in the AUC, the possibility of correctly discriminating a “responder” or “non-responder” patient was 90% for the SF-6D and 83% for the EQ-5D). In addition, the same study13 also found a low agreement between the SF-6D and EQ-5D.
Another study10 compared the health state utility indexes instruments in participants with different clinical conditions and different levels of QoL. The results showed a low agreement between the health state utility indexes instruments when analyzing the intraclass correlation coefficient, which ranged from 0.28 to 0.55. Furthermore, the study10 also showed that the SF-6D is more indicated in the assessment of mild health conditions, while the EQ-5D is more indicated for severe health impairments. In other words, these health state utility indexes instruments measure different aspects and depend on the severity of the clinical condition evaluated. Thus, we believe that the EQ-5D would be the most appropriate instrument to assess patients with fibromyalgia, due to the high impact on patients' QoL caused by this health condition.48
The comparison of the measurement properties of the EQ-VAS was not yet performed. EQ-VAS is a direct method of health state utility evaluation and this may explain the poor correlation with the SF-6D and EQ-5D, which are indirect methods. The use of a direct method based on the EQ-VAS seems to be limited due to its weak economic basis, as it does not involve an individual choice or decision regarding uncertainty.49,50 In addition, this method also has a scale bias because patients are averse to answer health states near to the extreme ends of a scale.51 Regarding the identification of clinical and demographic variables that may be associated with the health state utility indexes instruments, no studies with this approach were found for any health condition.
Clinical implication and directions for future researchAs the EQ-5D and SF-6D generate different scores under various clinical conditions,50 these two instruments should not be used interchangeably to measure treatment preference, as they tend to favor different interventions, which may confuse the decision-maker, patient, and clinician.13,15 Ideally, data related to economic evaluation should be grouped according to the utility index instrument, rather than evaluating QALY independently of the instrument used, as usually occurs in some systematic reviews of economic evaluation. The present study showed that the EQ-5D and the SF-6D have a moderate correlation with the FIQ, however the EQ-5D showed short- and medium-term (eight-week and six-month follow-ups, respectively) responsiveness for patients with fibromyalgia, while the SF-6D only showed short-term (eight-week follow-up) responsiveness. These findings may favor the use of the EQ-5D in Brazilian patients with fibromyalgia. Future studies should test the measurement properties of the Brazilian versions of these utility indexes instruments under different health conditions to determine which instrument is the most appropriate.
Strengths and weaknesses of the studyThe Brazilian-Portuguese versions of the utility instruments had not been compared previously, and all studies that performed these comparisons had been conducted in high-income countries.13–15 Thus, our results show the reality of another cultural and socioeconomic context, which is especially important in these evaluations. In addition, this study analyzed the measurement properties according to the COSMIN recommendations.9,33,34,39,43 This evaluation was performed with a relevant sample size and classifications for each measurement property evaluated.43 The present study also included regression analyses, which may help to better understand the components most involved with the constructs of each instrument.
A potential limitation of this study is that some questions of the FIQ and the EQ-VAS were evaluated numerically in all assessments. However, this form of assessment did not seem to affect the responsiveness outcome, given that in the eight-week face-to-face assessment, the EQ-VAS no longer showed good responsiveness either by correlation with other health state utility indexes instruments nor by ROC curve analysis. Another limitation is that the final score of EQ-5D, SF-6D, and FIQ is calculated based on ordinal data. In a final score derived from ordinal data, the distances between the categories of the instruments are separated by unknown quantities of the measured variable and can vary across the instrument.52,53 Thus, the final score of EQ-5D, SF-6D, and FIQ may not be appropriate to calculate change scores, and the results of responsiveness analyses should be interpreted with caution, although previous studies also assessed the responsiveness of the EQ-5D and SF-6D using correlation between change scores of the instruments.13,15
ConclusionThe results of this study suggest that there are differences between the EQ-5D, the SF-6D, and the EQ-VAS. We suggest that the EQ-5D may be more appropriate for the assessment of health state utility indexes in Brazilian patients with fibromyalgia due to the presence of a moderate correlation with the SF-6D and the FIQ, as well as moderate responsiveness in the short and medium-term. Additionally, there was an association between the utility instruments and impact of fibromyalgia, symptom duration, and depression. However, the beta coefficients were small and not clinically important.
Conflict of interestsThe authors declare that there are no conflicts of interest.
The authors thank the Sao Paulo Research Foundation (FAPESP) (process number 2015/21590-6, 2016/12962-0, 2018/07599-9, and 2019/09593-0) for financial support. The authors also thank Andersom R. Fréz for helping in the data analysis.


