


SATIS-Stroke questionnaire has been translated and adapted for use in the Brazilian population, however, it is necessary to test the measurement properties in Brazilian population.
ObjectiveTo test the reliability, agreement, concurrent validity, and diagnostic accuracy of the SATIS-Stroke.
MethodsChronic stroke survivors were included. The calculations were made using scores in logits (Rasch Model). Reliability was tested using the intraclass correlation coefficient (ICC2,1), standard error of measurement (SEM), minimal detectable change (MDC), and Bland-Altman plots. Concurrent validity was analyzed using Spearman's correlation coefficient. For such, the correlation between SATIS-Stroke and Stroke Specific Quality of Life (SS-QOL) questionnaires was determined. Diagnostic accuracy was estimated based on the area under the receiver operating characteristic (ROC) curve with a 95% confidence interval and considering the sensitivity and specificity of SATIS-Stroke in differentiating different types of activity and participation.
ResultsEighty stroke survivors were analyzed. Mean age was 57.98±13.85 years and 45.2% had severe impairment. Excellent reliability was found (intra-observer ICC2,1 = 0.90; 95% CI: 0.84, 0.93; inter-observer ICC2,1 = 0.89; 95% CI: 0.83, 0.93). The Bland-Altman plot demonstrated satisfactory agreement. In the analysis of concurrent validity, a strong, positive, significant correlation was found between SATIS-Stroke and SS-QOL (rs = 0.74; p <0.001 with an r2=0.44; p=0.001). Diagnostic accuracy was satisfactory, with 80.8% sensitivity and 85.2% specificity.
ConclusionThe Brazilian version of the SATIS-Stroke questionnaire exhibited adequate reliability, concurrent validity, and diagnostic accuracy. Therefore, this is a valid, reproducible measure for the assessment of satisfaction with regard to activities and participation following a stroke.
According to the World Health Organization, stroke is the third major cause of disability worldwide.1 Stroke causes physical and psychosocial impairments that have a direct impact on functioning, causing limitations with regard to daily activities and restrictions to social participation.2-4
Several assessment measures are used to evaluate the constructs of activity and participation. Both capacity-based and performance-based instruments can be used for the assessment of the activity component of the International Classification of Functioning, Disability and Health (ICF). The measurement of capacity usually requires a clinical setting. It does not always require a large amount of time, but prior training of the evaluator is usually necessary. Performance-based instruments can usually be administered without a clinical setting and are more likely to be formatted as questionnaires, which can be time-consuming and may require specific training of the evaluator.5,6
The Assessment of Life Habits (LIFE-H),7 Stroke Specific Quality of Life (SS-QOL),8 and Stroke Impact Scale (SIS)9 are used for the classification of the participation component in the Brazilian population. LIFE-H (3.1) addresses seven of the nine domains of the ICF Activity and Participation component; the exceptions are Learning and applying knowledge and General tasks and demands.5 SIS (3.0) addresses only five domains of the Activity and Participation component: Learning and applying knowledge, Communication, Mobility, Self-care, and Domestic life.5 SS-QOL addresses eight domains; the exception is General tasks and demands.8
SATIS-Stroke has recently been translated and adapted for use in the Brazilian population and is considered a promising assessment tool for the evaluation of activity and participation following a stroke.10 Moreover, it is the only scale to address the nine domains of the ICF Activity and Participation component.10,11 Therefore, SATIS-Stroke addresses domains not covered by other scales, such as Learning and applying knowledge and General tasks and demands.5,6,8 The major difference of this scale is that it evaluates satisfaction, which relates to the perception of stroke survivors regarding their performance on activities and life situations to meet their needs.
Satisfaction is defined as a state of enthusiasm or pleasure one feels when achieving a goal, whereas failure to achieve a goal can lead to a sensation of dissatisfaction. The response options on the SATIS-Stroke questionnaire enable the identification of the effort and pleasure an individual has upon performing the tasks addressed in the items of the questionnaire.6,12 Such self-reported information can facilitate planning of the rehabilitation process.12
Although initial findings indicate that SATIS-Stroke is a reliable instrument for use in Brazil, with adequate internal consistency and reliability, it is necessary to test other measurement properties considering the characteristics of the Brazilian population.12 Therefore, the aim of the present study was to test the reliability, agreement, concurrent validity, and diagnostic accuracy of the SATIS-Stroke questionnaire.
MethodsStudy designThe present methodological cross-sectional study was conducted using the Guidelines for Reporting Reliability and Agreement Studies (GRRAS).13 The accuracy procedures were based on the Standards for Reporting Diagnostic Accuracy Studies (STARD).14 This study received approval from the Human Research Ethics Committee of Universidade Nove de Julho, São Paulo, Brazil (certificate number: 74235417.7.0000.5511).
Sample sizeFollowing the guidelines of quality criteria for questionnaires addressing health status,15 the minimum sample size for the analysis of reliability was determined to be 50 individuals. However, considering the characteristics of the sample studied, we followed the recommendation proposed by Hobart et al.,16 who established a minimum of 80 participants for the adequate analysis of the measurement properties of assessment tools for individuals with neurological disorders.
ParticipantsThe participants were recruited from the physical therapy clinics of Universidade Nove de Julho. All volunteers who agreed to participate signed the informed consent form. To be included, participants had to meet the following criteria: diagnosis of stroke, at least six months since the stroke event (chronic phase), age 20 years or older, and hemiparesis. Individuals with hearing impairment and/or motor aphasia identified at the time of the interview and those with a positive score for cognitive deficit (using the cutoff points on the Mini Mental State Examination proposed by Bertolucci et al.17) were excluded from the study.
InstrumentsThe researchers interviewed the participants to collect data on age, sex, schooling, time since the stroke event, type of stroke (ischemic or hemorrhagic), number of stroke episodes, affected hemisphere (left or right), and marital status.
Fugl-MeyerStroke severity was identified using the Fugl-Meyer scale, which is a quantitative motor measure of post-stroke recovery.18 For such, a three-point scale is used: (0) cannot perform; (1) performs partially; and (2) performs fully. The total score of the motor scale is 100 points. The lower limb is scored from 0 to 34 points and the upper limb is scored from 0 to 66 points. The scores are interpreted as follows: ≤ 50 points = severe, 51-84 = marked, 85-95 = moderate and ≥ 96 = mild impairment.18
SATIS-StrokeThe SATIS-Stroke questionnaire was administered in interview form by two observers, as recommended in studies involving the Brazilian population. The observers were trained to pose the questions in a standardized manner and not influence the responses.19,20 We followed the recommendations of the study by Pereira et al.10 for the administration of the questionnaire. SATIS-Stroke has 36 items that address the nine ICF domains (learning and applying knowledge, general tasks and demands, communication, mobility, personal care, domestic life, interpersonal interactions and relationships, major life areas, community, social and civic life).21 Each item has four response options. “Very dissatisfied” means the individual is unable to perform the activity without assistance. “Dissatisfied” mean that the individual is capable of performing the activity but requires some assistance. “Satisfied” means the individual can perform the activity without assistance, but experiences difficulty. “Very satisfied” means the individual can perform the activity easily and independently.
Each item is scored from 0 to 3 points, with a maximum score of 108 points. Activities and living situations not performed in the previous 30 days are marked “not applicable” and are scored zero.10 Higher scores denote greater satisfaction with activity and participation. The crude total SATIS-Stroke score should be transformed into logits, which is a measure from the Rasch model. Although the crude score is easier to obtain in clinical practice, the ideal is to use the score in logits, which provides greater reliability of the general measure of satisfaction, avoiding measurement error, which cannot be demonstrated with the crude score. Rasch analysis is a probabilistic model that converts ordinal scores into interval measures, making attributes one-dimensional and tailoring the response format. The data can be converted using the attached table (Supplemental online material I). This supplementary material enables identifying which values in logit should be considered to obtain the crude SATIS-Stroke score. When items are answered as "not applicable", the total score in logits must be obtained through an online analysis using the link: http://rssandbox.iescagilly.be/satispart-stroke-rasch-analysis-stroke.html.
SS-QOLTo test the concurrent validity of SATIS-Stroke, the score obtained on the 26 items of the SS-QOL questionnaire was used as the association measure. HRQoL assessment tools were initially recommended for the assessment of participation.8 Both HRQoL and participation are patient-oriented constructs, which favors the interposed use of these concepts and may be one of the reasons why an HRQoL assessment was initially best suited for addressing participation.8 Silva et al.22 performed the validation process of SS-QOL for the evaluation of the “Activity and Participation” component and found excellent intra-observer and inter-observer reliability as well as adequate construct validity and internal consistency for use on the Brazilian population.19,22 Although other scales (LIFE-H and SIS) also have satisfactory measurement properties, SS-QOL has better internal consistency and a shorter application time.
SS-QOL was administered in interview form (questions and answers) on the first day immediately after the administration of the SATIS-Stroke questionnaire. The total score ranges from 26 to 130 points, with higher scores denoting a better perception of participation. SS-QOL was also used to determine the diagnostic accuracy of SATIS-Stroke. For such, two groups with different levels of participation were considered. These groups were formed using a cutoff point of ≥ 80 points on SS-QOL, as suggested by Silva et al.,23 who determined this cutoff point as adequate for discriminating individuals with and without limitations and restrictions to activities and participation.
ProceduresAll participants were evaluated in a clinical setting. For the evaluation of intra-observer reliability, Observer I administered SATIS-Stroke twice (test-retest) with a minimum of seven days and maximum of 15 days between applications. Observer II also administered SATIS-Stroke for the determination of inter-observer reliability.
The three random administrations of SATIS-Stroke were performed on different occasions. A minimum of seven days between evaluations is necessary to avoid the memorization of the answers and a maximum of 15 days is used to avoid the occurrence of a change in an individual's satisfaction with activities and participation.19 Individuals who reported events that occurred in the periods between the tests that could alter the results, such as a fall or losing a loved one, would be automatically excluded from the study to avoid influencing the measure of reliability.19
Statistical analysisThe Shapiro-Wilk test was used to determine the normality of the data. Parametric data were expressed as mean and standard deviation. Nonparametric as median and inter-quartile range. Categorical variables were described in absolute values and percentage of the total sample.
The reliability of SATIS-Stroke was investigated based on the determination of reliability and agreement among the three evaluations using the intraclass correlation coefficient (ICC2,1 - two-way random effects, absolute agreement, single rater/measurement) and respective 95% confidence intervals (CI). ICC values for intra-observer and inter-observer reliability were interpreted as follows: < 0.5 = poor reliability; 0.5-0.75 = moderate reliability; 0.75-0.9 = good reliability; and > 0.90 = excellent reliability.24 The level of significance was set to 5% (p < 0.05) for all analyses.25 The standard error of the measurement (SEM) and minimal detectable change (MDC) were used to investigate intra-observer and inter-observer agreement. The SEM reflects the error of the instrument and was calculated by the ratio between the standard deviation (SD) of the mean of the differences and the square root of 2 (SD of differences/√2). The MDC is the minimal change in the measure that can be interpreted as real change and was calculated using the following formula: MDC = 1.96 x √2 x SEM.17 Agreement was also measured by the Bland-Altman plot. For such, dispersion diagrams were created showing individual differences (y axis) as a function of the means found for the two evaluations (x axis).26
Spearman's correlation coefficients (rs) were calculated for the determination of the strength of the linear correlation between SATIS-Stroke and SS-QOL. The coefficients were interpreted as follows: rs ≤ 0.39 = weak correlation; rs = 0.4 to 0.69 = moderate correlation; and rs ≥ 0.7 = strong correlation.27
A receiver operating characteristic (ROC) curve with a 95% CI was created for the evaluation of the diagnostic capacity and discriminatory power of SATIS-Stroke.28 For such, two groups with different levels of participation were considered (without limitations and restrictions; and with limitations and restrictions), using a cutoff point of ≥ 80 points on SS-QOL, as suggested by Silva et al.23 The ROC curve analysis reveals discriminatory exactitude, with a greater area under the ROC curve denoting greater discriminatory power of the instrument. A measure with perfect discrimination would generate an area under the curve (AUC) of 1.0, whereas a measure with low discriminatory power would generate an AUC less than 0.50. Moreover, this analysis enables the determination of the sensitivity and specificity of the instrument.
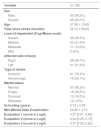
ResultsNinety-five individuals with hemiparesis stemming from a stroke were recruited for the present study, 11 of whom were excluded for aphasia and four for cognitive deficit. During the period in which the three administrations of SATIS-Stroke were performed, no participants reported any events that would lead to their exclusion from the study. Thus, the final sample was composed of 80 stroke survivors, 45.2% of whom had severe, 41.5% marked, and 13.2% moderate impairment. None of the individuals had mild impairment. Table 1 displays the demographic and clinical characteristics of the sample.
Demographic and clinical characteristics of participants.
Data expressed as absolute and relative frequency; mean ± standard deviation for parametric data; median and inter-quartile range [25th and 75th percentiles] for nonparametric variables.
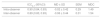
Regarding reliability, no significant difference (p > 0.05) was found between the different evaluation times. Excellent reliability was found in the analysis of the total score in logits (intra-observer ICC2,1 = 0.90; inter-observer ICC2,1 = 0.89). In the analysis of intra-observer and inter-observer agreement, the SEM was respectively 0.29 and 0.31 and the MDC was respectively 1.49 and 1.54 (Table 2). The analysis of individual items revealed adequate reliability, with the exception of item 30 “Being aware of what surrounds you”, which had an ICC2,1 of 0.39 (p < 0.001), denoting poor reliability (Supplemental online material II).
Reliability and agreement of SATIS-Stroke (n = 80).
| ICC2,1 (95%CI) | MD ± SD | SEM | MDC | |
|---|---|---|---|---|
| Intra-observer | 0.90 (0.84, 0.93) | -0.02 ± 0.42 | 0.29 | 1.49 |
| Inter-observer | 0.89 (0.83, 0.93) | -0.06 ± 0.44 | 0.31 | 1.54 |
Calculations made using scores in logits. ICC: intraclass correlation coefficient; CI: confidence interval; MD: mean difference; SD: standard deviation; SEM: standard error of measurement; MDC: minimal detectable change. *p = 0.001 for all ICCs.
Fig. 1 illustrate intra-observer and inter-observer agreement on the score in logits of SATIS-Stroke. Comparing the mean of the differences in the measures obtained from the different evaluations, a relatively symmetrical distribution around the midline is seen, with a high degree of dispersion in the intra-observer and especially inter-observer evaluation.
 and inter-observer (B) agreement on SATIS-Stroke score in logits. SD: standard deviation.")
The results of the concurrent validity analysis revealed a strong, positive, statistically significant correlation between SATIS-Stroke and SS-QOL (rs = 0.74 p < 0.001) with an r2 = 0.44; p = 0.001 (Fig. 2).
Diagnostic accuracy and SS-QOL.")
An AUC of 0.89 (95% CI: 0.80 to 0.95; p < 0.001) was found for the score in logits (Fig. 3). The analysis indicates that the best cutoff point for the identification of some level of restriction to activity and participation was ≤ 0.08, with 80.8% sensitivity and 85.2% specificity. There were 48 individuals (60%) without limitations and restrictions and 32 (40%) with limitations and restrictions. We analyzed the proportion of false negatives and false positives found when using the cutoff point of ≤ 0.08 (analysis shown in Supplemental online material III). The false-negative rate when diagnosing the participants was 14.5% and the false-positive rate was 28.2%. However, the rate of correct diagnoses using the cutoff point of ≤ 0.08 was greater than 70%.
Discussion
The present results demonstrate the excellent reliability of SATIS-Stroke. SATIS-Stroke also exhibited adequate concurrent validity compared to SS-QOL and the diagnostic capacity was satisfactory, with higher sensitivity and specificity when using the score in logits.
Reliability studies are important to determining the variability of a method or assessment tool to avoid erroneous interpretations of variables analyzed before and after an intervention.13 In the present study, excellent reliability was found, demonstrating that SATIS-Stroke is reliable for measuring satisfaction regarding activities and participation in stroke survivors. These results are similar to those reported by Bouffioulx et al.,12 who identified that measures at the first and second assessments were highly correlated (ICC2,1 = 0.98, p < 0.001), indicating that the scale is invariant across time.
In the individual analysis of each item, reliability ranged from moderate to good (ICC2,1 between 0.50 and 0.89, p < 0.001), with the exception of item 30 “Being aware of what surrounds you”, which had poor reliability (Supplemental Online Material II). During the interviews, the individuals had difficulty understanding the meaning of “being aware”, confusing it with a state of consciousness. The participants were only able to answer the question after an explanation of the concept addressed in item 30. Therefore, we suggest caution when analyzing this item.
Based on the SEM, the variance was 0.29 logits in the intra-observer evaluation and 0.31 logits in the inter-observer evaluation. Such variance occurs when the measure is administered to the same individual on two separate occasions. However, it is related to the standard error of the measurement and not to a change in the clinical condition of the patient. The variation in the MDC was 1.49 logits (intra-observer) and 1.54 logits (inter-observer). This means that any change higher than these values has a 95% chance of being due to a clinical change and not random changes in scores based on repeated testing.29
The score in logits led to a lower measurement error and greater difference between the expected error and minimal detectable change. This means that the likelihood of a diagnostic error is lower when the score in logits is used. The score in logits has the capacity to detect discrepancies between scores, giving the general measure of satisfaction of the individual while also recognizing an erroneous interpretation of satisfaction with regard to activity and participation.10
Intra-observer and inter-observer agreement were also evaluated visually using Bland-Altman plots. Dispersion was found, especially in the inter-observer analyses. Despite the dispersion of the data, one should take into consideration that the SEM was lower than the MDC, which enables differentiating clinical changes in evaluation errors.
Furthermore, while no participant reported any event between evaluations that could have interfered with the results, such as a fall or the loss of a loved one,4 one should bear in mind that satisfaction is a subjective construct that can be easily modified. This may explain the variability demonstrated in the Bland-Altman plots, because the reliability results were adequate.
Regarding concurrent validity, a strong, positive, statistically significant correlation was found between SATIS-Stroke and SS-QOL. The choice of SS-QOL as a comparative measure for the validation of SATIS-Stroke was due to the fact that there is scientific evidence that the 26 items that address activity and participation are valid and reproducible for use on the Brazilian population of stroke survivors.8,22 The strong association between the scales demonstrate that both constructs are similar. Moreover, the reliability of SATIS-Stroke is as satisfactory as that of SS-QOL,22 with the advantage that it addresses all nine of the ICF domains and analyzes satisfaction with regards to activity and participation, which enables identifying the effort and pleasure an individual has when performing daily tasks and being included socially. Through the concepts addressed in this domain, it is possible to identify how individuals manage their daily routines, whether they are able to perform simple tasks or complex tasks that require mental and physical coordination and initiate coordinated actions for the organization of time, space, and necessary materials as well as the ability to decide the execution pace to conclude or maintain the task. This domain also involves the psychological demands of dealing with responsibilities, stress, or crises when performing these tasks.12
SATIS-Stroke had adequate discriminating power, demonstrating that it is capable of differentiating individuals with different levels of activity and participation. In this study, sensitivity is related to the proportion of participants with less participation (SS-QOL score ≤ 80) who have a positive test (SATIS-Stroke score ≤ 0.08). Specificity is related to the proportion of participants with greater participation (SS-QOL score ≥ 80) who have a negative test (SATIS-Stroke score ≥ 0.08). The diagnostic capacity of the logit score regarding the correct identification of different levels of participation was satisfactory, with the cutoff point of ≤ 0.08 having 80.8% sensitivity and 85.2% specificity. Analyzing the discriminatory power of the 26 SS-QOL items, Silva et al.23 found 73.9% sensitivity and 100.0% specificity. Comparing these results, SATIS-Stroke has greater sensitivity for identifying individuals with restrictions to participation compared to the SS-QOL.
To analyze the correct diagnosis accuracy using the cutoff point obtained on the ROC curve, we considered the proportion of false negatives and false positive (Supplemental Online Material III). The false-negative rate when diagnosing the participants in the present study was 14.5% and the false-positive rate was 28.2%. However, the rate of correct diagnoses using the cutoff point of ≤ 0.08 was greater than 70%.
Based on this cutoff point, 40% of the sample had some type of limitation to activities and participation restriction. This finding is in partial agreement with data described in a study involving stroke survivors in the chronic phase conducted by Silva et al.,4 who found that functionally dependent individuals had more limitations to activities and restrictions than functionally independent individuals. As a large portion of the individuals in the present study had moderate to severe motor impairment, a higher percentage of limitations to activities and social restrictions was expected. However, it should be pointed out that SATIS-Stroke is a satisfaction measure that reflects the perception of individuals regarding their performance on activities and situations of daily living,12 unlike other scales, which assess the extent of difficulty in executing specific tasks or demands.
Study limitationsThe use of the score in logits can be seen as a barrier to the implementation of the scale in clinical practice. However, the transformation of the crude score into logits is extremely easy and viable in the clinical setting (Supplemental Online Material I). But this limitation does not compromise the methodological quality of the study.
ConclusionThe Brazilian version of the SATIS-Stroke questionnaire exhibited adequate reliability and agreement, concurrent validity, and diagnostic accuracy. The use of the score in logits is recommended due to the greater sensitivity to clinical changes and lower standard error. These findings are of considerable importance to the rehabilitation of individuals in the chronic phase following a stroke, assisting in the identification of limitations to activities and restrictions to participation, which provides important data for the treatment process.
This study was conducted during a scholarship supported by the CAPES/PROSUP – Brazilian Federal Agency for Support and Evaluation of Graduate Education within the Ministry of Education of Brazil.


