


Tibialis posterior tendinopathy (TPT) is characterised by pain around the medial foot/ankle and difficulties weightbearing.
ObjectiveCompare individuals who have TPT with asymptomatic controls across the International Classification of Functioning, Disability and Health (ICF) domains of body structure and function, activity, participation and personal factors.
MethodsTwenty-two individuals meeting the selection criteria for TPT (86% female, mean ± SD age:43 ± 13 years; body mass index [BMI]:28 ± 7 kg/m2) were compared to 27 controls (93% female, age:44 ± 16 years, BMI:23 ± 5 kg/m2). Standardised differences (and 95% confidence intervals [CIs]) between groups were estimated for outcomes under each ICF domain using Cliff's delta to allow for comparison of the magnitude of deficits across outcomes (>0.47 considered large).
ResultsImpairments in body structure and function in individuals with TPT were accompanied by activity limitations including difficulties due to foot problems (-1.0 (-1.0, -1.0)) and with independent living (-0.8 (-1.0, -0.3)) and greater time to complete stair descent/ascent (-0.6 (-0.8, -0.3)). Considering participation, overall foot-related function (-1.0 (-1.0, -1.0)), ability to participate in activities (-0.7 (-0.08, -0.3)), social restrictions (-0.8 (-1.0, -0.4)) and quality of life (-0.7 (-0.9, -0.5)) were poorer in individuals with TPT.
ConclusionIndividuals with TPT have large impairments in body structure and function, activity limitations and participation restrictions, particularly relating to independent living, mental health and pain. Personal factors appear to contribute to a lesser extent to the TPT presentation. Treatment plans should consider activity and participation limitations in addition to body structure and function.
Tibialis posterior tendinopathy (TPT) is characterised by pain around the medial aspect of the midfoot and ankle and difficulty with activities that involve weight bearing in plantar flexion.1 In some cases, these symptoms may be accompanied by an acquired flatfoot deformity.2 The prevalence of this progressive condition is estimated to be as high as 10% 3 and most frequently affects mid-late aged females.4 Studies of physical impairments associated with TPT compared to pain free control participants have primarily focussed on the foot and ankle, and show lower heel raise height on weight bearing plantar flexion, lower arch height in standing, as well as less plantar flexion-inversion strength and endurance capacity.5
The International Classification of Functioning, Disability and Health (ICF) framework is used to describe health and wellbeing in terms of body structure and function, activity, and participation.6 Considering body structure and function – consistent with impairments in strength and endurance of the tibialis posterior muscle5 – kinematic analysis of walking has shown greater rearfoot eversion and forefoot abduction7,8 along with lower medial longitudinal arch8 in individuals with TPT compared to controls. These impairments in structure and function are likely to impact on the activity (e.g., mobility) and participation (e.g., recreation) domains as well as contextual factors influencing a person's health and wellbeing. In TPT, there is currently little research investigating domains of the ICF beyond body structure and function,5,7,9 and no research that explores contextual factors.5 To characterise TPT adequately, a comprehensive understanding of the contributions of each domain and contextual (personal and/or environmental) factors is required.6
The aim of this study was to characterise TPT using the ICF framework; specifically, to compare body structure and function impairments, activity limitations, participation restrictions, and personal factors between individuals with TPT and asymptomatic controls. It is hypothesised that participants with TPT will have impairments beyond the foot and ankle under the ICF domains.
MethodsParticipantsParticipants aged between 18 and 70 years were recruited from the community between July 2017 and March 2019 in two groups: those who presented with clinical signs of TPT and asymptomatic controls. Participants were screened online and via phone prior to attending one physical screening (completed by a physical therapist; MHR) and subsequent testing session at The University of Queensland. Participants were eligible for the TPT group if they presented with medial foot/ankle pain on most days for at least three months, with an average pain in the previous week greater than 2/10 on a Numeric Rating Scale (NRS) anchored with “no pain” at 0 and “worst pain imaginable” at 10, and pain or inability to perform a single leg heel raise (SLHR) on physical screening. Selection criteria were based on a clinical definition of tendinopathy from the International Scientific Tendinopathy Symposium Consensus (ICON) statement.10 Participants in the TPT group could have pain in other locations provided that their medial foot/ankle pain was their predominant pain.
Asymptomatic control participants who were of same sex and similar age (i.e., within 5 years) were eligible providing they had no lower extremity pain in the previous three months. Participants with a history of lower limb surgery in the previous year and systemic, neurological, or arthritic diseases were excluded from both groups. The study was part of a larger body of work and was approved by The University of Queensland Human Research Ethics Committee. Each participant provided written informed consent prior to participation.
ProceduresOne researcher (MHR) screened participants and those who were eligible completed the physical data collection session and completed questionnaires online. The online questionnaires included the Foot Function Index-Revised (FFI-R), Active Australia Survey (AAS), Pain Catastrophization Scale (PCS), Tampa Scale of Kinesiophobia (TSK), and Assessment of Quality of Life (AQoL). These outcome measures were selected based on previous TPT literature,5 and where measures were lacking, selected commonly used measures in musculoskeletal health.
Measures of body structure and functionFoot-related structure and function were measured using the pain and stiffness subscales of the FFI-R (e.g., how severe was your foot pain/stiffness before you get up in the morning?). Scores are derived by summing responses on a 5-point scale for 7 items in each subscale and expressed as a percentage of the maximum possible score, with higher scores representing a worse state. The FFI-R (and its subscales) has been shown to have good clinimetric properties in assessment of patients with foot problems.11,12
Measures of activityActivity limitations due to foot problems were evaluated using the difficulties subscale of the FFI-R (e.g., how much difficulty did your foot problems cause you climbing stairs?) (11 items). Scores were calculated as above. To further characterise activity limitations, during the physical data collection session, participants were asked to descend and then ascend a flight of 20 stairs (not assisted by placing hands on the railing), and time taken to complete the test was recorded. The intensity of pain before, during, and after the test (using the NRS) was recorded. Timed stair-climb tests have been shown to adequately assess physical function with excellent reliability.13
The AAS was used to measure total number of minutes of physical activity performed in the preceding week, and to classify participants as inactive (0 minutes) or participating in insufficient (<150 minutes) or sufficient (>150 minutes) amounts of moderate to vigorous physical activity.14 The self-administered AAS demonstrates acceptable levels of test-retest reliability14 and validity.15
Finally, the independent living domain (4 items) of the AQoL was used to obtain a measure of participants’ quality of life relating to living independently. The AQoL has six domains: independent living, relationships, mental health, coping, pain, and senses (the latter 2 were not used in this study due to using the FFI-R pain and stiffness subscales) and demonstrates appropriate levels of construct validity16 and reliability.17 Domains are scored separately and combined for an overall score with higher scores representing greater impairment in quality of life.16,18
Measures of participationThe social restrictions (e.g., how much of the time did you limit social activities due to foot problems?) (6 items) and activity limitations (e.g., how much of the time did you limit your outdoor activities because of foot problems?) (3 items) subscales of the FFI-R were used to measure foot-related participation restrictions. Participation in personal relationships was evaluated with the relationships subscale (3 items) and the AQoL (total) was used to obtain an overall indication of general health-related quality of life. In addition, we included the total FFI-R score as a measure of foot-health related quality of life.
Personal factorsPersonal factors, including the mental health (4 items) and coping (3 items) domains of the AQoL, were used to obtain an indication of personal contextual factors that influence how individuals experience a condition. To further contextualise the individual pain experience, we asked participants to complete the PCS and the TSK. The PCS is a valid and reliable measure,19 comprised of 13 items pertaining to three domains; rumination, magnification, and helplessness.20 Total scores range from 0 to 52 where 52 represents a high level of catastrophizing.20 The TSK is a valid and reliable measure of pain related fear of movement or (re)-injury – it applies only to those in pain (i.e., the TPT group).21 Total scores range between 17 and 68. Higher scores indicate greater levels of fear of movement.22 A total score >37 indicates significant fear of movement.22
Statistical analysisIndividual participant data were plotted in box and whisker plots for visual inspection – given the small sample size. All statistical analyses were undertaken in R version 4.0.3 (R Core Team, Vienna, Austria).23 Independent t-tests were used to determine differences in demographic characteristics between groups. The Hodges-Lehmann method was used to estimate median differences between groups with 90% confidence intervals (CIs)24 and Cliff's delta (d) was used to determine the standardised difference between groups for each outcome measure. Cliff's d provides a robust non-parametric effect size (ES) measure, which is an estimate of the standardised difference between groups,25 and allows for comparison across measures with different scales and distributions. Values of Cliff's d range from 1 to -1, with values of 1 indicating all values from k > l, and values of -1 indicating all values from k < l. Cliff's d (and 95% confidence interval, CI) was calculated using the effsize package,26 with values interpreted as small 0.147, moderate 0.33, and large 0.474.27
ResultsParticipantsTwenty-two participants (19 [86%] females) met the selection criteria for TPT and were compared to 27 (25 [93%] females) asymptomatic controls (Fig. 1).

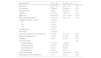
The two groups were similar in age, sex composition, and height, but body mass and body mass index (BMI) were higher in those with TPT (mean difference (95% CI) in body mass ∼17 (7, 27) kg) (Table 1). Number of SLHR repetitions was less in those with TPT compared to controls (mean difference (95% CI) ∼11 (-14, -8 repetitions)). There were no differences between groups with regards to pain medication use in the previous 48 hours, regular medication use, diabetes, hormonal status, or arch height index.
Demographic characteristics of participants by group.
| Characteristic | TPTn = 22 | Controln = 27 | p |
|---|---|---|---|
| Age, years | 43.3 ± 12.7 | 43.7 ± 15.6 | 0.91 |
| Sex, female | 19 (86.4) | 25 (92.6) | 0.47 |
| Study foot, left | 5 (22.7) | 9 (33.3) | 0.41 |
| Height, m | 1.70 ± 0.1 | 1.66 ± 0.1 | 0.19 |
| Mass, kg | 80.6 ± 20.5 | 63.7 ± 13.6 | <0.01 |
| Body mass index, kg/m2 | 27.9 ± 6.9 | 23.0 ± 4.6 | <0.01 |
| Symptom duration, months† | 13 (6-51) | - | - |
| 3-6 | 3 (13.6) | - | - |
| 6-12 | 7 (31.8) | - | - |
| >12 | 12 (54.5) | - | - |
| Average pain† | 4 (3-6) | - | - |
| Worst pain† | 7 (5-8.25) | - | - |
| Used pain medication in last 48 hours | 3 (13.6)^ | 3 (11.1)^^ | 0.80 |
| Regular medication use | 7 (31.8) | 5 (18.5) | 0.28 |
| Diabetes | 1 (4.5) | 0 (0.0) | 0.26 |
| Hormonal status | 0.19 | ||
| Premenopausal | 10 (45.5) | 14 (51.9) | |
| Perimenopausal | 7 (31.8) | 5 (18.5) | |
| Postmenopausal | 1 (4.5) | 6 (22.2) | |
| Not applicable | 4 (18.2) | 2 (7.4) | |
| Arch Height Index | 0.31 (0.03) | 0.32 (0.03) | 0.20 |
| Single leg heel raise repetitions | 11 ± 7 | 22 ± 4 | <0.01 |
Participants in the TPT group had a median (IQR) symptom duration of 13 (6 to 51) months. Five participants (23%) with TPT had pain in another location (which was not their predominant pain) and 3 (13%) had bilateral medial ankle pain (Table 1).
Body structure and functionIndividual participant data plots showed substantially higher levels of pain and stiffness in individuals with TPT (Fig. 2A-B) (large ES > -0.47; Table 2).
 and personal contextual factors (C to E). Circles indicate individual participants (control; blue, TPT; red). Abbreviations: FFI-R, foot function index – revised (scale 0-100); TPT, tibialis posterior tendinopathy; pain catastrophising (scale: 0-52).")
Box and whisker plots for body structure and function outcomes (A to B) and personal contextual factors (C to E). Circles indicate individual participants (control; blue, TPT; red). Abbreviations: FFI-R, foot function index – revised (scale 0-100); TPT, tibialis posterior tendinopathy; pain catastrophising (scale: 0-52).
Median (IQR), median difference (95% CI) and effect size (95% CI) for comparisons between TPT and controls.
| TPT | Control | Median difference (95% CI) | Cliff's delta (95% CI) | |
|---|---|---|---|---|
| n = 22 | n = 27 | |||
| Body structure and function | ||||
| FFI-R – Pain /100 | 52.8 (46.6–65.9) | 25.0 (25.0–25.0) | −27.78 (−34.09, −25.00) | −1.00 (−1.00, −0.99) |
| FFI-R – Stiffness /100 | 56.3 (35.9–64.3) | 25.0 (25.0–25.0) | −31.25 (−32.14, −15.63) | −0.86 (−0.98, −0.17) |
| Activity limitations | ||||
| FFI-R – Difficulties /100 | 43.4 (34.0–50.7) | 25.0 (25.0–25.0) | −18.42 (−22.37, −15.28) | −1.00 (−1.00, −1.00) |
| AQoL – Independent living /22 | 6.0 (5.0–7.0) | 4.0 (4.0–4.0) | −2.00 (−2.00, −1.00) | −0.81 (−0.96, −0.31) |
| Stairs – time in seconds | 27.7 (26.1–28.9) | 23.2 (21.7–24.5) | −4.47 (−6.04, −2.75) | −0.63 (−0.83, −0.30) |
| AAS – Total time min | 460.0 (332.5–1100.0) | 660.0 (350.0–955.0) | 30.00 (−230.00, 300.00) | 0.03 (−0.28, 0.34) |
| AAS – Rating † | ||||
| Inactive | 0 (0) | 0 (0) | ||
| Insufficiently active | 2 (9.1) | 1 (3.7) | ||
| Sufficiently active | 20 (90.9) | 26 (96.3) | ||
| Participation restrictions | ||||
| FFI-R – Total /100 | 40.2 (36.5–48.2) | 25.0 (25.0–25.0) | −15.15 (−19.09, −13.11) | −1.00 (−1.00, −0.98) |
| FFI-R – Social restrictions /100 | 34.2 (29.0–50.0) | 25.0 (25.0–25.0) | −9.21 (−11.84, −4.41) | −0.83 (−0.96, −0.42) |
| AqoL – Total /99 | 34.0 (30.0–41.0) | 27.0 (26.0–29.5) | −7.00 (−11.00, −4.00) | −0.74 (−0.89, −0.45) |
| FFI-R – Activity limitations /100 | 30.6 (25.0–33.3) | 25.0 (25.0–25.0) | −5.56 (−7.14, −2.78) | −0.70 (−0.88, −0.31) |
| AqoL – Relationships /13 | 4.0 (3.0–4.0) | 3.0 (3.0- 4.0) | 0.00 (−1.00, 0.00) | −0.27 (−0.51, 0.01) |
| Personal factors | ||||
| AqoL – Mental health /20 | 7.0 (6.5–9.5) | 6.0 (6.0–7.0) | −1.00 (−2.00, 0.00) | −0.41 (−0.65, −0.10) |
| Pain catastrophising scale /52 | 4.0 (2.0–7.0) | 0.0 (0.0–7.0) | −2.00 (−4.00, 0.00) | −0.39 (−0.65, −0.05) |
| AqoL – Coping /15 | 6.0 (6.0–7.0) | 6.0 (5.0–6.0) | −1.00 (−1.00, 0.00) | −0.26 (−0.53, 0.06) |
| Tampa scale of kinesiophobia# | 8 (36.4) | − | − |
Individual participant data plots showed that compared to controls, individuals with TPT had substantially higher levels of foot-related functional difficulties and difficulties with independent living (Fig. 3A, B) (large ES > -0.47; Table 2). Individuals with TPT took approximately 4.5 seconds longer than controls to complete the stair descent/ascent task (Fig. 3C) (large ES >-0.47; Table 2). During the stairs task, 21 (95%) of participants with TPT reported pain, with a median (IQR) pain severity of 3 (1.9 to 4). There were no observable differences between groups in physical activity over the previous week (Fig. 3D) or the proportion of participants who were sufficiently active (p=0.43) (Table 2).
. Circles indicate individual participants (control; blue, TPT; red). Abbreviations: AQoL, Assessment of Quality of Life (scale: independent living (0-22); FFI-R, Foot function index – revised (scale: 0-100); TPT, tibialis posterior tendinopathy.")
Box and whisker plots for activity outcomes (A to D). Circles indicate individual participants (control; blue, TPT; red). Abbreviations: AQoL, Assessment of Quality of Life (scale: independent living (0-22); FFI-R, Foot function index – revised (scale: 0-100); TPT, tibialis posterior tendinopathy.
Individual participant data plots show that social restrictions, activity limitations, overall quality of life, and self-reported foot function (overall) were substantially poorer (represented by higher scores) in individuals with TPT compared to controls (Fig. 4A-D) (large ES >-0.47; Table 2). Participation in personal relationships did not appear to be different between groups (Fig. 4E).
. Circles indicate individual participants (control; blue, TPT; red). Abbreviations: AQoL, Assessment of Quality of Life (scale: mental health (0-20), relationships (0-13), coping (0-15), total (0-99)); FFI-R, Foot function index – revised (scale: 0-100); TPT, tibialis posterior tendinopathy.")
Box and whisker plots for participation outcomes (A to E). Circles indicate individual participants (control; blue, TPT; red). Abbreviations: AQoL, Assessment of Quality of Life (scale: mental health (0-20), relationships (0-13), coping (0-15), total (0-99)); FFI-R, Foot function index – revised (scale: 0-100); TPT, tibialis posterior tendinopathy.
Plots show that individuals with TPT had higher levels of mental health concerns (Fig. 2C) (moderate ES >0.33; Table 2), but there were no demonstrable differences between groups on the coping domain of the AQoL (Fig. 2D). There were no differences between groups for pain catastrophising (Fig. 2E), but eight participants (36.4%) in the TPT group exhibited a high degree of fear of movement or (re)-injury (>37 on the TSK).
DiscussionThis is the first study to consider TPT more broadly than a local foot and ankle concern - using the ICF framework to comprehensively characterise the condition. To date, there has been little consideration of the condition from a biopsychosocial perspective, and no exploration of quality of life. Our findings demonstrate impairments, limitations, and restrictions across all domains of the ICF for those with TPT compared to healthy controls and that when the biopsychosocial model (rather than a biomedical model) is considered, TPT appears to be a heterogenous condition. Specifically, overall, individuals with TPT report significantly greater pain and stiffness and demonstrate greater activity limitations and functional difficulties (slower stair ascent/descent), and restrictions to participation compared to controls. Individuals with TPT also present with significantly poorer quality of life, particularly in relation to independent living, pain, and mental health, although this was more variable.
Current evidence advocates for consideration of factors beyond the biomedical model of health care for effective management of chronic musculoskeletal conditions, that is, beyond impairments in body structure and function.28,29 Psychological features including fear, anxiety, depression, and catastrophisation have been implicated in the development and persistence of chronic musculoskeletal pain and disability,30-32 including a number of tendinopathies.33-35 Our findings suggest that when factors beyond body structure and function are considered, relative contributions of other factors within the ICF model may be more variable amongst those with TPT. Compared to controls, participants with TPT had poorer overall quality of life, particularly with regard to pain, independent living, relationships, and mental health. Our findings suggest that clinicians should consider evaluating quality of life and mental health in patients with TPT, and that pain catastrophisation or kinesiophobia, may not play a significant role in patients’ overall functioning. This is consistent with findings from a similar cohort of individuals with greater trochanteric pain syndrome (95% female, mean age 51), where quality of life, depression, and anxiety were significantly poorer when compared with controls.36 Findings from this study provide preliminary evidence suggesting a psychological component of TPT that has not previously been considered and that clinicians should consider in individual patient when planning interventions. Considering the biopsychosocial model of health,37 future research should go beyond using the AQoL to characterise mental health and consider the distinction between depressive symptoms and anxiety (e.g., clinicians and researchers should consider using scales that separate anxiety and depression i.e., the Hospital Anxiety & Depression Scale).
Body structure and function impairments have been a primary focus of TPT research to date, with impaired tibialis posterior and hip muscle strength being demonstrated in individuals with TPT.5 Impairments in muscle function, including strength, have been associated with limited participation in physical activity in musculoskeletal conditions.38,39 In this study, individuals with TPT had significantly poorer plantar flexor endurance (∼11 fewer repetitions on the SLHR task), were significantly slower to complete the stairs task, and reported significantly greater foot-related activity limitations. Unlike individuals with gluteal tendinopathy,36 participation in self-reported physical activity was not different between individuals with TPT and controls. Comparing these two lower limb tendinopathies that present more so in older women, it is tempting to speculate that specific impairments in the tibialis posterior muscle-tendon unit and local TPT pain, rather than widespread activity-related declines40 contribute to these self-reported activity limitations.
There are some limitations that need to be considered when interpreting the findings of this study. First, due to the cross-sectional design, it cannot be ascertained whether the impairments are a consequence or predisposing factor for the development of TPT. Second, while eligibility criteria did not limit sex or age, our cohort is consistent with previous research. Differences in body mass (which appear to be characteristics of TPT) may contribute to differences between groups on activities that load the tendon. While we aimed to match participants on age and sex, there was a large age range and a small proportion of male participants included in the study. Sample size is admittedly small, however it was not known how prevalent isolated, clinically diagnosed,1,41 TPT was prior to data collection. Finally, we acknowledge that while the questionnaires selected were the most appropriate to characterise TPT, they were not developed from the ICF framework, so subscales had to be fitted to the most appropriate domain based on the included items.
ConclusionIndividuals with TPT have impairments, limitations, and restrictions spanning the domains of the ICF. Impairments in body structure and function were accompanied by poorer self-reported function and quality of life, particularly relating to independent living and pain in those with TPT compared to control. There is some evidence for poorer quality of life relating to mental health in those with TPT, however personal contextual factors do not appear to substantially contribute to the presentation.
The authors would like to thank the participants of the study for their time. BV is supported by the National Health and Medical Research Council (NHMRC) Program Grant (#631717). MHR was supported by the University of Queensland Research Training Program (RTP) Scholarship at the time of data collection.


