To identify potential prognostic factors that may predict clinical improvement of patients treated with different physical therapy interventions in the short-term.
MethodsThis is a prospective cohort study. A total of 616 patients with chronic non-specific low back pain treated with interventions commonly used by physical therapists were included. These patients were selected from five randomized controlled trials. Multivariate linear regression models were used to verify if sociodemographic characteristics (age, gender, and marital status), anthropometric variables (height, body mass, and body mass index), or duration of low back pain, pain intensity at baseline, and disability at baseline could be associated with clinical outcomes of pain intensity and disability four weeks after baseline.
ResultsThe predictive variables for pain intensity were age (β=0.01 points, 95% CI=0.00 to 0.03, p=0.03) and pain intensity at baseline (β=0.23 points, 95% CI=0.13 to 0.33, p=0.00), with an explained variability of 4.6%. Similarly, the predictive variables for disability after four weeks were age (β=0.03 points, 95% CI=0.00 to 0.06, p=0.01) and disability at baseline (β=0.71 points, 95% CI=0.65 to 0.78, p=0.00), with an explained variability of 42.1%.
ConclusionOnly age, pain at baseline and disability at baseline influenced the pain intensity and disability after four weeks of treatment. The beta coefficient for age was statistically significant, but the magnitude of this association was very small and not clinically important.
Low back pain is a highly prevalent condition worldwide, and in some cases, it can be severely disabling.1 Recent studies show that this condition is associated with loss of function and often related to poorly adapted changes in how patients perceive and interpret their pain.2 The Global Burden of Disease identified low back pain as one of the highest-ranking health conditions in terms of years lived with disability.3 In Brazil, the National Household Sample Survey4 pointed to low back pain as the second most prevalent health condition,4 with the prevalence5 of chronic low back pain (present for more than 12 weeks)6 varying between 4.2% and 14.7%. In addition, in 2011, low back pain was listed as the main cause of disability among retirement and accident compensation recipients, with an incidence of 29.96 per 100,000 social security payers. These estimates were more frequent among men and older people.7
An Australian study that included patients with acute low back pain (i.e., with a pain duration of up to six weeks)6 who sought primary health care showed that a higher pain intensity may be associated with female gender, advanced age, intake of medication, and duration of low back pain episode.8 Other studies on prognostic factors and their influence on recovery from low back pain showed several prognostic factors related to low back pain: sociodemographic data such as educational level, age, and gender; physical factors such as pain intensity and perceived disability; psychological factors such as depression, anxiety, fear related to movement, and catastrophizing of symptoms; and occupational factors.9–15 A systematic review that investigated the prognostic factors related to persistent disabling low back pain showed that sociodemographic data (age, gender, smoking, weight, and educational level) could not correctly predict disability in patients with low back pain.16
In summary, prognostic factors can be useful to provide information related to clinical decision making and understanding the process of prediction and definition of groups that may present risks of poor prognosis.16–19 This information is especially important when modifiable prognostic factors are evident. Considering that, as aging increases in the world's population20 and with the estimate that approximately one-third of the adult population is overweight,21 there has been growing interest in the search for these prognostic factors and their association with the recovery in patients with low back pain.16–19 In the same way, it is unclear whether demographic and anthropometric characteristics can influence the rate of clinical improvement in patients with chronic non-specific low back pain. Therefore, the objective of this study is to identify prognostic factors that can predict clinical improvement of pain intensity and disability of patients treated with physical therapy interventions in the short-term.
MethodsStudy designThis is a prospective cohort study. Participants with chronic non-specific low back pain were selected from five randomized controlled trials,22–26 conducted in public and private clinics in Brazil between 2011 and 2014. The studies samples ranged from 8623,25 to 14822,24,26 patients with chronic non-specific low back pain who received the following physical therapy interventions: Pilates,23,25 Kinesio Taping,22,26 McKenzie therapy,24 exercise and manual therapy,22 and education.25 All patients were evaluated by a blinded assessor before and after the treatments, which lasted four weeks on average. All studies were previously approved by the Universidade Cidade de São Paulo (São Paulo/SP, Brazil) Research Ethics Committee (Process numbers: 13469394,24 13508130,25 13610106,23 13603502,26 and 25406322). All patients signed a consent form prior to participation on these trials.
ParticipantsPatients with chronic non-specific low back pain (with a duration of symptoms greater than 3 months) of both genders and aged between 18 and 80 years were included. Patients with any contraindication to physical activity and/or the treatments proposed by the studies were excluded.22–26 Pregnant patients, patients with previous spinal surgery, severe spinal pathologies, and lumbar pain due to nerve root compression were also excluded. For this study, no sample size calculation was performed, since the data were selected from the studies mentioned previously.
Data collectionThe following data included at baseline assessment of all five studies22–26 were included for analysis: (a) sociodemographic data (age, gender, and marital status); (b) anthropometric data (height, body mass, and body mass index – BMI); (c) duration of low back pain; and (d) clinical outcomes (pain intensity and disability) measured at baseline and after four weeks of intervention.
Assessment of the clinical outcomesPain intensityPain intensity was measured in all of the studies22–26 by means of the Pain Numerical Rating Scale composed of 11 points, ranging from 0 (no pain) to 10 points (worst possible pain).27,28 This scale has already been translated and adapted into Brazilian Portuguese and has good levels of reliability: (ICC2,1=0.85, 95% CI: 0.77–0.90), internal consistency (Cronbach's alpha between 0.88 and 0.90), responsiveness (standardized effect size of 1.16), and construct validity. This scale has adequate measurement properties which is similar to the original version.28
DisabilityThe disability associated with chronic low back pain was assessed in all studies22–26 by the Roland Morris Disability Questionnaire.28–30 This questionnaire consists of 24 yes/no questions describing daily situations that patients have difficulty performing due to low back pain.27,29,30 Each affirmative answer corresponds to one point.29,30 The total score is determined by the sum of the affirmative answers and can range from 0 to 24 points, and the higher the score, the greater the disability.29,30 This questionnaire was translated and cross-culturally adapted into Brazilian-Portuguese and has good levels of reliability (ICC2,1=0.94, 95% CI: 0.91–0.96), internal consistency (Cronbach's alpha=0.90), responsiveness (standardized effect size of 0.70), and construct validity. The questionnaire has appropriate measurement properties similar to those of the original version.28
Statistical analysisFor statistical analysis, all of the studies’ data were standardized with the same coding in the Statistical Package for Social Sciences (SPSS) spreadsheets in order to generate a single spreadsheet with all of the data of interest. After that, a descriptive analysis was carried out to determine the sociodemographic and anthropometric characteristics and the duration of symptoms collected at baseline assessment.
Two multivariate linear regression models were built with the following independent variables (age, gender, marital status, BMI, duration of low back pain, pain and disability) measured at baseline and to verify if they could be associated with the dependent variables (pain intensity and disability after four weeks of physical therapy treatments). After that, the categorical variables were coded into dummy variables and a univariate linear regression analysis was performed between the dependent variables and the independent variables. All variables with a value of p≤0.20 were included in the multivariate regression model. For multivariate regression analysis, the Backward elimination method was used, and this model was considered complete when all variables reached a value of p<0.05. The assumptions of linearity, normality and multicollinearity were not violated in both models and were considered present in the occurrence of tolerance lower than 0.10. A test of normal distribution of the multivariate linear regression models were conducted by plotting both residuals and normal distribution.
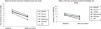
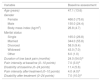
ResultsA total of 616 patients with chronic non-specific low back pain participated in the analysis, of which 466 were women and 150 were men with a mean age of 47 years, predominantly married and overweight. At baseline assessment, patients presented an average of 7.0 points of pain intensity and 11.4 points of disability (Table 1). After approximately four weeks of physical therapy, most patients showed a large improvement in these outcomes. For example, an average reduction of about 40–50% of the pain intensity of the patients was observed (Fig. 1).
Characteristics of the participants (n=616).
| Variable | Baseline assessment |
|---|---|
| Age (years) | 47.1 (13.6) |
| Gender | |
| Female | 466.0 (75.6) |
| Male | 150.0 (24.4) |
| Body mass index (kg/m2) | 26.8 (4.7) |
| Marital status | |
| Single | 165.0 (26.8) |
| Married | 344.0 (55.8) |
| Divorced | 58.0 (9.4) |
| Widowed | 43.0 (7.0) |
| Other | 6.0 (1.0) |
| Duration of low back pain (months) | 24.0 (54.0)a |
| Pain intensity at baseline (0–10 points) | 7.0 (3.0)a |
| Disability at baseline (0–24 points) | 11.4 (5.6) |
| Pain intensity after treatment (0–10 points) | 4.0 (4.0)a |
| Disability after treatment (0–24 points) | 7.0 (10.0)a |
The categorical variables are expressed as number (percentages) and the continuous variables are expressed in mean (standard deviation).
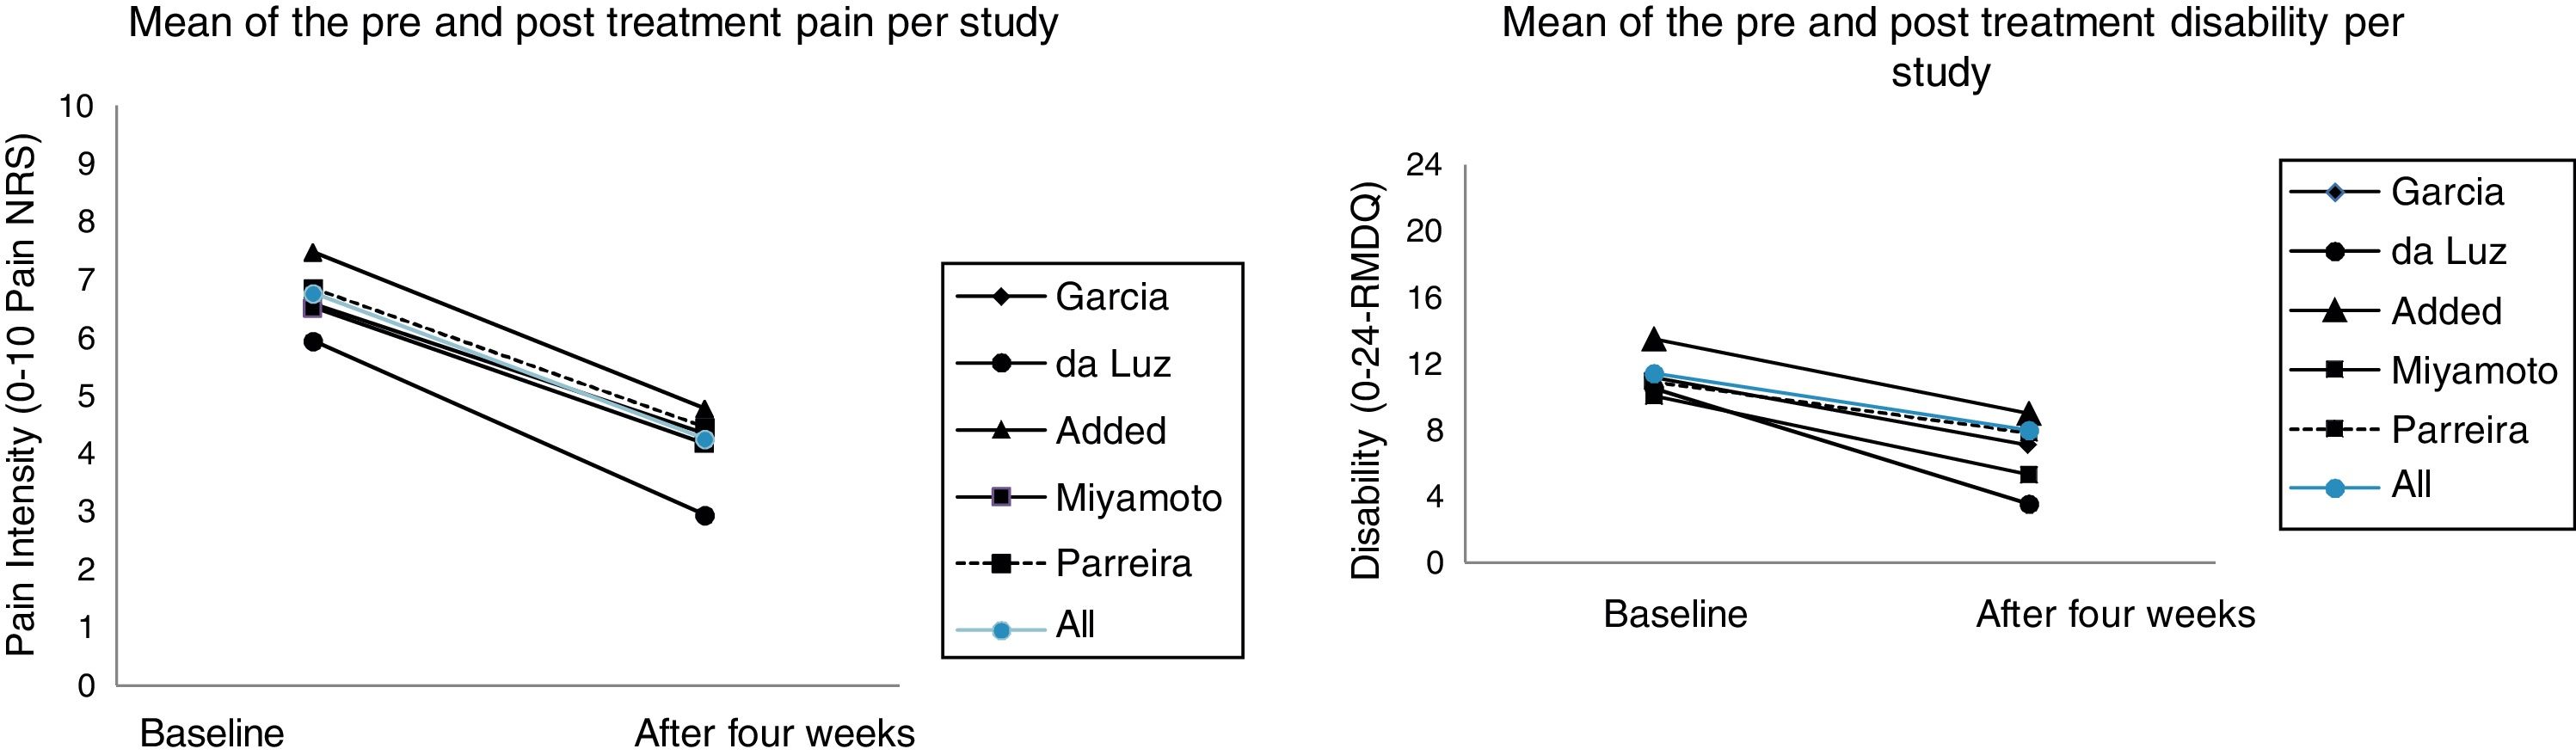
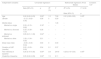
Table 2 shows the results of the univariate and multivariate regression models for pain intensity. The final equation, derived from the multivariate model, to predict pain intensity after four weeks was as follows: pain at 4 weeks=1.87+(0.01×patient age)+(0.23×pain intensity). For example, when comparing an 18-year-old patient to an 80-year-old patient, both with a pain intensity of 6 pain points, the difference in pain intensity would be only 0.6 points on an 11-point scale.
Regression analysis for pain intensity after four weeks.
| Independent variables | Univariate regression | Multivariate regression (Final Model) | Constant: 1.87 | ||||
|---|---|---|---|---|---|---|---|
| Beta (95% CI) | p | R2 (%) | F | R2: 4.6% | F: 14.59 | ||
| Beta (95% CI) | p | ||||||
| Age | 0.02 (0.00–0.03) | 0.00a | 1.3 | 7.90 | 0.01 (0.00–0.03) | 0.03b | |
| Gender | −0.13 (−0.62–0.35) | 0.58 | 0 | 0.29 | – | – | |
| Marital status | 1 | 1.46 | – | – | |||
| Married vs. single | 0.33 (−0.15–0.82) | 0.18a | – | – | – | – | |
| Married vs. divorced | 0.33 (−0.39–1.07) | 0.36 | – | – | – | – | |
| Married vs. widowed | 0.85 (0.01–1.69) | 0.04a | – | – | – | – | |
| Married vs. other | 1.09 (−1.04–3.22) | 0.31 | – | – | – | – | |
| Body mass index | −0.00 (−0.04–0.04) | 0.93 | 0 | 0.00 | – | – | |
| Duration of LBP (months) | 0.00 (−0.00–0.00) | 0.54 | 0.1 | 0.37 | – | – | |
| Pain intensity at baseline | 0.25 (0.15–0.35) | 0.00a | 3.8 | 24.40 | 0.23 (0.13–0.33) | 0.00b | |
| Disability at baseline | 0.05 (0.02–0.09) | 0.00a | 1.5 | 9.11 | – | – | |
Univariate regression:
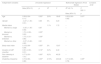
Table 3 shows the results of both univariate and multivariate regression models for disability. The equation for predicting disability after four weeks was: disability at 4 weeks=-2.02+(0.03×patient's age)+(0.71×disability). For example, when comparing an 18-year-old patient to an 80-year-old patient both with a score of 14 points measured by the Roland Morris, the disability gap between these patients will be only 1.9 points.
Regression analysis for disability after four weeks.
| Independent variables | Univariate regression | Multivariate regression (Final Model) | Constant: −2.02 | ||||
|---|---|---|---|---|---|---|---|
| Beta (95% CI) | p | R2 | F | R2: 42.1% | F: 222.11 | ||
| Beta (95% CI) | p | ||||||
| Age | 0.08 (0.04–0.11) | 0.00a | 2.9% | 18.45 | 0.03 (0.00–0.06) | 0.01b | |
| Gender | −0.27 (−1.45–0.91) | 0.65 | 0% | 0.20 | – | – | |
| Marital status | 1.1% | 1.72 | – | – | |||
| Married vs. single | −0.25 (−1.45–0.93) | 0.67 | – | – | |||
| Married vs. divorced | 1.72 (−0.06–3.50) | 0.05a | – | – | |||
| Married vs. widowed | 1.74 (−0.31–3.80) | 0.09a | – | – | |||
| Married vs. other | −0.27 (−5.46–4.90) | 0.91 | – | – | |||
| Body mass index | 0.19 (0.08–0.29) | 0.00a | 2% | 12.67 | – | – | |
| Duration of LBP (months) | 0.00 (−0.00–0.01) | 0.12a | 0.4% | 2.40 | – | – | |
| Pain intensity at baseline | 0.77 (0.53–1.01) | 0.00a | 6.2% | 40.35 | – | – | |
| Disability at baseline | 0.73 (0.66–0.80) | 0.00a | 41.5% | 433.48 | 0.71 (0.65–0.78) | 0.00b | |
Univariate regression:
This study aimed to identify prognostic factors that could predict clinical improvement of pain intensity and disability of patients treated with physical therapy interventions in the short-term in Brazil. Age, pain intensity at baseline and disability at baseline were associated with pain intensity and disability after four weeks of treatment. It is worth noting that the association of age in both models was statistically significant, but the magnitude of this association was very small and not clinically important.
The univariate regression analysis corresponding to the pain intensity outcome showed that the independent variables of age, marital status, pain intensity at baseline, and disability at baseline could influence pain intensity four weeks after the initial assessment. However, when these variables were analyzed from a multivariate model, the only variables capable of predicting a change in pain intensity were age and pain intensity at baseline. Analyzing the R2 value (variability explained), we observed that age and pain intensity only explain 4.6% of the variability of pain intensity after receiving physical therapy treatment. In addition, the Beta coefficient for age, although statistically significant, was very small and not clinically important. Some studies31,32 showed that pain intensity was associated with disability in patients with chronic non-specific low back pain, but there was no association for age and disability.32 Furthermore, the literature31–35 has shown different prognostic factors to predict pain intensity and disability, such as depression, anxiety, and fear of movement. Unfortunately, these variables were not measured on the studies included in our analysis.
An important fact that accompanies the clinical practice of patients with low back pain is the association between age and the worst prognosis of this health condition. However, a study36 with a sample of 39,915 chronic patients that compared the association between age and conditions with chronicity (arthritis, diabetes, hypertension, coronary artery disease, depression, low back pain, chronic lung disease, or cancer) found a significant association between age and chronic lung diseases and cancer and ruled out association with low back pain.36 This data was in agreement with the results of this study in that there seems to be no association between age and chronic low back pain.
In contrast, the disability model can be considered more adequate, as it is able to explain 42.1% of the variability of the disability after the physical therapy treatment. Univariate regression analysis for disability showed that the independent variables age, marital status, BMI, duration of symptoms, pain at baseline, and disability at baseline could influence disability after four weeks of physical therapy. However, when these variables were analyzed from a multivariate model, the only possible variables to predict a change in disability were age and disability at baseline. Beta coefficient values for age, although statistically significant for both multivariate models, were very small and therefore not clinically important. It seems that, despite the belief that age can influence the course of low back pain and treatment results, there is no strong association between this variable and the main clinical outcomes measured in this health condition.
In our results, we found a difference of only 0.6 points for pain intensity (measured on a 0–10 point scale) considering the lowest age (18 years) and the highest age (80 years) of the participants included in the study. Likewise, there was a difference of only 1.9 points for disability (measured on a 0–24 point scale) considering the youngest and oldest study participants. These findings corroborate the idea that age does not have a determining influence on the clinical improvement of patients with chronic non-specific low back pain after four weeks of treatment. Therefore, other patients’ characteristics, i.e., weight, gender, and duration of pain may not influence the prognosis of patients with chronic non-specific low back pain. Thus, physical therapists can predict the clinical improvement of their patients (the prediction reaches 4.6% for pain intensity and 42.1% for disability), from an evaluation using measures of pain intensity and disability, obtained for example, with the Numerical Pain Scale and the Roland Morris Disability Questionnaire.28–30
Previous studies37–40 and clinical beliefs indicate that overweight individuals carry an increased risk of developing chronic low back pain, but more recent studies36,41–43 have been inconclusive. A cohort study42 with a sample of 10,059 women and 8725 men without low back pain and 3883 women and 2662 men with low back pain at baseline found that the relationships between the obesity factor and the occurrence of low back pain at the end of the follow-up in the long term were weak and became non-significant after adjusting for age, schooling, work status, physical activity, smoking, lipid and blood pressure levels. The authors concluded that obesity is unlikely to play an important role in patients with low back pain.42
Another longitudinal study41 with 1385 men analyzed the association between obesity and low back pain and showed that obesity in early adulthood, as well as over a lifetime, increases the risk of developing radiating low back pain, but no association was observed with non-specific low back pain.41 A systematic review16 with a sample of 10,842 patients with acute low back pain evaluated in primary care concluded that the prognostic factors capable of predicting the model of persistent low back pain lasting up to 12 months were high levels of disability at baseline, general health status, psychiatric factors, and presence of non-organic signs. The authors reported that variables related to work environment, presence of pain at baseline, and radiculopathies are seldom used to predict worse results in functional disability. They also reported that a previous history of low back pain and demographic variables are not useful for predicting this outcome.16
Strengths and weaknesses of the studyThis prospective cohort study recruited a representative sample collected from five randomized controlled trials. The literature shows that a sample size of 10–20 patients achieves 80% power to one independent variable in the multivariate regression model.44–46 Thus, sample size for this study could be 50–100 patients for multivariate regression model in pain intensity (being five independent variables in the model) and 70–140 patients in disability (being six independent variables in the model). Therefore, our sample size (n=616) exceeds the number of patients to reach more than 80% power for the results. Although data collection was conducted by different assessors, these studies were conducted by the same research group, in which, the assessors had similar training and the questions of the assessment were similar. Thus, it can minimize the risk of information bias. All five studies are considered to have low risk of bias according to the PEDro Scale.47 It was not possible to collect other potential prognostic factors (e.g. socioeconomic status, use of medication, smoke status, marital status), since we chose to include only the data available in all of the studies.
ConclusionAge, gender, marital status, BMI, and duration of pain do not seem to influence the prognosis of patients with chronic non-specific low back pain. Age, pain intensity at baseline and disability at baseline seem to influence the clinical improvement of patients with chronic non-specific low back pain after four weeks of treatment. It is worth noting that the association of age in both models was statistically significant, but the magnitude of this association was very small and not clinically important.
Conflicts of interestThe authors declare no conflicts of interest.