Journal Information
Visits
773
Vol. 29. Issue 1.
(1 January 2025)
Systematic Review
Full text access
Association between white matter integrity and lower limb motor impairment after stroke: A systematic review
Visits
773
Renata Loureiro-Chavesa,
Corresponding author
, Elissa Embrechtsa, Amber van Hinsberga, Jonas Schrödera, Cathy M. Stinearb,c, Laetitia Yperzeeled,e, Wim Saeysa, Steven Truijena
a Research Group MOVANT, Department of Rehabilitation Sciences & Physical Therapy, University of Antwerp, Universiteitsplein 1 (R314), 2610, Wilrijk, Belgium
b Clinical Neuroscience Laboratory, Department of Medicine, The University of Auckland, New Zealand
c Centre for Brain Research, The University of Auckland, New Zealand
d Faculty of Medicine and Health Sciences, Antwerp University, Antwerp, Belgium
e Department of Neurology, University Hospital Antwerp, Edegem, Belgium
Highlights

  • We reviewed the literature on anatomical substrates of lower limb outcome post-stroke.

  • White matter pathways may help to identify outcome phenotypes post-stroke.

  • Findings suggest that CST integrity is associated with lower limb strength outcome.

  • Studies with longitudinal measures may identify mechanisms driving motor recovery.

  • Future studies should include a range of neural tracts in addition to the CST.

This item has received
Article information
Abstract
Full Text
Bibliography
Download PDF
Statistics
Figures (1)
Tables (4)
Table 1. Risk of bias.
Tables
Table 2. Sample characteristics.
Tables
Table 3. Summary of imaging and motor impairment assessments.
Tables
Table 4. Summary of results and conclusions.
Tables
Show moreShow less
Additional material (1)
Abstract
Background

There is no clear consensus on the anatomical substrates required for recovery from lower limb (LL) impairment after stroke. Knowledge of biomarkers, such as white matter integrity (WMI), could fill this knowledge gap.

Objectives

To analyze the associations between WMI of the corticospinal tract (CST) and corticoreticulospinal pathway (CRP) and LL motor impairment after stroke, in terms of synergistic control and muscle strength. It also explores whether any associations depend on time post-stroke.

Methods

In April 2023, PubMed, Web of Science, and Scopus databases were systematically searched for studies associating WMI of the CST and CRP and LL motor impairment after stroke. Risk of bias was assessed using the Newcastle–Ottawa Quality Assessment Scales.

Results

Nineteen studies were included, 15 about the association between CST and motor impairment, and 4 concerning CST and CRP. Associations were consistently found between higher WMI of the CST and greater muscle strength, but not with synergistic control. There were no clear associations between WMI of the CRP and muscle strength, and associations could not be analyzed for synergistic control. The results could not determine whether the associations are time dependent.

Conclusions

The results of this review supported using WMI of the CST to understand LL muscle strength after stroke. However, the same cannot be said for LL synergistic control due to the small number of studies. There was no clear evidence of an association between WMI of the CRP and LL muscle strength or synergistic control due to mixed results or a lack of studies.

Keywords:
Lower extremity
Magnetic resonance imaging
Motor impairment
Stroke
Systematic review
Full Text
Introduction

Stroke incidence is estimated to be 13.7 million cases per year worldwide and is predicted to increase with population aging.1,2 Lower limb (LL) motor impairment after stroke is diverse. It can be disabling for the performance of activities of daily living and may include the loss of muscle strength and synergistic control (i.e., ability to move out of flexor or extensor muscle synergies).3–6 Generally, people after stroke recover approximately 70 % of the initial motor impairments within the first 6 months. The most significant improvements occur in the 8–12 weeks period, after which a plateau is reached.7,8 However, around 35 % of those with more severe initial impairments do not fit this typical recovery pattern.7

The mechanisms driving recovery of muscle strength and synergistic control after stroke are not completely understood despite ongoing research efforts. Most studies have focused on the upper limb and some prediction models for upper limb outcome have been developed.9–12 However, less is known about the mechanisms of recovery from LL impairment. Researching neurological biomarkers, such as white matter integrity (WMI), has been highlighted as a strategy to fill this knowledge gap.7,13 The road to recovery is heterogeneous because people after stroke can have different initial motor impairment. Reliable biomarkers can provide better understanding of these differences.7,10,13

The corticospinal tract (CST) and corticoreticulospinal pathway (CRP) are the two main descending white matter tracts that influence LL function.14,15 The CST is known to act on distal muscle function, while the CRP on proximal muscle function.14,16 Looking deeply into the relationship between WMI of the CST and CRP, and LL motor impairment may shed light on the anatomical substrates required for good outcomes after stroke.7,13

Diffusion magnetic resonance imaging (dMRI) can analyze WMI through three-dimensional reconstruction. The data originating from dMRI can be used to assess WMI of entire white matter tracts or specific regions of interest regardless of their depth within the brain.17 This enables studying the integrity of tracts or regions of interest that are further from the cortical layer, such as the CRP.

There are several studies about WMI of the CST and CRP and their association with motor impairment.16,18,19 So far, to our knowledge, no systematic review has been conducted to give an overview of the current evidence. Therefore, this study aims to answer the following research question: Is the WMI of the CST and CRP associated with LL muscle strength and synergistic control after stroke? Additionally, we hope to address the following secondary research question: Is the association between the WMI of the CST and CRP and LL motor impairment dependent on the time post-stroke? Investigating whether these associations differ in each phase of recovery is specifically important considering the time dependency of stroke recovery.20–22

MethodsProtocol and registration

This systematic review was registered on PROSPERO CRD42020167167, and it adheres to the guidelines of Preferred Reporting Items for Systematic Reviews and Meta-Analysis statement (PRISMA).23

Key terms and definitions

Motor impairment results were categorized as relating to muscle strength or synergistic control. Muscle strength was defined as the ability to perform voluntary muscle contraction around a single joint and can be assessed by the motricity index (MI), medical research council (MRC) scale, and manual muscle testing (MMT).24 Synergistic control was defined as the ability to move out of pathological flexor or extensor synergies, which can be assessed by the Fugl–Meyer Assessment (FMA) tool.5,6 A lower FMA score is interpreted as worse synergistic control. Synergistic control may also be evaluated using other tools, such as electromyography. However, the focus of this study was on clinical measures considering these are widely used in clinical and research practice.

Diffusion MRI can be used to assess WMI based on random proton diffusion signals within biological tissue.25 This assessment can be done using several dMRI metrics: fractional anisotropy (FA) represents water diffusion direction; apparent diffusion coefficient (ADC) represents overall water diffusion; fiber number (FN) is a synonym to all terms referring to the number of neuronal fibers within a region of interest; and fiber volume (FV) covers all terms referring to the volume of a region of interest composed by white matter.25,26 The biological meaning of higher or lower values varies according to the metric. In this review, we refer to “higher WMI” and “lower WMI”. “Higher WMI” will be used when studies give one or more of these results: higher FA, FN, or FV or lower ADC.27–29 Conversely, “lower WMI” will be used when studies give one or more of these results: lower FA, FN, or FV or higher ADC.27–29

The condition of the WMI can also be categorized based on diffusion metrics and thresholds pre-defined by each study to differentiate between preservation, lesion, and post-stroke degeneration. In our results, we used the descriptors: “+”, referring to the preservation of the tract, “−”, referring to lesion of the tract, and “d” referring to degeneration. For example, CST+ means the CST was preserved, CST− means there was a lesion, and CSTd means there was degeneration of the tract from remote structural damage. The statements about preservation, lesion, and post-stroke degeneration are based on the analysis of regions of interest defined by each study. One study also analyzed the origin of the fibers passing through such region of interest.19 The authors divided the WMI of the CST between CST+, CST−, and CST ± M1. The last category (CST ± M1) refers to a preserved CST but composed of fibers originating from cortical areas other than M1 (e.g., primary sensory cortex, posterior parietal cortex, premotor cortex, prefrontal cortex, somatosensory cortex, and others).19

The phases of recovery were defined to allow contextualization of the studies within the course of post-stroke recovery: hyperacute phase is from 0 to 24 h; acute phase from 1 to 7 days; early subacute phase from 7 days to 3 months; late subacute phase from 3 to 6 months; and chronic phase after 6 months.30

Data sources, search strategy and study selection

A systematic literature search (Supplementary online material S1) was conducted in April 2023 using PubMed, Web of Science, and Scopus databases. A hand-search was performed for the reference lists of the included articles. Cross-sectional and longitudinal cohort studies about the association between the WMI of the CST and CRP and LL motor impairment were eligible for inclusion.

The following additional inclusion criteria were used: 1) adults (≥18 years of age) after first ischemic or hemorrhagic stroke; 2) assessment of the WMI of the CST and/or CRP using dMRI; 3) LL motor impairment assessed with clinical tests; 4) studies in English, Portuguese, Spanish, Dutch, French, or German. The following exclusion criteria were used: 1) meta-analyses, systematic reviews, case reports, or expert opinions; 2) not reporting LL motor impairment results separately from upper limb. Three blinded independent reviewers (R. L-C., E.E, and A. v. H.) screened the studies based on title, abstract, and full text. Disagreements were successfully resolved by discussion.
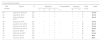
Quality assessment

Risk of bias was assessed independently by two reviewers (R. L-C. and E.E) using the Newcastle–Ottawa Quality Assessment Scales (NOS) for cross-sectional and longitudinal cohort studies (Table 1). The adapted version by Herzog et al. was used for cross-sectional studies.31 A maximum score of nine could be allocated for longitudinal cohort studies and 10 for cross-sectional studies when all criteria were met. Because there are no standard cut-off values, those suggested by McPheeters et al. were used to define the risk of bias and methodological quality (<5: poor, 5–6: moderate, ≥7: good).32 Studies with poor methodological quality were excluded from the written results and discussion to improve the quality of this review, but they are included in the data extraction tables.

Table 1.

Risk of bias.

Cross-sectional studies
Ref. numberAuthorDSelectionComparability  OutcomeTotal (x/10)Label
7
43  Jang et al. 2013 (2)  CS    **    **  *7  Good 
44  Jang et al. 2014  CS    **    **  *7  Good 
46  Jang and Kwon 2015  CS  **    *7  Good 
36  Jang et al. 2015  CS      **  **  *7  Good 
45  Jayaram et al. 2012  CS    **  **  *8  Good 
38  Koyama et al. 2012  CS    **  **  *8  Good 
39  Koyama et al. 2013  CS    **  **  *8  Good 
33  Lee et al. 2005  CS    **    **  6  Mod 
47  Peters et al. 2021  CS  **  **  *9  Good 
18  Seo et al. 2014  CS    **    **  *7  Mod 
41  Yoo et al. 2014  CS        **    **  *5  Mod 
Longitudinal cohort studies
Ref. numberAuthorDSelectionComparability  OutcomeTotal (x/9)Label
35  Cho et al. 2007  C-P          4  Poor 
29  Jang et al. 2013 (1)  C-P      **    6  Mod 
28  Jang et al. 2022  C-R    **    7  Good 
37  Kim et al. 2013  C-R      **    6  Mod 
19  Kim et al. 2018  C-P    **    7  Good 
40  Kwak et al. 2010  C-P            3  Poor 
42  Lee et al. 2021  C-R      **    6  Mod 
34  Yoshioka et al. 2008  C-P          4  Poor 
Data extraction and analyses

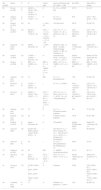
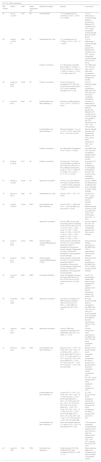
The following data were independently extracted by two reviewers (R. L-C., E.E): sample characteristics (sample size, sex, age, imaging parameters, and LL motor impairment test) (Tables 2 and 3), and results regarding the association between WMI of the CST and CRP and LL motor impairment (Table 4). Results are reported in a compiled manner to give an organized overview of the findings. Table 4 can be consulted for information about statistical tests and their detailed results.

Table 2.

Sample characteristics.

Ref. number  Author  Lesion type  Lesion and lesion side (R = right, L = left)  Sex (M/F)  Age (±SD or range) 
35  Cho et al. 2007  C-P  40CST+ = 10CST ± M1 = 12CST− = 10CSTd = 8  R = 13, L = 27CR, BG  21/19  53 ± 10 
29  Jang et al. 2013 (1)  C-P  21CST+ = 11CST− = 10  R = 12, L = 9Thalamus  6/15  CST+ = 66 ± 9CST− = 48 ± 7 
43  Jang et al. 2013 (2)  CS  54  I = 15H = 39  CR, BG and IC  39/15  54 (32–75) 
44  Jang et al. 2014  CS  82CST+ = 23CST− = 17CSTd = 42  CST+: I = 11, H = 12CST−: I = 5, H = 12CSTd: I = 17, H = 25  CST+: R = 11, L = 12CST−: R = 9, L = 8CSTd: R = 26, L = 16  CST+: 16/7CST−: 9/8CSTd: 29/13  CST+: 58 ± 10CST−: 52 ± 15CSTd: 49 ± 8 
46  Jang and Kwon 2015  CS  Stroke: 32Control: 24  I = 20H = 12  Infarction: ACA = 2, MCA = 16, Mid = 2Haemorrhage: cortical = 2, BG = 6, Thalamus = 4  Stroke: 17/15Control: 13/11  Stroke: 56 ± 15Control: 45 ± 15 
36  Jang et al. 2015  CS  17CRP− = 12CRP+ = 5Control = 23  Subarachnoid: AcoA = 14, PcoA = 1, ACA = 1, ICA = 1  Stroke: 7/10Control: 10/13  Stroke: 50 (34–70)Control: 50 (35–70) 
28  Jang et al. 2022  C-R  MRC < 2 = 21MRC ≥ 2 = 15  MRC < 2: I = 9, H = 12MRC ≥ 2: I = 11, H = 4  MRC < 2: R = 8, L = 13MRC ≥ 2: R = 6, L = 9  MRC < 2: 12/9MRC ≥ 2: 9/6  MRC < 2: 59 ± 12MRC ≥ 2: 61 ± 8 
45  Jayaram et al. 2012  CS  13  NM  R = 7, L = 6Supratentorial  10/3  67 (56–79) 
37  Kim et al. 2013  C-R  37CST+ = 16CST− = 9CSTd = 12  R = 16, L = 21MCA  CST+: 11/5CST−: 7/2CSTd: 10/2  CST+: 57 ± 16CST−: 64 ± 14CSTd: 53 ± 15 
19  Kim et al. 2018  C-P  48CST+ = 16CST ± M1 = 15CST− = 17  CST+: I = 15, H = 1CST ± M1: I = 12, H = 3CST−: I = 13, H = 4  CST+: R = 10, L = 6CST ± M1: R = 10, L = 5CST−: R = 9, L = 8Supratentorial  CST+: 12/4CST ± M1: 9/6CST−: 13/4  CST+: 64 ± 13CST ± M1: 64 ± 12CST−: 68 ± 12 
38  Koyama et al. 2012  CS  15  R = 7, L = 8Thalamus and/or putamen  6/9  57 (31–85) 
39  Koyama et al. 2013  CS  32  Thalamus and/or putamen  16/16  64 (31–88) 
40  Kwak et al. 2010  C-P  Stroke: 53Control: 40  CR and BG  Stroke: 27/26Control: 20/20  Stroke: 56 ±10Control: 59 ±11 
33  Lee et al. 2005  CS  27CST-Ant = 9CST-Central = 9CST-Post = 5CST+ = 4  CST-Ant: R = 3, L = 6CST-Central: R = 2, L = 7CST-Post: R =3, L = 2CST+: L = 4Capsular or Pericapsular  14/13  66 (48–80) 
42  Lee et al. 2021  C-R  42  R = 18, L = 24Supratentorial = 30, Infratentorial = 12  24/18  57±12 
47  Peters et al. 2021  CS  43  NM  L = 43MCA (cortical/subcortical)  27/16  60 ± 11 
18  Seo et al. 2014  CS  CST+ = 8CST− = 8Control = 12  CST+: I = 2, H = 6CST−: I = 6, H = 2  CST+: R = 4, L = 4CST−: R = 6, L = 2  Stroke: 12/4Control:12 males  Stroke: 54 ± 7Control: 27 ± 2 
41  Yoo et al. 2014  CS  57CST+/CRP+ = 3CST−/CRP+ = 4CST+/CRP− = 13CST−/CRP− = 37  Putamen  37/20  CST+/CRP+: 61 ± 6CST−/CRP+: 50 ± 16CST+/CRP−: 61 ± 11CST−/CRP−: 53 ± 11 
34  Yoshioka et al. 2008  C-P  17  Putamen = 9, thalamus = 7, both = 1  12/5  62 (49–74) 

Table description D: design; N: number; SD: standard deviation; CS: cross-sectional; C-R: cohort retrospective; C-P: cohort prospective; NM: not mentioned; I: Infarction; H: Haemorrhage; CST: corticospinal tract; CST+: CST preservation; CST−: CST lesion; CSTd: CST degeneration; CST ± M1: CST preservation without M1 fibers; CST-ant: anterior CST lesion; CST-central: central CST lesion; CST-post: posterior CST lesion; CRP: corticoreticular pathway; CST+/CRP+: CST and CRP preservation; CST−/CRP+: CST lesion and CRP preservation; CST+/CRP−: CST preservation and CRP lesion; CST−/CRP−: CST and CRP lesion; CR: corona radiata; BG: basal ganglia; IC: internal capsule; Mid: midbrain; PVWM: periventricular white matter; ACA: anterior cerebral artery; MCA: middle cerebral artery; PCA: posterior cerebral artery; ICA: internal carotid artery; AcoA: anterior communicating artery; PcoA: posterior communicating artery; MRC: medical research council.

Table 3.

Summary of imaging and motor impairment assessments.

Ref. numberAuthorImagingMotor function
Critical phase (initial)  TPS of imaging (SD)  White matter tract  Critical phase (initial)  TPS of motor assessment  Assessment type 
35  Cho et al. 2007  Early subacute  22 ± 8 d  CST  Acute  Stroke onset & 6 m  MI 
29  Jang et al. 2013 (1)  Early subacute  CST+ = 16 ± 6CST− = 15 ± 5  CST  Acute  Stroke onset & 6 m  MI 
43  Jang et al. 2013 (2)  Chronic  22 (3–125) m  CRP  Chronic  22 (3–125) m  MI 
44  Jang et al. 2014  Chronic  CST+ = 17 ± 14 mCST− = 16 ± 13 mCSTd = 16 ± 14 m  CST  Chronic  CST+ = 17 ± 14 mCST− = 16 ± 13 mCSTd = 16 ± 14 m  MRC 
46  Jang and Kwon 2015  Chronic  8 ± 4 m  CST  Chronic  8 ± 4 m  MI 
36  Jang et al. 2015  Early subacute  6 (3–10) w  CST/ CRP  Early subacute  6 (3–10) w  MI 
28  Jang et al. 2022  Chronic  MRC < 2: 12 ± 13MRC ≥ 2: 11 ± 10  CST/ CRP  Acute & Chronic  MRC < 2: 0.2 ± 0.4 mMRC ≥ 2: 0.4 ± 0.5 m  MRC 
45  Jayaram et al. 2012  Chronic  ≥6 m  CST  Chronic  ≥6 m  FMA 
37  Kim et al. 2013  Early subacute  CST+ = 19 ± 7 dCST− = 18 ± 4 dCSTd = 24 ± 8 d  CST  Acute  24 h & 6 m  MI 
19  Kim et al. 2018  Early subacute  CST+ = 20 ± 10 dCST ± M1 = 15 ± 5 dCST− = 16 ± 7 d  CST  Early subacute  CST+ = 20 ± 10 dCST ± M1 = 15 ± 5 dCST− = 16 ± 7 d& 2 years follow-up  FMA 
38  Koyama et al. 2012  Early subacute  14–18 d  CST  Early subacute  1 m  MRC 
39  Koyama et al. 2013  Early subacute  14–18d  CST  Early subacute  1 m  MRC 
40  Kwak et al. 2010  Early subacute  17 d  CST  Acute  Stroke onset & 17 d  MI 
33  Lee et al. 2005  Acute  2 (1–6) d  CST  Acute  2 (1–6) d  MMT 
42  Lee et al. 2021  Early subacute  2w  CST  Early subacute  2w & 3m  FMA 
47  Peters et al. 2021  Chronic  64 ± 58 m  CST  Chronic  64 ± 58 m  MI 
18  Seo et al. 2014  Chronic  >6 m  CST  Chronic  CST+ = 70 ± 50 mCST− = 39 ± 41 m  MI 
41  Yoo et al. 2014  Early subacute  17 (8–30) d  CST/ CRP  Early subacute  17 (8–30) d  MI 
34  Yoshioka et al. 2008  Acute  3 (1–5) d  CST  Acute  admission & 3 m  MMT 

Table description TPS: time post stroke; SD: standard deviation; NM: not mentioned; CST: corticospinal tract; CST+: CST preservation; CST−: CST lesion; CSTd: CST degeneration; CST ± M1: CST preservation without M1 fibers; CRP: corticoreticular pathway; CP: cerebral peduncle; CR: corona radiata; IC: internal capsule; MRC: medical research council; MI: motricity index; MMT: manual muscle test; FMA: fugl meyer assessment.

Table 4.

Summary of results and conclusions.

CST Vs. Motor impairment
Ref. number  Author  RoB  Motor impairment tool  Statistical analysis  Results  Conclusion 
35  Cho et al. 2007  Poor  MI  Kruskal Wallis  1 m: no differences (P = 0.1604)6 m: CST+ > CSTd (P = 0.0002)  1 m: no differences in muscle strength between groups with different CST conditions.6 m: CST+ group had greater muscle strength than the CSTd group. 
29Jang et al. 2013 (1)ModMIStudent's t Test  1 m: no differences (P = 0.778)6 m: CST+ > CST− (P = 0.003)  1 m: no differences in muscle strength between groups with different CST conditions.6 m: CST + group had greater muscle strength than the CST− group. 
Pearson correlation  6 m: MI positive correlated with FA ratio (r = 0.526, P = 0.014), FN ratio (r = 0.621, P = 0.003), FL ratio (r = 0.733, P = 0.000) of the CST  6 m: WMI of the CST (FA, FN ratio, and FL ratio) was correlated to greater muscle strength at 6 months. 
46  Jang and Kwon 2015  Good  MI  Pearson correlation  Chronic: MI was not correlated to FA, ADC and FN of the whole and anterior CST in the unaffected hemisphere (P > 0.05)  Chronic: Muscle strength was not correlated to WMI of the CST (FA, ADC and FN) of the unaffected hemisphere. 
37Kim et al. 2013ModMIKruskal Wallis and Mann-Whitney U  At onset: no differences6 m: CST+ > CST− > CSTd (P < 0.001)  At onset: no differences in muscle strength between groups with different CST conditions.6 m: muscle strength was greater in the CST+ followed by the CST− and CSTd groups. 
Kruskal Wallis and Mann-Whitney U  Recovery between 1 m => 6 m: CST+ > CST− and CSTd. CST− = CSTd (P < 0.001)  Muscle strength recovery was significantly better for the CST+ group when compared to CST− and CSTd. 
Pearson correlation  6 m: MI positive correlated to FA (P = 0.001, r = 0.520)  6 m: WMI of the CST (FA) was correlated to greater muscle strength at 6 months. 
40  Kwak et al. 2010  Poor  MI  Pearson correlation  At onset and 17 d: MI was not correlated to greater FN and lower FA of the CST in the unaffected hemisphere. (onset => FN: P = 0.399; FA: P = 0.093 /17d => FN: P = 0.111; FA: P = 0.575)  At onset and 17 d: Muscle strength was not correlated to the WMI of the CST (FN and FA) of the unaffected hemisphere. 
47  Peters et al. 2021  Good  MI  Spearman correlation  Chronic: FA of the affected CST was correlated to MI (r = 0.44).FA of the unaffected CST was correlated to MI (r = 0.61).  Chronic: WMI of the affected and unaffected CST were correlated to lower muscle strength. 
18  Seo et al. 2014  Mod  MI  Student's t Test  Chronic: CST+ > CST− (P = 0.041)  Chronic: the CST + group had greater muscle strength. 
44Jang et al. 2014GoodMRCKruskal Wallis and Mann-Whitney U  Chronic: CST+ > CSTd and CST− > CSTd for MRC hip and ankle (P < 0.05).  Chronic: Muscle strength of the hip, knee and ankle was lower in the CSTd group than CST− or CST+. 
Spearman correlation  Chronic: MRC of hip, knee and ankle positive correlated to FA and FN of the CST (FA => hip: P < 0.05, r = 0.49; knee: P < 0.05, r = 0.38; ankle: P < 0.05, r = 0.60/ FN => hip: P < 0.05, r = 0.45; knee: P < 0.05, r = 0.43; ankle: P < 0.05, r = 0.61)  Chronic: WMI of the CST (FA and FN) was correlated to greater lower limb muscle strength. 
38  Koyama et al. 2012  Good  MRC  Ordinal logistic modellingWald's X2 test  Early subacute: People with FA ratio <0.7 in the cerebral peduncle had 65 % probability of having less muscle strength. People with FA ratio >0.9 had 90 % probability of having greater muscle strength.  Early subacute: Greater asymmetry of the WMI of the CST is associated to lower muscle strength. 
39  Koyama et al. 2013  Good  MRC  Ordinal logistic modellingWald's X2 test  Early subacute: People with FA ratio <0.7 in the cerebral peduncle had 60 % probability of having less muscle strength. People with FA ratio >0.9 had 60 % probability of having greater muscle strength.  Early subacute: Greater asymmetry of the WMI of the CST is related to lower muscle strength. 
33  Lee et al. 2005  Mod  MMT  Descriptive Statistics  Acute: Percentage of people with lower MMT was 44 % for CST-Ant, 89 % for CST-Central and 100 % of CST-post  Acute: The percentage of people with lower muscle strength was higher in posterior CST lesions followed by central and anterior CST. 
34  Yoshioka et al. 2008  Poor  MMT  Spearman correlation  At onset: no correlation3 m: MMT positive correlation with FA of the CST (P < 0.05, r = 0.56). MMT not correlated to ADC of the CST.  At onset: muscle strength was not correlated to the WMI of the CST (FA and ADC).3 m: muscle strength was correlated to the WMI of the CST measured by FA but not the ADC. 
45  Jayaram et al. 2012  Good  FMA  Spearman correlation  Chronic: FMA was negatively correlated to FA asymmetry of the CST. (P = 0.005, r = −0.78)  Chronic: People with more asymmetry of the WMI of the CST (FA) had worst synergistic control. 
19Kim et al. 2018GoodFMAKruskal Wallis and Mann-Whitney U  Baseline: CST+ > CST− (P < 0.05), CST ± M1 > CST− (P < 0.05) but CST+ = CST ± M1 for total FMA.CST ± M1 > CST− (P < 0.05), but CST+ = CST− and CST+=CST ± M1 for hip FMA.CST+ > CST− (P < 0.05), but CST− = CST ± M1 and CST+ = CST ± M1 for ankle FMA.  Baseline: CST− group showed worst synergistic control compared to the other 2 groups.CST− group showed worst hip synergistic control compared to CST ± M1.CST− group showed worst ankle synergistic control compared to CST+. 
Kruskal Wallis and Mann-Whitney U  2 years: CST+ > CST− (P < 0.05), CST ± M1 > CST− (P < 0.05), but CST+ = CST ± M1 for total FMACST+ > CST− (P < 0.05) and CST ± M1 > CST− (P < 0.05), but CST=CST ± M1 for hip FMA.CST+ > CST− (P < 0.05), CST ± M1 > CST− (P < 0.05), but CST+ = CST ± M1 for knee FMA.CST+ > CST− (P < 0.05), CST ± M1 > CST− (P < 0.05), but CST+ = CST ± M1 for ankle FMA.  2 y: CST− group showed worst synergistic control and specifically of the knee and ankle compared to the other 2 groups (CST+ and CST ± M1). 
Kruskal Wallis and Mann-Whitney U  Recovery between baseline => 2 years: CST+ > CST− for total leg FMA (P < 0.05).  The change on synergistic control between baseline and 2-year follow-up was only different when comparing CST− and CST+ groups, but not for CST ± M1. 
42  Lee et al. 2021  Mod  FMA  Bivariate linear regression  Early subacute: FA of the unaffected CST was correlated to FMA (P < 0,05, r = 0.1).  Early subacute: WMI of the unaffected CST was correlated to synergistic control. 
CST/CRP Vs. Motor impairment
Ref. number  Author  RoB  Motor impairment tool    Results  Conclusion 
43  Jang et al. 2013 (2)  Good  MI  Spearman correlation  Chronic in the unaffected hemisphere: positive correlation with CRP FV (P = 0.021. r = 0.34). No correlation with CRP FA and ADC.Chronic in the unaffected hemisphere: negative correlation with CST ADC (P = 0.015, r = −0.357). No correlation with CST FA and FV.  Chronic: Greater muscle strength was correlated to WMI of the CRP (FV) of the unaffected hemisphere.Chronic: Greater muscle strength was correlated to WMI of the CST (ADC) of the unaffected hemisphere. 
36Jang et al. 2015GoodMIStudent's t Test  Early subacute: CRP+ > CRP− for total leg (P = 0.035) and hip (P = 0.028) MI.Early subacute: CRP+ = CRP− for knee and ankle MI  Early subacute: CRP+ group had greater muscle strength, and specifically of the hip 
Spearman correlation  Early subacute: MI hip positive correlation with CRP FA (P = 0.038, r = 0.348). No correlation between CRP FA, MD or FV and lower limb/knee/ankle MI.  Early subacute: WMI of the CRP (FA) was correlated hip muscle strength. 
41  Yoo et al. 2014  Mod  MI  Kruskal Wallis, Mann-Whitney U  Early subacute: CST+/CRP+ > CST−/CRP−, CST−/CRP+ > CST−/CRP−, CST+/CRP− > CST−/CRP− (P < 0.05).Early subacute: CST+/CRP+ > CST−/CRP+, CST+/CRP+ > CST+/CRP− (P < 0.05)Early subacute: CST−/CRP+ = CST+/CRP−  Early subacute: The CST−/CRP− group had lower muscle strength than all the others.Early subacute: The CST+/CRP+ group had greater muscle strength than the groups CST−/CRP+ and CST+/CRP−.Early subacute: The groups CST−/CRP+ and CST+/CRP− did not differ in terms of muscle strength. 
28Jang et al. 2022GoodMRCMann-Whitney U  Chronic: MRC ≥ 2 > MRC < 2 for FV of unaffected CRP (P < 0,05).Chronic: MRC ≥ 2 = MRC < 2 for FA, ADC, FV of the unaffected CST and FA, and ADC of the unaffected CRPChronic: MRC ≥ 2 = MRC < 2 for FA, ADC, FV of the affected CST and CRP  Chronic: People with greater dorsiflexion muscle strength had greater FV of the CRP of the unaffected hemisphere.Chronic: People with different dorsiflexion muscle strength have similar FA, ADC, FV of the CST of the unaffected hemisphere and FA, and ADC of the CRP of the unaffected hemisphere.Chronic: People with different dorsiflexion muscle strength have similar FA, ADC, FV of the CST and CRP of the affected hemisphere. 
Spearman correlation  Chronic: FV of unaffected CRP (r = 0.521, P < 0.05) and CST (r = 0.399, P < 0.05) positive correlation with MRC.Chronic: FA, ADC of unaffected CRP and CST were not correlated with MRCChronic: FA, ADC and FV of affected CRP and CST were not correlated with MRC  Chronic: Greater dorsiflexion muscle strength was correlated to FV of the CRP and CST of the unaffected hemisphere.Chronic: Dorsiflexion muscle strength was not correlated to FA, ADC of the CRP and CST of the unaffected hemisphere.Chronic: Dorsiflexion muscle strength was not correlated to FA, ADC, FV of the CRP and CST of the affected hemisphere. 

Table description D: design; RoB: risk of bias; Mod: moderate; CST: corticospinal tract; CST+: CST preservation; CST−: CST lesion; CSTd: CST degeneration; CST ± M1: CST preservation without M1 fibers; CRP: corticoreticular pathway;; CRP−: CRP lesion; CRP+: CRP preservation; CST-ant: anterior CST lesion; CST-central: central CST lesion; CST-post: posterior CST lesion; MRC: medical research council; MI: motricity index; MMT: manual muscle test; FMA: fugl meyer assessment; WMI: white matter integrity; FA: fractional anisotropy; FN: fiber number; FL: fiber length; ADC: apparent diffusion coefficient; FV: fiber volume; MD: mean diffusivity

ResultsStudy selection

A total of 4145 studies were found after deduplication and hand-search. A total of 48 studies were selected based on title and abstract and 19 were included after full-text screening. Details can be found in the flowchart (Fig. 1).

Fig. 1.

Flowchart showing the selection process of eligible studies.

(0.21MB).
Study characteristics

Eleven cross-sectional and eight longitudinal cohort studies were included, for a total of 781 people (682 with stroke, 99 healthy controls). Diffusion MRI was acquired in the acute phase in two studies,33,34 in the early subacute in ten,19,29,35–42 and in the chronic in seven.18,28,43–47 The WMI of the CST was assessed in 15 studies,18,19,29,33–35,37–40,42,44–47 of the CRP in one,36 and of both tracts in three (Tables 2 and 3).28,41,43

Motor impairment was assessed in the acute phase in seven studies,28,29,33–35,37,40 in the early subacute in six,19,36,38,39,41,42 and in the chronic phase in six.18,43–47 Muscle strength was measured by the MI in 10 studies,18,29,35–37,40,41,43,46,47 MRC in four,28,38,39,44 and MMT in two.33,34 Synergistic control was measured using the FMA in three studies.19,42,45

Risk of bias

Three cross-sectional studies were graded as having “moderate”18,33,41 and eight “good” methodological quality.36,38,39,43–47 The scores ranged from five41 to nine.47 Three longitudinal cohort studies were graded as “poor”,34,35,40 three as “moderate”,29,37,42 and two as “good”.19,28 The scores ranged from three40 to seven (Table 1).19,28 The results of the three cohort studies with poor methodological quality can be found in the data extraction tables to provide a complete overview.34,35,40

An important source of bias was samples that were not representative of the population because they included either ischemic or hemorrhagic strokes. From the 19 studies included, only eight included both types.18,19,28,43–47 Another source of bias was lack of comparability, because only 10 studies corrected for key factors such as age, sex, and spasticity.19,28,29,36–39,42,45,47 Only one of the eight cohort studies included specific information about the drop-out rate.34 In addition, no study had multiple dMRI assessments, meaning there are no data documenting recovery of WMI over time on a same group individuals.

White matter integrity in the early subacute phase: CSTCross-sectional

The association of WMI of the CST with motor impairment was assessed cross-sectionally in the early subacute phase by three studies.19,38,48 Higher CST integrity was associated with greater muscle strength38,48 and better synergistic control.19 One study used the distinction between CST preservation (CST+), CST preservation without M1 fibers (CST ± M1), and CST lesion (CST−).19 The results showed that those with CST lesions (CST−) had worse synergistic control than those with other CST conditions (CST+, CST ± M1).19

Longitudinal

The association of WMI of the CST with motor impairment was assessed longitudinally by three studies.19,29,37 Two studies assessed WMI of the CST in the early subacute phase but motor impairment at the acute and chronic phases.29,37 The third assessed WMI in the early subacute phase and motor impairment in the early subacute and chronic phase.19

Different CST conditions (CST+, CST−, and CSTd) did not show variations in muscle strength in the acute phase.29,37 People with early subacute CST preservation (CST+) had greater muscle strength at the chronic phase than those with other CST conditions (CST−, CSTd).29,37 Likewise, higher WMI of the CST in the early subacute phase was correlated to greater muscle strength at the chronic phase.29,37 The presence of CST lesion resulted in worse synergistic control compared to CST preservation and CST preservation without M1 fibers at the chronic phase follow-up.19

Two studies analyzed recovery during the first six months after stroke.19,37 People with CST preservation had greater muscle strength recovery than those with CST lesions and degeneration over this period.37 The difference in synergistic control between early subacute and chronic phases was only significant when comparing CST lesions and CST preservation, but not for CST preservation without M1 fibers.19

White matter integrity in the early subacute phase: CST and CRPCross-sectional

The association of WMI of the CST and CRP with motor impairment was assessed cross-sectionally in the early subacute phase by two studies.36,41 People with preserved CST and CRP (CST+/CRP+), or either CST (CST−) or CRP lesions (CRP−), had greater muscle strength compared to those with both CST and CRP lesions (CST−/CRP−).41 Those with no lesions (CST+/CRP+) had greater muscle strength than those with either CST or CRP lesion,41 particularly for the hip muscles.36 People with CST or CRP lesions had similar muscle strength.41 The WMI of the CRP in the affected hemisphere was positively correlated to greater muscle strength of the hip.36

White matter integrity in the chronic phase: CSTCross-sectional

The association of WMI of the CST with motor impairment was assessed cross-sectionally in the chronic phase by five studies.18,44–47 Those with CST preservation had greater muscle strength compared to those with CST lesion.18 Those with CST lesion and CST preservation had greater muscle strength of hip flexors, knee extensors, and ankle dorsiflexors than those with CST degeneration.44

Higher WMI of the CST was correlated with greater muscle strength44 and synergistic control.45 In the unaffected hemisphere, there was no correlation between WMI of the CST and muscle strength.46 However, another study found a correlation between the WMI of the CST in either hemisphere and muscle strength.47

White matter integrity in the chronic phase: CST and CRPCross-sectional

The association of WMI of the CST and CRP with motor impairment was assessed cross-sectionally in the chronic phase by two studies.28,43 In the unaffected hemisphere, there was a positive correlation between WMI of the CRP and muscle strength, but a negative correlation between the CST and muscle strength.43

Only one study found distinct results for each of the diffusion metrics.28 Those with similar WMI of the CST and CRP in either hemisphere measured by fractional anisotropy and apparent diffusion coefficient had different dorsiflexion strength.28 The results concerning fiber volume did not follow the same pattern. Those with similar WMI of the CST in either hemisphere or CRP in the affected hemisphere measured by fiber volume had different ankle dorsiflexion strength.28 However, those with higher WMI of the CRP in the unaffected hemisphere, measured by fiber volume, had greater ankle dorsiflexion strength.28

There was no correlation between WMI of the CST and CRP in either hemisphere measured by fractional anisotropy and apparent diffusion coefficient and ankle dorsiflexion strength.28 There was also no correlation between WMI of the CST and CRP in the affected hemisphere measured by fiber volume and ankle dorsiflexion strength.28 However, there was a correlation between WMI of the CST and CRP in the unaffected hemisphere measured by fiber volume and ankle dorsiflexion strength.28

Discussion

This review systematically gathered the current evidence on the associations between the WMI of the CST and CRP and, LL strength and synergistic control after stroke, cross-sectionally and longitudinally in different phases of recovery. The literature showed the following main findings: 1) higher WMI of the CST is associated with greater muscle strength and synergistic control when measured cross-sectionally in the early subacute phase; 2) higher WMI of the CST is associated with greater muscle strength and synergistic control recovery from the early subacute to the chronic phase; 3) higher WMI of the CRP is associated with greater muscle strength when measured cross-sectionally in the early subacute phase; 4) no studies have evaluated associations between longitudinal changes in WMI of the CST and CRP and changes in muscle strength and synergistic control.

The main findings point to an association between higher WMI of the CST and greater muscle strength after stroke. However, the small number of studies addressing synergistic control does not allow for a conclusion. This may be due to most studies reporting synergistic control of the lower and upper limb combined, making them ineligible for this review. The neural control of the lower and upper limbs is known to differ, making an analysis of the neural substrates of motor outcome separately more appropriate.49

A consensus regarding the WMI of the CRP, muscle strength, and synergistic control is not possible due to conflicting results and a general lack of studies. The sparse and conflicting evidence could be explained by a methodological obstacle to assess the CRP. The regions of interest corresponding to the CRP have to be manually delineated on the images during post-processing. In comparison, the selection of the CST can be done based on existing templates, such as the Johns Hopkins University (JHU) atlas.43,50 We argue that the focus on the CST alone may result from pragmatic reasoning, pointing towards an important knowledge gap on anatomical biomarkers of post-stroke outcomes. Therefore, future studies should investigate the associations of the WMI of both the CST and CRP with LL motor impairment.

A trend linking higher WMI in the early subacute phase with greater muscle strength and synergistic control was observed. This was found for early subacute cross-sectional and longitudinal studies that assessed WMI in the early subacute phase and related these scores to motor impairment outcomes in the chronic phase. The study of anatomical substrates that can predict subsequent motor impairment post-stroke has the ultimate goals of informing clinicians and increasing the efficiency of decision-making in rehabilitation. The data gathered suggest that the condition of the CST evaluated in the early subacute phase may contribute to such prediction models for LL recovery. However, the current evidence is inconclusive. In addition, because no study had repeated measures of WMI, longitudinal studies with repeated measures of both WMI and motor impairment are needed. Such studies may help explain recovery of motor impairment over time and, more specifically, the time dependency of the associations between WMI and LL motor impairment post-stroke.

Results could not explain in detail how the WMI of the CST and CRP separately influence synergistic control or muscle strength of the LL. Only one study had a sample divided into groups without any lesion, with CST or CRP lesions, or with both lesions.41 Both tracts contribute to LL motor function differently, with the CST having a more distal action and the CRP more proximal.14,16 For the upper limb of non-human primates, for example, the CST has been related to fine adjustments while the reticulospinal tract (downstream part of the CRP) is related to overall strength.51 Investigating more in depth how the WMI of the CST and CRP post-stroke separately influence LL motor function might help to differentiate between possible outcome phenotypes.

Because only a single a study reported that people with an injured CST have worse synergistic control in comparison to preserved CST with or without absence of M1 fibers, firm conclusions cannot be drawn.19 However, this study does indicate that future research should focus on more than only assessing the CST itself. Detailed information about the origin of damaged or preserved fibers within white matter tracts or whole-brain WMI could also help to explain why some patients have better outcomes than others.

This study contains certain limitations. First, we were only able to include 19 studies. This may be explained by the inaccessibility of MRI measurements for clinical research. Second, we excluded studies with poor methodological quality from the written results and discussion. This decision was made to increase the quality of our systematic review, but it meant excluding three of the 19 studies. Third, we did not include neurophysiological techniques to assess the functional integrity of white matter tracts, such as transcranial magnetic stimulation.52 However, focusing on WMI assessed by dMRI allows for the analysis of deeper brain regions and tracts in comparison to TMS.53

Conclusion

We analyzed the association between WMI of the CST and CRP, and LL muscle strength and synergistic control, after stroke. The relevance of WMI of the CST to LL muscle strength outcomes has been reinforced by the associations found in this review. Results point to an association between higher WMI of the CST in the early subacute phase and greater muscle strength and synergistic control assessed in the chronic phase.

More research is needed into the association between WMI of the CST and synergistic control considering the small number of studies. No consensus was reached concerning the association between WMI of the CRP and LL muscle strength or synergistic control due to inconsistent results or lack of studies, respectively. In addition, this review was not able to answer whether the association between WMI of the CST and CRP and LL motor impairment is time dependent. To fully answer both research questions, longitudinal studies with repeated measures of WMI of CST and CRP, muscle strength, and synergistic control are needed.

Acknowledgements

Jonas Schröder has received a doctoral grant from Research Foundation Flanders (Fonds Wetenschappelijk Onderzoek FWO - 1S64819N). LAETITIA YPERZEELE has received funding from the University of Antwerp, Belgium (DOCPRO project ID: 44607). WIM SAEYS has received funding from the University of Antwerp, Belgium (DOCPRO project ID: 40180).

References
[1]
E. Stevens, E. Emmett, Y. Wang, C. McKevitt, C. Wolfe.
Stroke Alliance Europe, (2017),
[2]
V.L. Feigin, M. Brainin, B. Norrving, et al.
World stroke organization (WSO): global stroke fact sheet 2022.
Int J Stroke, 17 (2022), pp. 18-29
[3]
D. Mozaffarian, E.J. Benjamin, A.S. Go, et al.
Heart Disease and Stroke Statistics—2015 Update: A Report From the American Heart Association.
[4]
S.H. Jang.
The recovery of walking in stroke patients: a review.
Int J Rehabil Res, 33 (2010), pp. 285-289
[5]
S. Brunnstrom.
Motor testing procedures in hemiplegia based on sequential recovery stages.
[6]
T.E. Twitchell.
The restoration of motor function following hemiplegia in man.
[7]
J.M. Veerbeek, C. Winters, E.E.H. van Wegen, G. Kwakkel.
Is the proportional recovery rule applicable to the lower limb after a first-ever ischemic stroke?.
PLoS One, 13 (2018), pp. 1-13
[8]
M.C. Smith, W.D. Byblow, P.A. Barber, C.M. Stinear.
Proportional recovery from lower limb motor impairment after stroke.
Stroke, 48 (2017), pp. 1400-1403
[9]
C.M. Stinear, P.A. Barber, M. Petoe, S. Anwar, W.D. Byblow.
The PREP algorithm predicts potential for upper limb recovery after stroke.
Brain, 135 (2012), pp. 2527-2535
[10]
L.A. Boyd, K.S. Hayward, N.S. Ward, et al.
Biomarkers of stroke recovery: consensus-based core recommendations from the stroke recovery and rehabilitation roundtable.
Neurorehabil Neural Repair, 31 (2017), pp. 864-876
[11]
P. Kumar, M. Prasad, A. Das, et al.
Utility of transcranial magnetic stimulation and diffusion tensor imaging for prediction of upper-limb motor recovery in acute ischemic stroke patients.
Ann Indian Acad Neurol, 25 (2022), pp. 54-59
[12]
M. Domin, B. Hordacre, P. Hok, et al.
White matter integrity and chronic poststroke upper limb function: an ENIGMA stroke recovery analysis.
Stroke, 54 (2023), pp. 2438-2441
[13]
J. Bernhardt, K.S. Hayward, N. Dancause, et al.
A stroke recovery trial development framework: consensus-based core recommendations from the second stroke recovery and rehabilitation roundtable.
Neurorehabil Neural Repair, 33 (2019), pp. 959-969
[14]
J. Mendoza, A. Foundas.
Clinical Neuroanatomy: A Neurobehavioral Approach.
Springer Science & Business Media, (2007),
[15]
K. Takakusaki.
Functional neuroanatomy for posture and gait control.
J Mov Disord, 10 (2017), pp. 1-17
[16]
H.M. Jo, B.Y. Choi, C.H. Chang, et al.
The clinical characteristics of motor function in chronic hemiparetic stroke patients with complete corticospinal tract injury.
NeuroRehabilitation, 31 (2012), pp. 207-213
[17]
A. Honnedevasthana Arun, A. Connelly, R.E. Smith, F. Calamante.
Characterisation of white matter asymmetries in the healthy human brain using diffusion MRI fixel-based analysis.
[18]
J.P. Seo, K.H. Do, G.S. Jung, et al.
The difference of gait pattern according to the state of the corticospinal tract in chronic hemiparetic stroke patients.
NeuroRehabilitation, 34 (2014), pp. 259-266
[19]
A.R. Kim, D.H. Kim, S.Y. Park, et al.
Can the integrity of the corticospinal tract predict the long-term motor outcome in poststroke hemiplegic patients?.
Neuroreport, 29 (2018), pp. 453-458
[20]
S.C. Cramer.
Repairing the human brain after stroke: I. Mechanisms of spontaneous recovery.
Ann Neurol, 63 (2008), pp. 272-287
[21]
G. Kwakkel, B.J. Kollen.
Predicting activities after stroke: what is clinically relevant?.
[22]
G. Kwakkel, B. Kollen, J. Twisk.
Impact of time on improvement of outcome after stroke.
[23]
D. Moher, L. Shamseer, M. Clarke, et al.
Preferred reporting items for systematic review and meta-analysis protocols (PRISMA-P) 2015 statement.
Syst Rev, 4 (2015), pp. 1-9
[24]
R.W. Bohannon.
Muscle strength and muscle training after stroke.
J Rehabil Med, 39 (2007), pp. 14-20
[25]
D. Le Bihan, J.F. Mangin, C. Poupon, et al.
Diffusion tensor imaging: concepts and applications.
J Magn Reson Imaging, 13 (2001), pp. 534-546
[26]
C. Stippich.
Clinical Functional MRI.
[27]
Y. Assaf, O. Pasternak.
Diffusion tensor imaging (DTI)-based white matter mapping in brain research: a review.
J Mol Neurosci, 34 (2008), pp. 51-61
[28]
S.H. Jang, M.K. Cho.
Relationship of recovery of contralesional ankle weakness with the corticospinal and corticoreticular tracts in stroke patients.
Am J Phys Med Rehabil, 101 (2022), pp. 659-665
[29]
S.H. Jang, B.Y. Choi, C.H. Chang, S.H. Kim, M.C. Chang.
Prediction of motor outcome based on diffusion tensor tractography findings in thalamic hemorrhage.
Int J Neurosci, 123 (2013), pp. 233-239
[30]
J. Bernhardt, K.S. Hayward, G. Kwakkel, et al.
Agreed definitions and a shared vision for new standards in stroke recovery research: the stroke recovery and rehabilitation roundtable taskforce.
Int J Stroke, 12 (2017), pp. 444-450
[31]
R. Herzog, M.J. Álvarez-pasquin, C. Díaz, et al.
Are healthcare workers’ intentions to vaccinate related to their knowledge, beliefs and attitudes? A systematic review.
BMC Public Health, 13 (2013),
[32]
A. Totten, J. Wagner, A. Tiwari, C. O'Haire, J. Griffin, M. Walker.
Closing the quality gap: revisiting the state of the science.
Evid Rep Technol Assess (Full Rep), 208 (2012), pp. 1-645
[33]
J.S. Lee, M.K. Han, S.H. Kim, O.K. Kwon, J.H. Kim.
Fiber tracking by diffusion tensor imaging in corticospinal tract stroke: topographical correlation with clinical symptoms.
Neuroimage, 26 (2005), pp. 771-776
[34]
H. Yoshioka, T. Horikoshi, S. Aoki, et al.
Diffusion tensor tractography predicts motor functional outcome in patients with spontaneous intracerebral hemorrhage.
[35]
S.H. Cho, S.H. Kim, B.Y. Choi, et al.
Motor outcome according to diffusion tensor tractography findings in the early stage of intracerebral hemorrhage.
Neurosci Lett, 421 (2007), pp. 142-146
[36]
S.H. Jang, B.Y. Choi, S.H. Kim, C.H. Chang, Y.J. Jung, S.S. Yeo.
Injury of the corticoreticular pathway in subarachnoid haemorrhage after rupture of a cerebral artery aneurysm.
J Rehabil Med, 47 (2015), pp. 133-137
[37]
E.H. Kim, J. Lee, S.H. Jang.
Motor outcome prediction using diffusion tensor tractography of the corticospinal tract in large middle cerebral artery territory infarct.
NeuroRehabilitation, 32 (2013), pp. 583-590
[38]
T. Koyama, M. Tsuji, H. Miyake, T. Ohmura, K. Domen.
Motor outcome for patients with acute intracerebral hemorrhage predicted using diffusion tensor imaging: an application of ordinal logistic modeling.
J Stroke Cerebrovas Dis, 21 (2012), pp. 704-711
[39]
T. Koyama, M. Tsuji, H. Nishimura, H. Miyake, T. Ohmura, K. Domen.
Diffusion tensor imaging for intracerebral hemorrhage outcome prediction: comparison using data from the corona radiata/internal capsule and the cerebral peduncle.
J Stroke Cerebrovas Dis, 22 (2013), pp. 72-79
[40]
S.Y. Kwak, S.S. Yeo, B.Y. Choi, C.H. Chang, S.H. Jang.
Corticospinal tract change in the unaffected hemisphere at the early stage of intracerebral hemorrhage: a diffusion tensor tractography study.
Eur Neurol, 63 (2010), pp. 149-153
[41]
J.S. Yoo, B.Y. Choi, C.H. Chang, Y.J. Jung, S.H. Kim, S.H. Jang.
Characteristics of injury of the corticospinal tract and corticoreticular pathway in hemiparetic patients with putaminal hemorrhage.
BMC Neurol, 14 (2014), pp. 1-6
[42]
J. Lee, H. Kim, J. Kim, H.J. Lee, W.H. Chang, Y.H. Kim.
Differential early predictive factors for upper and lower extremity motor recovery after ischaemic stroke.
Eur J Neurol, 28 (2021), pp. 132-140
[43]
S.H. Jang, C.H. Chang, J. Lee, C.S. Kim, J.P. Seo, S.S. Yeo.
Functional role of the corticoreticular pathway in chronic stroke patients.
Stroke, 44 (2013), pp. 1099-1104
[44]
S.H. Jang, K. Kim, S.H. Kim, S.M. Son, W.H. Jang, H.G. Kwon.
The relation between motor function of stroke patients and diffusion tensor imaging findings for the corticospinal tract.
Neurosci Lett, 572 (2014), pp. 1-6
[45]
G. Jayaram, C.J. Stagg, P. Esser, U. Kischka, J. Stinear, H. Johansen-Berg.
Relationships between functional and structural corticospinal tract integrity and walking post stroke.
Clin Neurophysiol, 123 (2012), pp. 2422-2428
[46]
S.H. Jang, H.G. Kwon.
Change of the anterior corticospinal tract on the normal side of the brain in chronic stroke patients: diffusion tensor imaging study.
Somatosens Mot Res, 32 (2015), pp. 25-30
[47]
D.M. Peters, J. Fridriksson, J.D. Richardson, et al.
Upper and lower limb motor function correlates with ipsilesional corticospinal tract and red nucleus structural integrity in chronic stroke: a cross-sectional, ROI-Based MRI study.
Behav Neurol, 2021 (2021),
[48]
T. Koyama, K. Marumoto, Y. Uchiyama, H. Miyake, K. Domen.
Outcome assessment of hemiparesis due to intracerebral hemorrhage using diffusion tensor fractional anisotropy.
J Stroke Cerebrovas Dis, 24 (2015), pp. 881-889
[49]
E. Binder, M. Leimbach, E.M. Pool, et al.
Cortical reorganization after motor stroke: a pilot study on differences between the upper and lower limbs.
Hum Brain Mapp, 42 (2021), pp. 1013-1033
[50]
J. Soulard, C. Huber, S. Baillieul, et al.
Motor tract integrity predicts walking recovery: a diffusion MRI study in subacute stroke.
Neurology, 94 (2020), pp. E583-E593
[51]
I.S. Glover, S.N. Baker.
Both corticospinal and reticulospinal tracts control force of contraction.
J Neurosci, 42 (2022), pp. 3150-3164
[52]
K.M. Fisher, B. Zaaimi, S.N. Baker.
Reticular formation responses to magnetic brain stimulation of primary motor cortex.
J Physiol, 590 (2012), pp. 4045-4060
[53]
E. Atkinson, J. Škarabot, P. Ansdell, S. Goodall, G. Howatson, K. Thomas.
Does the reticulospinal tract mediate adaptation to resistance training in humans?.
J Appl Physiol, 133 (2022), pp. 689-696

PROSPERO registration no. CRD42020167167.

Copyright © 2024. Associação Brasileira de Pesquisa e Pós-Graduação em Fisioterapia
Download PDF
Idiomas
Brazilian Journal of Physical Therapy
Article options
Tools
Supplemental materials
en pt
Cookies policy Política de cookies
To improve our services and products, we use "cookies" (own or third parties authorized) to show advertising related to client preferences through the analyses of navigation customer behavior. Continuing navigation will be considered as acceptance of this use. You can change the settings or obtain more information by clicking here. Utilizamos cookies próprios e de terceiros para melhorar nossos serviços e mostrar publicidade relacionada às suas preferências, analisando seus hábitos de navegação. Se continuar a navegar, consideramos que aceita o seu uso. Você pode alterar a configuração ou obter mais informações aqui.