


Individuals with Parkinson's disease present arm swing alterations that can adversely affect their locomotion.
ObjectiveTo identify differences in arm swing asymmetry (ASA) between individuals with Parkinson's disease (PD) and healthy individuals and to investigate the relationship between ASA, temporal-spatial gait parameters, and disease progression.
MethodsA literature search was conducted in PubMed, Scopus, ProQuest, Web of Science, and EBSCOhost up to February 2023. Cross-sectional studies evaluating parameters of arm swing (AS) and ASA were included. Methodological quality was assessed using the Critical Appraisal Checklist, and the quality of the evidence was measured with a modified Grading of Recommendations Assessment, Development, and Evaluation.
ResultsFourteen studies were included in the systematic review (1130 participants). Irrespective of the medication phase (ON or OFF) and the type of walk test employed, the meta-analysis showed moderate-quality evidence that individuals with PD have increased ASA amplitude (SMD = 0.84; 95% CI: 0.69, 0.99; I²= 0%).Very low-quality evidence suggests higher ASA velocity (SMD=0.64; 95% CI: 0.24, 1.05; I²=59%) and lower AS amplitude on both the most affected (ES = -1.99, 95% CI: -3.04, -0.94, I2: 91%) and the least affected sides (ES = -0.75, 95% CI: -1.05, -0.44; I²=66%). Meta-regression indicated that ASA is inversely related to disease duration (Z: -2.4892, P< 0.05) and motor symptoms progression (Z: -2.1336, P< 0.05).
ConclusionsRegardless of the medication phase and the type of walk test employed, individuals with PD exhibited greater ASA and decreased AS amplitude than healthy individuals. ASA decreases as the disease progresses and symptoms worsen.
Parkinson's disease (PD) is a neurodegenerative disorder that is rapidly increasing globally and is one of the leading causes of disability.1 Epidemiological studies report that approximately nine million people have PD worldwide,2 and this number is expected to double by 2040.3 The progressive deterioration of dopaminergic neurons in the substantia nigra disrupts the function of the basal ganglia and results in clinical symptoms such as bradykinesia, rest tremor, rigidity, postural instability, and gait abnormalities.4
Gait abnormalities are common in PD and can be considered a public health concern due to their association with falls, dependence, and diminished quality of life.5,6 Most studies on PD and gait impairments focus on lower limb temporospatial parameters and function.7-9 In contrast, there are far fewer studies examining upper limb parameters and their impact on gait, despite the significant role of the upper limbs in bipedal locomotion.10
Regarding the upper limbs, modifications in arm swing (AS) parameters such as asymmetry and reduced amplitude, whether related to angular or linear displacement, are among the most frequently reported in people with PD.11 AS refers to the natural swinging motion of the arms while walking and running, which mainly occurs in the sagittal plane.12 AS contributes to the recovery of gait stability after a disturbance, favors the global stability of human gait, facilitates leg movements, and reduces the metabolic cost of walking.10,13-17 AS abnormalities are present even in the early stages of PD18 and may be used as an independent predictor of falls in people with the disease.12,15,19,20 The decrease in AS amplitude mainly occurs in the most affected side of the body and generates significant movement asymmetry.12 The difference in the swinging motion between the left and right arms, known as arm swing asymmetry (ASA), is particularly relevant. Among other gait parameters, ASA has been proposed as a more dependable indicator of motor dysfunction for early and differential diagnosis and for tracking the progression of PD over time.21,22 Previous studies have demonstrated significant differences in ASA between individuals with early-stage PD and healthy individuals,21 indicating its potential as a diagnostic tool. As upper limb dysfunctions are progressive over time, they can impact overall gait quality, making their study particularly relevant to improving the diagnosis and management of PD. However, the relationship between ASA, lower limb gait parameters, and the progression of PD requires further investigation.
Considering the importance of AS parameters for gait performance, especially in people with PD, this study investigated the differences in ASA and other AS parameters (ASA velocity and AS amplitude) between individuals with PD and their healthy counterparts. Additionally, we analyzed the relationship between ASA, lower limb spatiotemporal gait parameters, and disease progression.
MethodData sources and searchesThis study followed the recommendations for systematic reviews and meta-analysis contained in the PRISMA guidelines,23 Cochrane Collaboration,24 and the Guide for Meta-Analysis and Systematic Reviews of Observational Studies (MOOSE).25 The study protocol was pre-registered in the International Prospective Registry of Systematic Reviews (PROSPERO Protocol n°CRD42022299839) before data collection.
A systematic search was conducted in PubMed, Scopus, ProQuest, Web of Science, and EBSCOhost databases between December 2020 and February 2023. For the literature search, the Boolean operator AND was used to combine specific search terms such as “Parkinson's Disease” and “arm swing”. Within these terms, additional synonyms or associated terms were combined using the OR operator (Supplementary material – Table S.1). Only potential original studies were considered. We did not include data from conferences, theses, dissertations, or non-peer-reviewed/unreviewed/unrefereed preprints.
Eligibility criteriaCross-sectional studies and clinical trials were considered (in the latter case, only baseline data were extracted), with no restriction on language or year of publication. The inclusion criteria were samples of people with PD of any age, sex, time of diagnosis, disease status and medication regimen, who were evaluated during either the ON or OFF medication phases; the presence of a group of healthy individuals matched by age and sex; and an evaluation of the temporospatial parameters of AS, undertaken either in free or treadmill walking. The exclusion criteria were duplicate data, outcomes of interest not measured or not reported, samples of participants with secondary Parkinsonism and/or using deep brain stimulation devices.
Study selectionThe double selection method was used to identify relevant studies for the research. Two researchers (JAEA and CACM) conducted the first selection by independently reviewing titles and abstracts and removing duplicates. The remaining studies were evaluated in the second selection by reading the full text and applying eligibility criteria. Any reviewer disagreements were resolved by consensus or by involving a third reviewer, PMCM.
Data extraction and quality assessmentTwo reviewers independently extracted data from the selected studies using a standardized form. The extracted data were: age, sex distribution, Hoehn and Yahr stage (H&Y), Unified Parkinson's Disease Rating Scale (UPDRS) part III-motor examination, disease duration, the pharmacological condition during evaluation (ON, OFF, or not treated) and outcome measures (ASA amplitude [%], ASA velocity [%], AS amplitude [in degrees/meters] on the most and less affected sides) and methods used for data acquisition, as well as the processing of AS and gait temporospatial variables. When confusing or incomplete data were found, the corresponding author was contacted by e-mail. The data were excluded from the analysis if the authors did not respond.
The methodological quality was analyzed using the Critical Appraisal Checklist from the Joanna Briggs Institute recommended for analytical cross-sectional studies.26 The following criteria were qualitatively evaluated: clarity of the definition of the inclusion criteria, detail of the description of the included subjects, validity and reliability of the exposure measures, objectivity and standardization of the criteria used to measure the treatment condition of confounding factors, validity and reliability of outcome measures, and adequate statistical analysis. For the risk of bias assessment, each component was evaluated and given a rating of “yes,” “no,” “unclear,” or “not applicable.” Based on the ratings, the risk of bias was categorized as high if three components received a “yes” rating, moderate if four to six components received a “yes” rating, and low if seven to eight components received a “yes” rating.26,27
A modified version of the Grading of Recommendations Assessment, Development, and Evaluation (GRADE) was used to assess the certainty of the body of evidence of observational data.28,29 The levels were categorized as “High,” “Moderate,” “Low,” and “Very Low”.30,31 Because descriptive studies were included in each meta-analysis, all were initially categorized as “low.” The following criteria downgraded the quality of the evidence: (1) Risk of bias of included studies (if 25% or more of the included articles present a high risk of bias, that is, a lower score or equal to three points on the Critical Appraisal Checklist from the Joanna Briggs Institute), (2) Inconsistency (if I2 was 50% or greater), (3) Indirectness (if the participants or outcomes of the included studies were heterogeneous); (4) Imprecision (if there was a wide 95% confidence interval including higher and lower AS parameters in either direction) and (5) Risk of publication bias (if Egger test p-value < 0.05). The level of certainty of the evidence was upgraded by one grade if there was a more significant effect size, and the meta-analysis did not present any previous limitation or bias that lowers the quality of evidence.29,31
Data synthesis and analysisThe mean and standard deviation of each AS parameter and the number of PD and healthy individuals were computed to estimate the pooled effect size. The median and interquartile range data were converted to the average and standard deviation following the formula from Luo et al.32 and Wan et al.33 The meta-analysis results are presented as the standardized mean differences, and the calculations were performed using the random-effects model. The Cochrane Q and I2 inconsistency tests assessed statistical heterogeneity between studies, whereby an I2 index greater than 25% indicated moderate heterogeneity, while over 50% was classified as high heterogeneity.24
Based on the diversity of protocols used to assess AS parameters, we conducted a sensitivity analysis in which the medication status (ON/OFF) and the walking test used (free walking, iSAW or treadmill) were considered.
To determine potential moderating variables, we also performed a meta-regression for ASA, in which we considered the findings for disease duration, motor symptoms progression (UPDRS part III - motor examination), gait cadence, and stride length.
The publication bias was assessed using the Egger test in the linear regression analysis of the asymmetry of the Funnel plot.34 The results of the meta-analyses are presented in the Forest plot as the standardized mean difference (SMD) with its corresponding 95% confidence interval (CI). The SMD was used to determine the overall effect size, interpreted according to Cohen35 as follows: 0.2 - 0.5: small effect, 0.5 - 0.8: medium effect, and 0.8 or higher: large effect size. All statistical analyses were conducted using R v4.0.5 and Review Manager 5.4 software, with a significance level set at P< 0.05.
ResultsStudy selectionThe electronic search strategy identified 539 studies. After screening titles and abstracts, we discarded 310 studies because they did not meet the eligibility criteria. The full text of 39 articles was read, with 25 being excluded because they a) included a sample of people evaluated after deep brain stimulation; b) did not report the AS temporal-spatial data; c) presented duplicate data from previous studies; and d) included participants without PD diagnosis (Fig. 1). Thus, 14 studies met the selection criteria and were considered in this systematic review. One study did not fully report the results related to the variable of interest.21 We contacted the author by e-mail, with no response. Therefore, this study was excluded from the main analysis.
Study characteristics
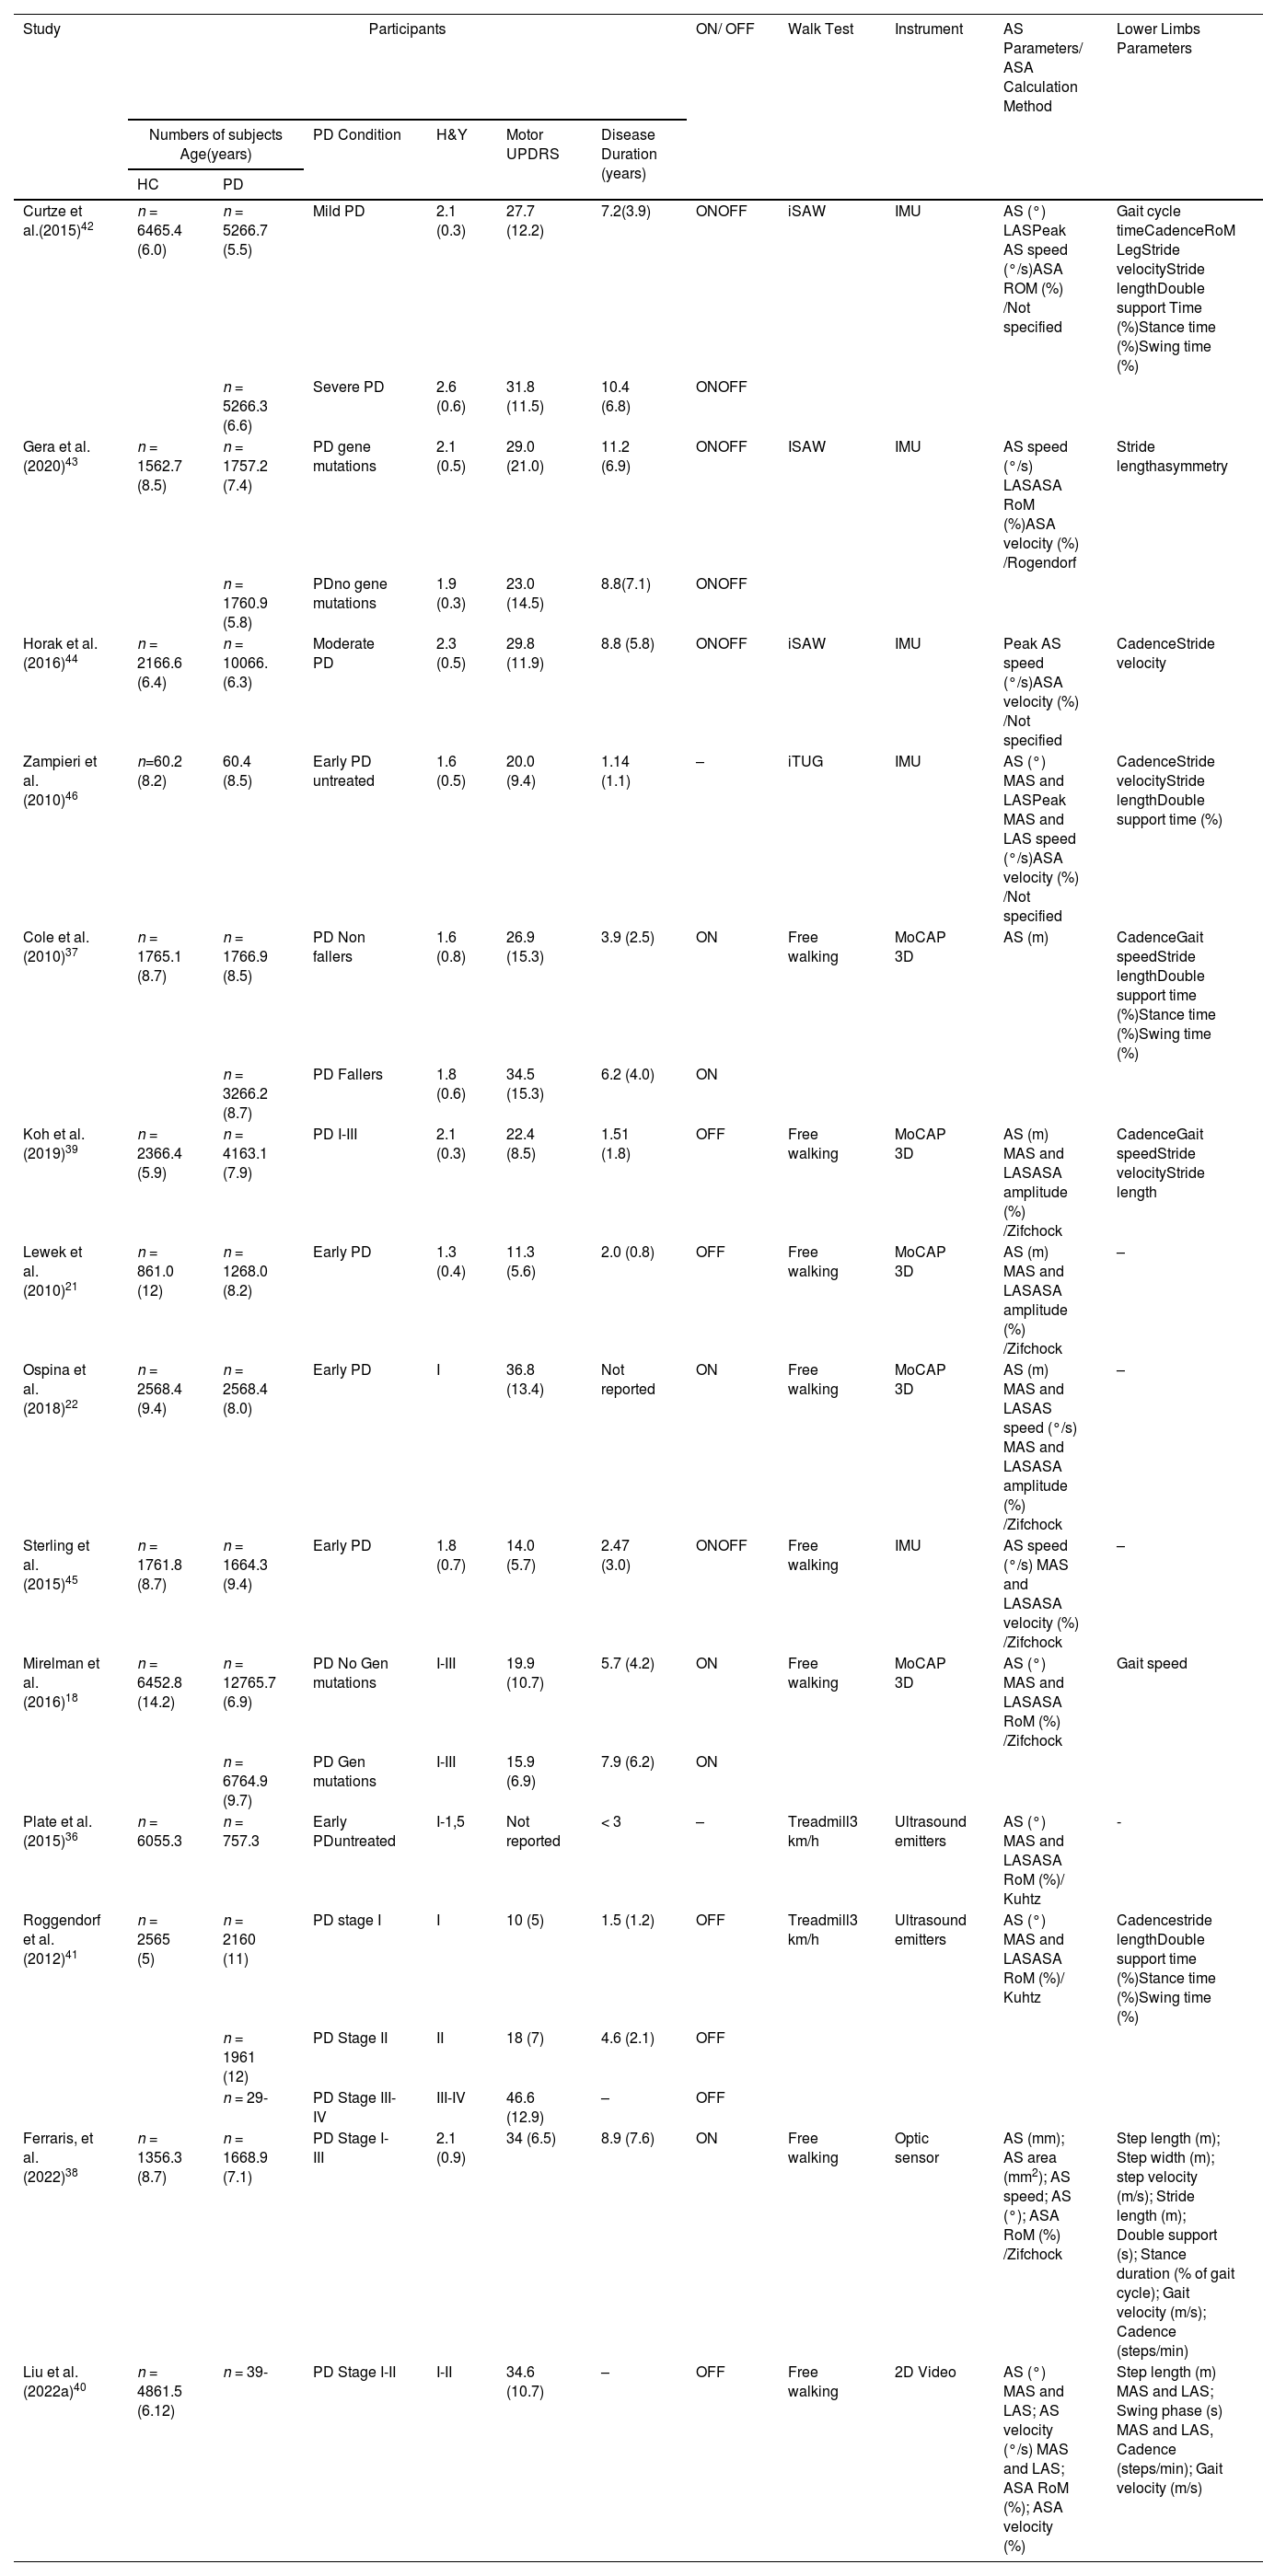
Fourteen studies were included for qualitative analysis, providing data from 1130 participants (Table 1). Regarding the distribution, 718 belonged to the PD group and 412 to the healthy control group. The mean age of participants ranged from 52.8 to 68.9 years. Most studies used H&Y to determine the stage of PD. The stages were presented as an average (between 1.3 and 2.6) or as a range (between I-IV). The average time of PD diagnosis ranged from 1.14 to 11.2 years. Most studies reported the degree of motor impairment using the UPDRS part III - motor examination. The average range was between 14 and 36.8 points in the ON medication phase and between 10 and 46.6 points in the OFF phase. One study did not report UPDRS data.36
Characteristics of the included studies.
| Study | Participants | ON/ OFF | Walk Test | Instrument | AS Parameters/ ASA Calculation Method | Lower Limbs Parameters | |||||
|---|---|---|---|---|---|---|---|---|---|---|---|
| Numbers of subjects Age(years) | PD Condition | H&Y | Motor UPDRS | Disease Duration (years) | |||||||
| HC | PD | ||||||||||
| Curtze et al.(2015)42 | n = 6465.4 (6.0) | n = 5266.7 (5.5) | Mild PD | 2.1 (0.3) | 27.7 (12.2) | 7.2(3.9) | ONOFF | iSAW | IMU | AS (°) LASPeak AS speed (°/s)ASA ROM (%) /Not specified | Gait cycle timeCadenceRoM LegStride velocityStride lengthDouble support Time (%)Stance time (%)Swing time (%) |
| n = 5266.3 (6.6) | Severe PD | 2.6 (0.6) | 31.8 (11.5) | 10.4 (6.8) | ONOFF | ||||||
| Gera et al.(2020)43 | n = 1562.7 (8.5) | n = 1757.2 (7.4) | PD gene mutations | 2.1 (0.5) | 29.0 (21.0) | 11.2 (6.9) | ONOFF | ISAW | IMU | AS speed (°/s) LASASA RoM (%)ASA velocity (%) /Rogendorf | Stride lengthasymmetry |
| n = 1760.9 (5.8) | PDno gene mutations | 1.9 (0.3) | 23.0 (14.5) | 8.8(7.1) | ONOFF | ||||||
| Horak et al.(2016)44 | n = 2166.6 (6.4) | n = 10066.(6.3) | Moderate PD | 2.3 (0.5) | 29.8 (11.9) | 8.8 (5.8) | ONOFF | iSAW | IMU | Peak AS speed (°/s)ASA velocity (%) /Not specified | CadenceStride velocity |
| Zampieri et al. (2010)46 | n=60.2 (8.2) | 60.4 (8.5) | Early PD untreated | 1.6 (0.5) | 20.0 (9.4) | 1.14 (1.1) | – | iTUG | IMU | AS (°) MAS and LASPeak MAS and LAS speed (°/s)ASA velocity (%) /Not specified | CadenceStride velocityStride lengthDouble support time (%) |
| Cole et al.(2010)37 | n = 1765.1 (8.7) | n = 1766.9 (8.5) | PD Non fallers | 1.6 (0.8) | 26.9 (15.3) | 3.9 (2.5) | ON | Free walking | MoCAP 3D | AS (m) | CadenceGait speedStride lengthDouble support time (%)Stance time (%)Swing time (%) |
| n = 3266.2 (8.7) | PD Fallers | 1.8 (0.6) | 34.5 (15.3) | 6.2 (4.0) | ON | ||||||
| Koh et al.(2019)39 | n = 2366.4 (5.9) | n = 4163.1 (7.9) | PD I-III | 2.1 (0.3) | 22.4 (8.5) | 1.51 (1.8) | OFF | Free walking | MoCAP 3D | AS (m) MAS and LASASA amplitude (%) /Zifchock | CadenceGait speedStride velocityStride length |
| Lewek et al. (2010)21 | n = 861.0 (12) | n = 1268.0 (8.2) | Early PD | 1.3 (0.4) | 11.3 (5.6) | 2.0 (0.8) | OFF | Free walking | MoCAP 3D | AS (m) MAS and LASASA amplitude (%) /Zifchock | – |
| Ospina et al. (2018)22 | n = 2568.4 (9.4) | n = 2568.4 (8.0) | Early PD | I | 36.8 (13.4) | Not reported | ON | Free walking | MoCAP 3D | AS (m) MAS and LASAS speed (°/s) MAS and LASASA amplitude (%) /Zifchock | – |
| Sterling et al. (2015)45 | n = 1761.8 (8.7) | n = 1664.3 (9.4) | Early PD | 1.8 (0.7) | 14.0 (5.7) | 2.47 (3.0) | ONOFF | Free walking | IMU | AS speed (°/s) MAS and LASASA velocity (%) /Zifchock | – |
| Mirelman et al. (2016)18 | n = 6452.8 (14.2) | n = 12765.7 (6.9) | PD No Gen mutations | I-III | 19.9 (10.7) | 5.7 (4.2) | ON | Free walking | MoCAP 3D | AS (°) MAS and LASASA RoM (%) /Zifchock | Gait speed |
| n = 6764.9 (9.7) | PD Gen mutations | I-III | 15.9 (6.9) | 7.9 (6.2) | ON | ||||||
| Plate et al.(2015)36 | n = 6055.3 | n = 757.3 | Early PDuntreated | I-1,5 | Not reported | < 3 | – | Treadmill3 km/h | Ultrasound emitters | AS (°) MAS and LASASA RoM (%)/ Kuhtz | - |
| Roggendorf et al. (2012)41 | n = 2565 (5) | n = 2160 (11) | PD stage I | I | 10 (5) | 1.5 (1.2) | OFF | Treadmill3 km/h | Ultrasound emitters | AS (°) MAS and LASASA RoM (%)/ Kuhtz | Cadencestride lengthDouble support time (%)Stance time (%)Swing time (%) |
| n = 1961 (12) | PD Stage II | II | 18 (7) | 4.6 (2.1) | OFF | ||||||
| n = 29- | PD Stage III-IV | III-IV | 46.6 (12.9) | – | OFF | ||||||
| Ferraris, et al. (2022)38 | n = 1356.3 (8.7) | n = 1668.9 (7.1) | PD Stage I-III | 2.1 (0.9) | 34 (6.5) | 8.9 (7.6) | ON | Free walking | Optic sensor | AS (mm); AS area (mm2); AS speed; AS (°); ASA RoM (%) /Zifchock | Step length (m); Step width (m); step velocity (m/s); Stride length (m); Double support (s); Stance duration (% of gait cycle); Gait velocity (m/s); Cadence (steps/min) |
| Liu et al.(2022a)40 | n = 4861.5 (6.12) | n = 39- | PD Stage I-II | I-II | 34.6 (10.7) | – | OFF | Free walking | 2D Video | AS (°) MAS and LAS; AS velocity (°/s) MAS and LAS; ASA RoM (%); ASA velocity (%) | Step length (m) MAS and LAS; Swing phase (s) MAS and LAS, Cadence (steps/min); Gait velocity (m/s) |
Values are mean (SD). PD, Parkinson´s disease; HC, healthy control; H&Y, Hoehn and Yahr Scale (score); UPDRS, Unified Parkinson's Disease Rating Scale (score); AS, arm swing; LAS, least affected side; MAS, most affected side; ASA, arm swing asymmetry; RoM, range of motion; MoCAP, motion capture; IMU, Inertial measurement unit; I-SAW, Instrumented Stand and Walk (ISAW) Test; I-TUG, Instrumented Timed Up and Go test.
Four studies evaluated participants during the ON-medication phase,18,22,37,38 four during the OFF phase,21,39-41 four during both phases42-45 and two studies incorporated participants with untreated PD.36,46 The walking tests used to measure AS parameters varied widely between studies. Four studies used the 7-meter instrumented Stand and Walk Test (iSAW) and instrumented Timed Up and Go test (iTUG),42-44,46 eight studies used a free-walking test (range between 4 and 402 m),18,21,22,37-40,45 and two studies used a treadmill with a speed range between 2 km/h and 4 km/h; in these two latter cases, only data obtained at 3 km/h were considered in our analysis based on the average free walking speed reported for people with PD.47 Regarding the instruments used to measure the AS parameters, five studies used inertial sensors,42-46 six studies used camera systems,18,21,22,37,39,40 two studies used ultrasonic emitters,36,41 and one study used an optic sensor.38
Risk of biasThe median Joanna Briggs Institute Critical Appraisal Checklist tool score was 6 (ranging from 5 to 8), which characterizes a moderate risk of bias (Supplementary material – Table S.2). The questions that received more “no” answers, indicating study limitations, were: “were the criteria for inclusion in the sample clearly defined?”18,21,36,37,42,44-46 and “were the study subjects and the setting described in detail?18,21,36,41,42,44-46 Other less frequent problems were observed in the questions: were strategies to deal with confounding factors stated?”37,38,40,46 and “was appropriate statistical analysis used?”41,44
Quantitative analysisAmong the 14 studies selected for the systematic review, nine analyzed the ASA during walking based on the amplitude of motion measured in degrees and were incorporated into the meta-analysis.18,22,36,38-43 The studies by Curtze et al.42 and Gera et al.43 included two independent groups with PD (Mild/severe and PD-gene mutations/PD-non gene mutations, respectively) and were evaluated under two different conditions (ON/OFF); therefore, four different pairwise comparisons were considered. The sample sizes of shared groups were divided approximately equally between the comparisons keeping the means and standard deviation, according to the Cochrane recommendations for including several study groups.48 Studies by Liu et al.,40 Mirelman et al.,18 and Roggendorf et al.41 included two independent groups with PD (PD stage I-II/III-IV; PD-gene mutations/PD-no gene mutations and PD stage I/II, respectively); therefore, two different pairwise comparisons were considered. The control group sample sizes were distributed proportionally for each comparison.48
The meta-analysis showed with moderate quality of evidence that people with PD presented a significantly higher ASA amplitude than healthy controls with a large effect size and low heterogeneity (SMD=0.84; 95% CI: 0.69, 0.99; I²= 0%; Fig. 2). The Funnel Plot, designed to identify bias and determine the consistency of the ASA results, showed no bias in the results (Egger's regression intercept= 0.9266, P = 0.89). The quality of the evidence was moderate due to the high effect size without downgrading criteria (Table 2).

Forest plot from the meta-analysis of arm swing asymmetry during gait in people with Parkinson's disease versus healthy individuals.
Note: In studies with more than one PD group evaluated each comparison was included in separate pairs, with groups divided approximately equally between the comparisons48
Curtze 2015 (a): PD stage II, ON; (b): PD stage III.IV, ON; (c): PD stage II, OFF; (d): PD stage III-IV; OFF
Gera 2020 (a): PD GBA ON; (b) PD No GBA ON; (c): PD GBA, OFF; (d) PD No GBA, OFF
Liu 2022 (a): PD stage I-II, OFF; (b) PD stage III-IV, OFF
Mirelman 2016 (a): PD No gene mutations, ON; (b) PD gene mutations, ON
Roggendorf 2012 (a): PD stage I, OFF; (b): PD stage II, OFF.
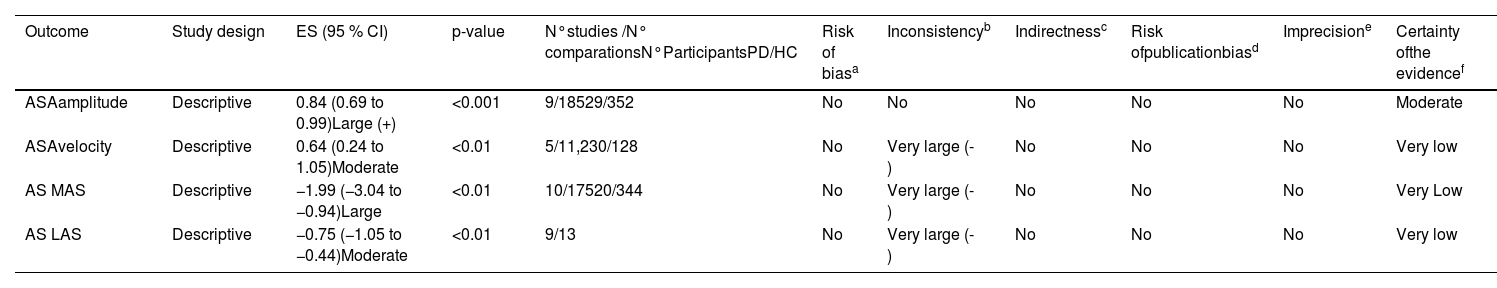
Certainty of evidence for meta-analyzed outcomes.
| Outcome | Study design | ES (95 % CI) | p-value | N°studies /N° comparationsN°ParticipantsPD/HC | Risk of biasa | Inconsistencyb | Indirectnessc | Risk ofpublicationbiasd | Imprecisione | Certainty ofthe evidencef |
|---|---|---|---|---|---|---|---|---|---|---|
| ASAamplitude | Descriptive | 0.84 (0.69 to 0.99)Large (+) | <0.001 | 9/18529/352 | No | No | No | No | No | Moderate |
| ASAvelocity | Descriptive | 0.64 (0.24 to 1.05)Moderate | <0.01 | 5/11,230/128 | No | Very large (-) | No | No | No | Very low |
| AS MAS | Descriptive | −1.99 (−3.04 to −0.94)Large | <0.01 | 10/17520/344 | No | Very large (-) | No | No | No | Very Low |
| AS LAS | Descriptive | −0.75 (−1.05 to −0.44)Moderate | <0.01 | 9/13 | No | Very large (-) | No | No | No | Very low |
Notes: ASA = arm swing asymmetry; AS = arm swing; LAS = least affected side; MAS = most affected side; PD = Parkinson´s disease; HC = healthy control; ES= effect size; CI=confidence interval; (-) = Downgraded by one level; (+) = Upgraded by one level if there is a large effect size (0.8 or higher) without downgrading criteria.
High risk of bias when 25 % or more of the included articles present a score lower or equal to three points, assessed with the Critical Appraisal Checklist from the Joanna Briggs Institute.
Moderte certainty of the evidence= Moderately confident in the estimated difference; Very low certainty of the evidence= very little confidence in the estimated difference (Based on definitions provided by Balshem et al.; 2011).30
In the sensitivity analysis, we considered factors that could have influenced the results of the ASA meta-analysis. We analyzed the influence of the pharmacological status (ON/OFF), and the types of gait tests used to measure the ASA. The ASA analysis revealed a large effect size in the subjects evaluated in the ON stage (ES= 0.86; 95% CI: 0.67, 1.05; I2:0%) and in the OFF stage (ES= 0.81; 95% CI: 0.57, 1.06; I2:1%). No significant differences in ASA were observed between the ON and OFF states (Q = 0.09; P = 0.77; Fig. 3A).
 Forest plot sensitivity analysis showing effect sizes for arm swing asymmetry in relation to ON/OFF medication status in people with Parkinson")
A) Forest plot sensitivity analysis showing effect sizes for arm swing asymmetry in relation to ON/OFF medication status in people with Parkinson's disease during walking. B) Forest plot sensitivity analysis showing effect sizes for arm swing asymmetry in relation to the methods used to determine ASA in people with Parkinson's disease during walking.
Note: In studies with more than one PD group evaluated each comparison was included in separate pairs, with groups divided approximately equally between the comparisons.48
Curtze 2015 (a): PD stage II, ON; (b): PD stage III.IV, ON; (c): PD stage II, OFF; (d): PD stage III-IV, OFF.
Gera 2020 (a): PD gene mutations ON; (b) PD No gene mutations ON; (c): PD gene mutations, OFF; (d) PD No gene mutation, OFF.
Mirelman 2016 (a): PD No gene mutations, ON; (b) PD gene mutations, ON.
Liu 2022 (a): PD stage I-II, OFF; (b) PD stage III-IV, OFF.
Roggendorf 2012 (a): PD stage I, OFF; (b): PD stage II, OFF.
We identified three main ASA measurement tests: free walking, iSAW, and treadmill. Regardless of the test used, people with PD showed a significantly higher ASA amplitude than controls. The iSAW (ES= 0.54; 95% CI: 0.27, 0.8; I2:0%), free walking (ES= 0.95; 95% CI: 0.75, 1.14; I2:0%) and treadmill test (ES= 1.14; 95% CI: 0.65, 1.63; I2:14%) showed low heterogeneity and moderate to large effect sizes (Fig. 3B). Based on the test used to measure ASA during walking, the subgroup analysis showed statistically significant differences between them (Q = 7.34; P≤.05).
Other AS parametersAccording to the meta-analysis of other AS parameters, there is very low-quality evidence indicating that people with PD have higher ASA velocity (ES= 0.64; 95% CI: 0.24, 1.05; I2:59%) and lower AS amplitude (in degrees) on both the most affected (ES= −1.99; 95% CI: −3.04, −0.94; I2: 91%) and the least affected sides (ES=−0.75; 95% CI: −1.05, −0.44; I²=66%) (Supplementary material – Table S.3). The quality of evidence was downgraded because of inconsistency (high statistical heterogeneity; I2>50 %) (Table 2).
Meta-regression ASAWe conducted a meta-regression to analyze the relationship between the ASA amplitude and general gait parameters in people with PD. Five of the nine studies included in the ASA meta-analysis reported stride length and cadence data.38-42 ASA amplitude did not significantly correlate with either cadence or stride length. The meta-regression could not include other gait parameters because too few studies incorporated such variables. Additionally, we observed that the disease duration and the motor performance assessed using the UPDRS inversely and significantly influenced the ASA amplitude in people with PD compared with healthy controls. In other words, ASA diminishes as the disease progresses and symptoms worsen (Supplementary material – Table S.4).
DiscussionThe aim of this systematic review was to determine the differences in ASA between individuals with PD and healthy controls and analyze its relationship with temporal-spatial gait parameters and disease progression.
The results showed moderate quality evidence that people with PD have higher ASA amplitude than healthy controls. With very low-quality evidence, people with PD showed higher ASA velocity and lower AS amplitude on both sides of the body compared to healthy controls. Meta-regression showed that ASA was inversely associated with disease duration and motor symptoms. On the other hand, ASA amplitude did not show a significant association with cadence and stride length. Our results suggest that PD alters the AS during gait asymmetrically and that ASA amplitude, ASA velocity, and AS amplitude are motor parameters capable of differentiating people with PD from those without the disease. In addition, as the disease progresses over time and motor symptoms increase, ASA reduces. Our results are consistent with previous studies,38,49 that showed people with PD have significant differences in the AS amplitude and velocity and ASA during gait compared to healthy individuals.38,40,49 Altered AS parameters compromise postural stability and gait efficiency38 and can be detected early in the course of the disease. Thus, objectively evaluating these parameters could help the early and differential PD diagnosis. Additionally, AS parameters could be used to detect the onset of gait abnormalities,38 prevent adverse consequences, monitor disease progression, and assess the effects of intervention strategies.18,21,22,36,38
Our sensitivity analysis showed that people with PD have more pronounced ASA in both the OFF and ON medication phases. Some studies have shown a significant ASA and AS improvement in response to levodopa in subjects with moderate to severe PD.39,42 However, other studies showed no such changes and argued that these parameters would be related to supraspinal control channels that are partially independent of dopaminergic control.18,47,50 Future studies should address the effects of pharmacological and non-pharmacological therapy on AS parameters and gait at varying stages of the disease. On the other hand, irrespective of the type of walking test used (i.e., free walking, iSAW, or treadmill), individuals with PD exhibited higher ASA than controls. However, we found a greater magnitude of difference and increased heterogeneity in those studies that used a treadmill (Fig. 3B). The speed used on the treadmill is a critical factor because it can influence spatiotemporal lower limb parameters.51,52 Variability in individuals' ability to adapt to the treadmill can result in outcomes heterogeneity.
Our meta-regression showed that as the disease and symptoms progress, ASA decreases. PD is characterized by an initial asymmetric phase, where motor symptoms such as rigidity, bradykinesia, and tremor predominantly affect one side of the body. As the disease progresses, motor symptoms affect both sides more symmetrically, which could explain the decreased ASA with the progression of the disease.53 We expected a significant correlation between ASA amplitude and lower limb gait parameters. We could only include cadence and stride length in the analysis due to the low number of studies incorporating AS and lower limb parameters. Previous studies show that as PD progresses, gait cadence increases and stride length decreases.9 Consistently, motor symptoms become more symmetrical, and a decrease in ASA is expected. Higher cadence9,50,54 and reduced step length have been associated with freezing of gait (FOG),55 impaired gait coordination,52 falls, and decreased quality of life.51,53
LimitationsThis study has some limitations that need to be highlighted. According to GRADE, the certainty of evidence ranges from “very low” (for the other AS parameters) to “moderate” for the main outcome (ASA amplitude); therefore, these findings must be interpreted with caution. We have very little to moderate confidence in the estimated effect, mainly by the type of studies incorporated (observational) and the high heterogeneity. A small number of studies analyzed ASA and AS parameters during gait. The evaluation methods were diverse and may have been a source of data heterogeneity. However, no studies with a high risk of bias were included, and in the main analysis, the sources of heterogeneity were investigated.
Considering the relevance of ASA to gait, we expected to find associations with different temporal-spatial parameters. However, only cadence and stride length were included in the meta-regression; variables such as gait speed, step length, and others were not included in the analysis due to insufficient data. Future studies must focus on establishing the influence of ASA and AS on other gait parameters.
The findings of this study underscore the need for a more objective and quantitative evaluation of AS disorders in people with Parkinson's disease. Because the available instrument-based analysis systems are complex and costly, the increasing demand for objective measurement tools that can be used in clinical and unsupervised settings calls for the development and validation of cost-effective and minimally invasive instruments. Fortunately, the emergence of wearable sensors, smartphones,56and low-cost optical sensors,38 among others, provides a new avenue for clinicians to monitor AS parameters and assess the efficacy of gait rehabilitation interventions.
ConclusionPeople with PD have more pronounced ASA and a lower AS amplitude than healthy individuals, regardless of the ON/OFF medication phase and the walking test used. As the disease progresses and symptoms worsen, ASA tends to decrease. Hence, the assessment of ASA and AS should be considered significant motor parameters to examine gait abnormalities in PD. ASA and AS assessment can be used for early PD diagnosis, monitoring disease progression, and choosing therapeutic interventions for gait rehabilitation in people with PD.
None.


