
To investigate whether abdominal obesity, dynapenia and dynapenic-abdominal obesity are associated to the prevalence of single or recurrent falls in older adults.
MethodsWe analyzed data from 1,046 community-dwelling participants of the SABE Study (Saúde, Bem-estar e Envelhecimento/Health, Well-Being and Ageing). Participants were classified as non-dynapenic/non-abdominal obese, abdominal obese only, dynapenic only, and dynapenic-abdominal obese based on waist circumference (>102cm for men and >88cm for women) and handgrip strength (<26kg for men and <16kg for women). Multinomial logistic regression models were ran to determine associations between dynapenia/obesity/dynapenic-abdominal obesity and single/recurring falls, taking non-fallers as reference.
ResultsAbdominal obesity (RRR=1.90 95% CI: 1.02–3.55), dynapenia (RRR=1.80 95% CI: 1.02–3.19), and dynapenic-abdominal obesity (RRR=2.06 95% CI: 1.04–4.10) were associated with a single fall. A stronger association for dynapenic-abdominal obesity compared to the other two conditions alone was found. Dynapenia was the unique condition associated with recurrent falls (RRR=2.33, 95% CI: 1.13–4.81).
ConclusionThe present findings have important implications for the identification of older adults with a greater chance of falls and can help in the development of rehabilitation strategies. Therefore, abdominal obese, dynapenic, and dynapenic abdominal obese individuals should be target groups for the management of falls and their consequences.
Falls are a public health concern in low and middle income countries and exponentially increase the number of years living with disability. In addition, these countries account for 80% of fall-related mortality.1 Worldwide, approximately one third of older adults have a fall each year and half of these individuals have recurrent falls.2
Even falls attributed to accidents result from interactions between extrinsic (environment) and intrinsic factors such as ageing related physiological changes and presence of certain diseases.3 Several risk factors for falls in older adults are well known such as polypharmacy4 and the use of certain medications,5 alcohol consumption,3 sedentary behaviour,4 slippery floor,6 floor with different levels,6 throw rug,6 living alone,6 low income and level of education,6 joint disease,4 osteoporosis,3 dizziness/vertigo,4,6 cardiovascular problems,6 visual disorders,4 cognitive decline,3 depressive symptoms,3 being a woman4,6 and from an older age,5,6 a previous history of falls4 as well as gait3 and balance impairments.3
Ageing related declines in neuromuscular strength (i.e. dynapenia) and concomitant increase in body fat are important predictors of falls later in life.7–15 The tendency of abdominal fat accumulation,16 even when body weight remains stable,17 have been shown a stronger association with falls than body mass index (BMI).14,15 For example, Mitchell et al.11 found that high BMI values (>30kg/m2) increased the probability of having a fall in older adults. Himes and Reynolds10 also showed that the chances of having a fall increases as BMI classes increase. However, these two studies did not adjust their analyses by measures of body fat distribution. On the other hand, Cho et al.15 and Lin et al.14 showed that abdominal obesity (AO) was independently associated to falls in older adults, when both BMI and waist circumference (WC) were included the analysis. In addition, dynapenia which results from neuromuscular physiological abnormalities and partially by sarcopenia18 is aggravated by AO19,20 and mediated by low grade inflammation.19
Therefore, individual and combined effects of dynapenia and AO may contribute to postural instability defined as a “failure” of the dynamic postural response to volitional or applied disturbances.21,22 In dynapenic individuals, there are abnormalities in patterns of muscular activation and failure to generate adequate neuromuscular strength to recruit movements needed to stabilize the body's centre of mass (CoM) in response to self-initiated and externally triggered disturbances in postural stability (trip or slip).21 Such abnormalities described above in combination to poor postural alignment due to the CoM being positioned more forward in AO individuals may increase the probability of having a fall.23
The joint effect of AO and dynapenia has been denominated as dynapenic-abdominal obesity (D/AO)24 and is consistently associated to negative health outcomes in older adults,25–27 which has been corroborated by findings from our research group.28–30 However, its association with falls has not been fully established. To the best of our knowledge, only one previous study has examined the combined effect of obesity and dynapenia on the physiological risk of falls using the Physiological Profile Assessment. The results of the 5-year follow-up study using data from 674 community-dwelling volunteers in Australia, aged 50–79 years (mean age: 61.4 years) revealed a higher risk of a single fall among dynapenic obese individuals.31 However, the findings were restricted to a relatively young cohort from southern Tasmania and fall events were not ascertained.
Therefore, the aim of the present study was to investigate whether AO, dynapenia and D/AO are associated with single and recurrent falls in older adults.
MethodsData were extracted from the SABE Study (Saúde, Bem-estar e Envelhecimento/Health, Well-Being and Ageing), which is a panel study that began in 2000 with a probabilistic representative sample of the urban population aged 60 years or older residing in Sao Paulo city, Brazil. Detailed descriptions of the study design and sampling have been published previously.32 All participants signed a statement of informed consent. The SABE Study obtained approval from the Human Research Ethics Committee of the Public Health School of the Universidade de Sao Paulo, Sao Paulo, Brazil (protocol number 2044).
The present study used data from 1,344 participants aged 60 and older who took part of the SABE Study in 2010. Participants were excluded due to missing information on falls, handgrip strength (HGS), WC or other covariates. This way, individuals who were incapable of performing the HGS test or remain in a standing position during the WC measurement were excluded. In addition, since our main purpose was to analyze the combined effect of dynapenia and AO, underweight participants (BMI<18.5kg/m2) were excluded to avoid bias in our results, as underweight is an important risk factor for dynapenia and falls. This strategy has been used previously.29,33 Among the 1,344 individuals, 284 were excluded due to a lack of any information mentioned above, and a further 14 were excluded for being underweight, resulting in a final sample of 1,046 individuals.
WC and HGSWC was measured by a trained nutritionist with a non-elastic metric tape at the midpoint between the last rib and iliac crest with the region free of clothing. The participant was instructed to remain in a standing position with arms alongside the body and the measure was taken at the end of the expiratory phase of a breathing cycle.32 AO was defined by WC: >102cm for men and >88cm for women.34 WC has been found to be positively correlated abdominal fat content. It is also a reliable35 and better predictor of visceral fat than BMI.36 In addition, it has been associated with risk of falls even when compared to the gold standard measure, i.e., dual-energy X-ray absorptiometry (DEXA).37
HGS was measured using a hand-held dynamometer (Takei Kiki Kogyio TK 1201). Grip size was adjusted individually so that each participant felt comfortable while squeezing the grip, ensuring that the second articulation of the index finger was at a 90 degrees angle on the handle (90˚ flexion between proximal and middle phalangeal joint).38 The participant was seated with the elbow and forearm supported on a table and the palm facing upward and the dynamometer was placed in the dominant hand. Two maximum strength tests were performed with a 1-min rest interval between trials and the highest value was considered for the analysis.32 Dynapenia was defined based by HGS: <26kg for men and <16kg for women.39 HGS has been widely used as a muscle strength measure40 and it has been considered in Geriatrics and Gerontology as the fifth vital sign.40 Furthermore, low HGS (dynapenia) is a reliable predictor of negative health outcomes in older adults such as decline in mobility,41 poor lower limb function42 and falls.7,9,43 However, despite its good capacity to predict negative health outcomes later in life, it is important to highlight that HGS capacity to measure the overall muscle strength is limited.44
WC and HGS measurements were used to categorize participants into the following four groups: non-dynapenic/non-abdominal obese (ND/NAO) (reference group), abdominal obese only (AO), dynapenic only (D) and dynapenic-abdominal obese (D/AO).
FallsWe adopted the definition of the Kellogg International Work Group on the Prevention of Falls by the Elderly6: ‘A fall is an event which results in a person coming to rest inadvertently on the ground or other lower level and other than as a consequence of a violent blow; loss of consciousness or sudden onset of paralysis’. Self-reported information on falls in the previous 12 months was obtained during a face-to-face interview conducted by a trained interviewer at the participants’ homes. The participants were asked about the occurrence of fall, and in case of an affirmative answer, they were further asked about the number of falls they have suffered. Self-reported falls has been widely used in epidemiological studies,45–47 despite being a measure potentially associated with recall bias. Based on their answers, participants were classified as non-fallers, single fallers (one fall) or recurrent fallers (two or more falls).
CovariatesThe socio-demographic characteristics investigated were sex, age, marital status (with/without conjugal life), sufficient income for expenses (yes/no) and years of schooling.
The level of physical activity was evaluated using the Brazilian version of the International Physical Activity Questionnaire (IPAQ).48 Individuals who performed <150min of moderate activity or <75min of vigorous activity per week were considered sedentary.49 Based on the IPAQ, metabolic equivalent (MET) – min/week was estimated and used as a continuous variable. Alcohol consumption was assessed by asking participants if they were non-drinkers, drank once a week, drank 2–6 days a week or drank every day.
Cognitive function was evaluated using the modified version50 of the Mini Mental State Examination (MMSE) due to the low level of schooling in the Brazilian population of older adults. This measure has 13 items that do not depend upon schooling with a total possible score of 19 points. Participants with a cut-off point of ≤12 were considered to have cognitive impairment.35 Depressive symptoms were determined using the short version of the Geriatric Depression Scale (GDS) considering a cut-off point of >5 points.51
Polypharmacy was defined as the concomitant use of five or more medications.5 The occurrence of stroke, heart disease, lung disease, joint disease, osteoporosis, dizziness or vertigo, cataract and glaucoma were recorded based on self-reports. Systemic arterial hypertension was recorded based on self-report and/or the use of anti-hypertension medications (ATC codes C02-C04, C07-C09) and/or systolic or diastolic blood pressure ≥140mmHg and 90mmHg, respectively.52 Diabetes was recorded based on self-reports and/or the use of medications for the treatment of the disease (ATC code A10) and/or plasma glucose ≥126mg/dL and/or glycated haemoglobin ≥6.5%.53 Anaemia was recorded in the presence of haemoglobin <12g/dL for women and <13g/dL for men.53 Body weight was measured by a trained interviewer using a calibrated scale, with the individual barefoot and wearing light clothing. Height was measured using a stadiometer fixed to a flat wall. BMI was calculated by dividing weight in kilograms by height in metres squared (kg/m2) and used as a continuous variable, as performed in a previous study.54
Slippery floors, throw rugs and a floor with different levels in the home were verified by the interviewer and confirmed by the participant.
Mobility was objectively evaluated based on gait speed, which was determined by the walk test of the Short Physical Performance Battery (SPPB).55 A cut-off point of ≤0.8m/s was used to define slowness.
Activities of daily living (ADL) were evaluated using the modified Katz index, considering locomotion, transfers, toileting, bathing, dressing and feeding oneself.56 Instrumental activities of daily living (IADL) were evaluated using the modified version of the Lawton scale, considering the following activities: shopping, managing money, using transportation, using a telephone and taking medications.57 Urinary incontinence was not included, as it does not necessarily imply a physical limitation.58 Preparing meals, house cleaning and washing clothes were not included due to the strong cultural component regarding gender.57 Participants reporting one or more difficulties on the performance of ADL and IADL were classified as having disability.
Statistical analysisBecause the data were based on multi-stage cluster sampling, sample weights were employed in the analyses. Differences in baseline characteristics between included and excluded individuals and between individuals with different fall status were analyzed using the Rao and Scott Wald test to compare means and the chi-square test with the Rao and Scott correction was used to compare proportions.
The prevalence of falls according to AO, dynapenia and D/AO was calculated with 95% confidence intervals (CI) considering the weight of the sample. Associations between AO, dynapenia, D/AO and other covariates and single or recurrent falls were analyzed using multinomial logistic regression. This method is a modification of the binary logistic regression model used for modelling relationships between multinomial responses without imposing any restrictions on the ordinality of the response,59 which was ideal for the present analysis, since the outcome in the present study has three categories. Associations with a p-value ≤0.2 in the univariate analysis were selected for the multinomial analysis, for which the forward stepwise method was used.
The multinomial regression results were calculated and presented as relative risk ratio (RRR) rather than odds ratio (OR). To interpret the multinomial regression results, non-fallers were considered the reference group (RRR=1.00) to compare the estimates of single fallers and recurrent fallers. The ND/NAO individuals was considered the reference (RRR=1.00) for AO and dynapenia status. To determine whether the association between dynapenia or AO and a single or recurrent falls could be underestimation, a sensitivity analysis was performed by entering these two variables separately in the models, i.e., dynapenia (no/yes) and AO (no/yes).
The Stata 14® program (Stata Corp, College Station, TX) was used for all analyses, with the level of significance set at 5% (p<0.05).
ResultsThe prevalence of falls was 28.5% (95% CI: 25.8–31.3%), 16.7% (95% CI: 14.6–18.9%) reported a single fall and 11.8% (95% CI: 10.1–13.9) reported recurrent falls. Mean age of the participants was 70 years. Tables 1 and 2 display the characteristics of the sample according to fall status. Excluded individuals had lower HGS, WC and BMI, reported fewer joint diseases, increased disability on IADL and higher frequencies of stroke and cognitive decline than included individuals (p<0.05, data not shown).
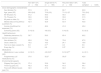
Characteristics of participants according to fall status among 1,046 community-dwelling older adults, SABE Study.
| Non-fall71.5% (n=733) | Single fall16.7% (n=180) | Recurrent falls11.8% (n=133) | Total sample(n=1,046) | |
|---|---|---|---|---|
| Socio-demographic characteristics | ||||
| Sex (female) (%) | 57.9 | 67.4 | 69.7 | 60.9 |
| Age, years (SE) | 69.8 (0.6) | 70.6 (0.9) | 71.8 (1.0)a | 70.2 (0.6) |
| 60–69 years (%) | 57.2 | 49.3 | 45.0 | 54.4 |
| 70–79 years (%) | 30.6 | 33.8 | 33.6 | 31.5 |
| 80 years or older (%) | 12.2 | 16.9 | 21.4 | 14.1 |
| Marital status (living without a partner) (%) | 42.4 | 42.9 | 53.4 | 43.8 |
| Income (insufficient for expenses) (%) | 41.1 | 48.4 | 41.8 | 42.4 |
| Schooling years (SE) | 5.4 (0.3) | 4.8 (0.5) | 5.4 (0.5) | 5.3 (0.3) |
| Health behaviours | ||||
| Sedentary behaviour (%) | 59.7 | 59.0 | 65.4 | 60.2 |
| Alcohol consumption | ||||
| Non-drinkers (%) | 65.8 | 72.8 | 70.8 | 67.5 |
| Once a week (%) | 19.2 | 18.3 | 24.1 | 19.6 |
| Two to six days a week (%) | 8.0 | 2.1a | 4.6 | 6.6 |
| Every day (%) | 7.0 | 6.8 | 0.5a | 6.2 |
| Medications | ||||
| Medications in use, number (SE) | 4.0 (0.1) | 4.8 (0.2)a | 6.0 (0.4)a.b | 4.4 (0.1) |
| Polypharmacy (≥5 medications) (%) | 37.6 | 52.2a | 59.2a | 42.6 |
| Environmental aspects | ||||
| Slippery floor (yes) (%) | 37.4 | 33.6 | 34.0 | 36.4 |
| Throw rug (yes) (%) | 45.3 | 40.5 | 41.6 | 44.1 |
| Floor with different levels (yes) (%) | 32.0 | 27.2 | 34.0 | 31.4 |
Notes. SE=standard error. Data are presented as percentages, means and standard error considering the sample weight.
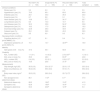
Characteristics of participants according to fall status among 1,046 community-dwelling older adults, SABE Study.
| Non-fall71.5% (n=733) | Single fall16.7% (n=180) | Recurrent falls11.8% (n=133) | Total sample(n=1,046) | |
|---|---|---|---|---|
| Clinical conditions | ||||
| Stroke (yes) (%) | 5.0 | 6.3 | 7.2 | 5.5 |
| Hypertension (yes) (%) | 79.5 | 85.1 | 83.0 | 80.9 |
| Diabetes (yes) (%) | 28.1 | 34.0 | 35.9 | 30.0 |
| Anaemia (yes) (%) | 6.7 | 8.8 | 9.1 | 7.4 |
| Heart disease (yes) (%) | 19.6 | 27.7 | 34.1a | 22.7 |
| Lung disease (yes) (%) | 8.4 | 10.3 | 10.7 | 9.0 |
| Joint disease (yes) (%) | 30.3 | 35.9 | 52.4a | 33.8 |
| Osteoporosis (yes) (%) | 18.2 | 17.3 | 28.9 | 19.3 |
| Dizziness/vertigo (yes) (%) | 22.8 | 26.4 | 33.6 | 24.7 |
| Cataract (yes) (%) | 29.1 | 39.5 | 43.5 | 32.5 |
| Glaucoma (yes) (%) | 8.5 | 6.9 | 9.0 | 8.3 |
| Neuropsychiatric conditions | ||||
| Cognitive decline (≤12 points MMSE) (%) | 6.7 | 9.1 | 9.4 | 7.4 |
| Depressive symptoms (>5 points GDS) (%) | 15.1 | 13.7 | 32.6a.b | 16.9 |
| Mobility | ||||
| Gait speed (≤0.8m/s) (%) | 47.3 | 55.1 | 59.8 | 50.1 |
| Disability | ||||
| ADL, number (SE) | 1.1 (0.1) | 1.4 (0.2) | 2.5 (0.3)a.b | 1.3 (0.1) |
| ADL (one or more) (%) | 39.6 | 48.0 | 63.3a | 43.8 |
| IADL, number (SE) | 0.4 (0.0) | 0.5 (0.1) | 0.8 (0.1)a.b | 0.5 (0.0) |
| IADL (one or more) (%) | 19.9 | 25.6 | 37.3a | 22.9 |
| Measurements | ||||
| Grip strength, kg/f (SE) | 26.5 (0.5) | 23.4 (0.7)a | 22.9 (1.1)a | 25.5 (0.4) |
| Waist circumference, cm (SE) | 95.2 (0.5) | 95.5 (0.8) | 97.8 (1.7) | 95.6 (0.5) |
| Body mass index, kg/m2 (SE) | 28.3 (0.2) | 28.9 (0.4) | 29.7 (0.7)a | 28.6 (0.2) |
| Non-dynapenic/non-abdominal obese | 80.1 | 11.8a | 8.1a | 37.9 |
| Abdominal obese only | 68.0 | 18.8a | 13.2a | 41.5 |
| Dynapenic only | 62.8 | 18.8a | 18.4a | 11.3 |
| Dynapenic-abdominal obese | 63.3 | 23.8a | 12.9a | 9.3 |
Notes. SE=standard error. Data are presented as percentages, means and standard error considering the sample weight.
Single fallers had lower HGS, reported less frequent alcohol consumption and reported more polypharmacy than non-fallers (p<0.05). Recurrent fallers were older, had higher BMI, lower HGS, reported less frequent daily alcohol consumption, higher frequencies of heart disease, joint disease and depressive symptoms, greater medication use and greater disability on ADL and IADL than non-fallers. Recurrent fallers also reported a higher frequency of depressive symptoms, greater medication use and greater disability on ADL and IADL than single fallers (p<0.05) (Tables 1 and 2).
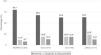
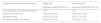
D/AO individuals reported a higher frequency of single falls, whereas dynapenic only individuals reported a higher frequency of recurrent falls (Fig. 1). In the final model, AO only (RRR=1.90, 95% CI: 1.02–3.55), dynapenia only (RRR=1.80, 95% CI: 1.02–3.19) and D/AO (RRR=2.06, 95% CI: 1.04–4.10) were associated with single falls. A stronger association was found with D/AO than the other two conditions separately. Dynapenia was associated with recurrent falls (RRR=2.33, 95% CI: 1.13–4.81) (Table 3).
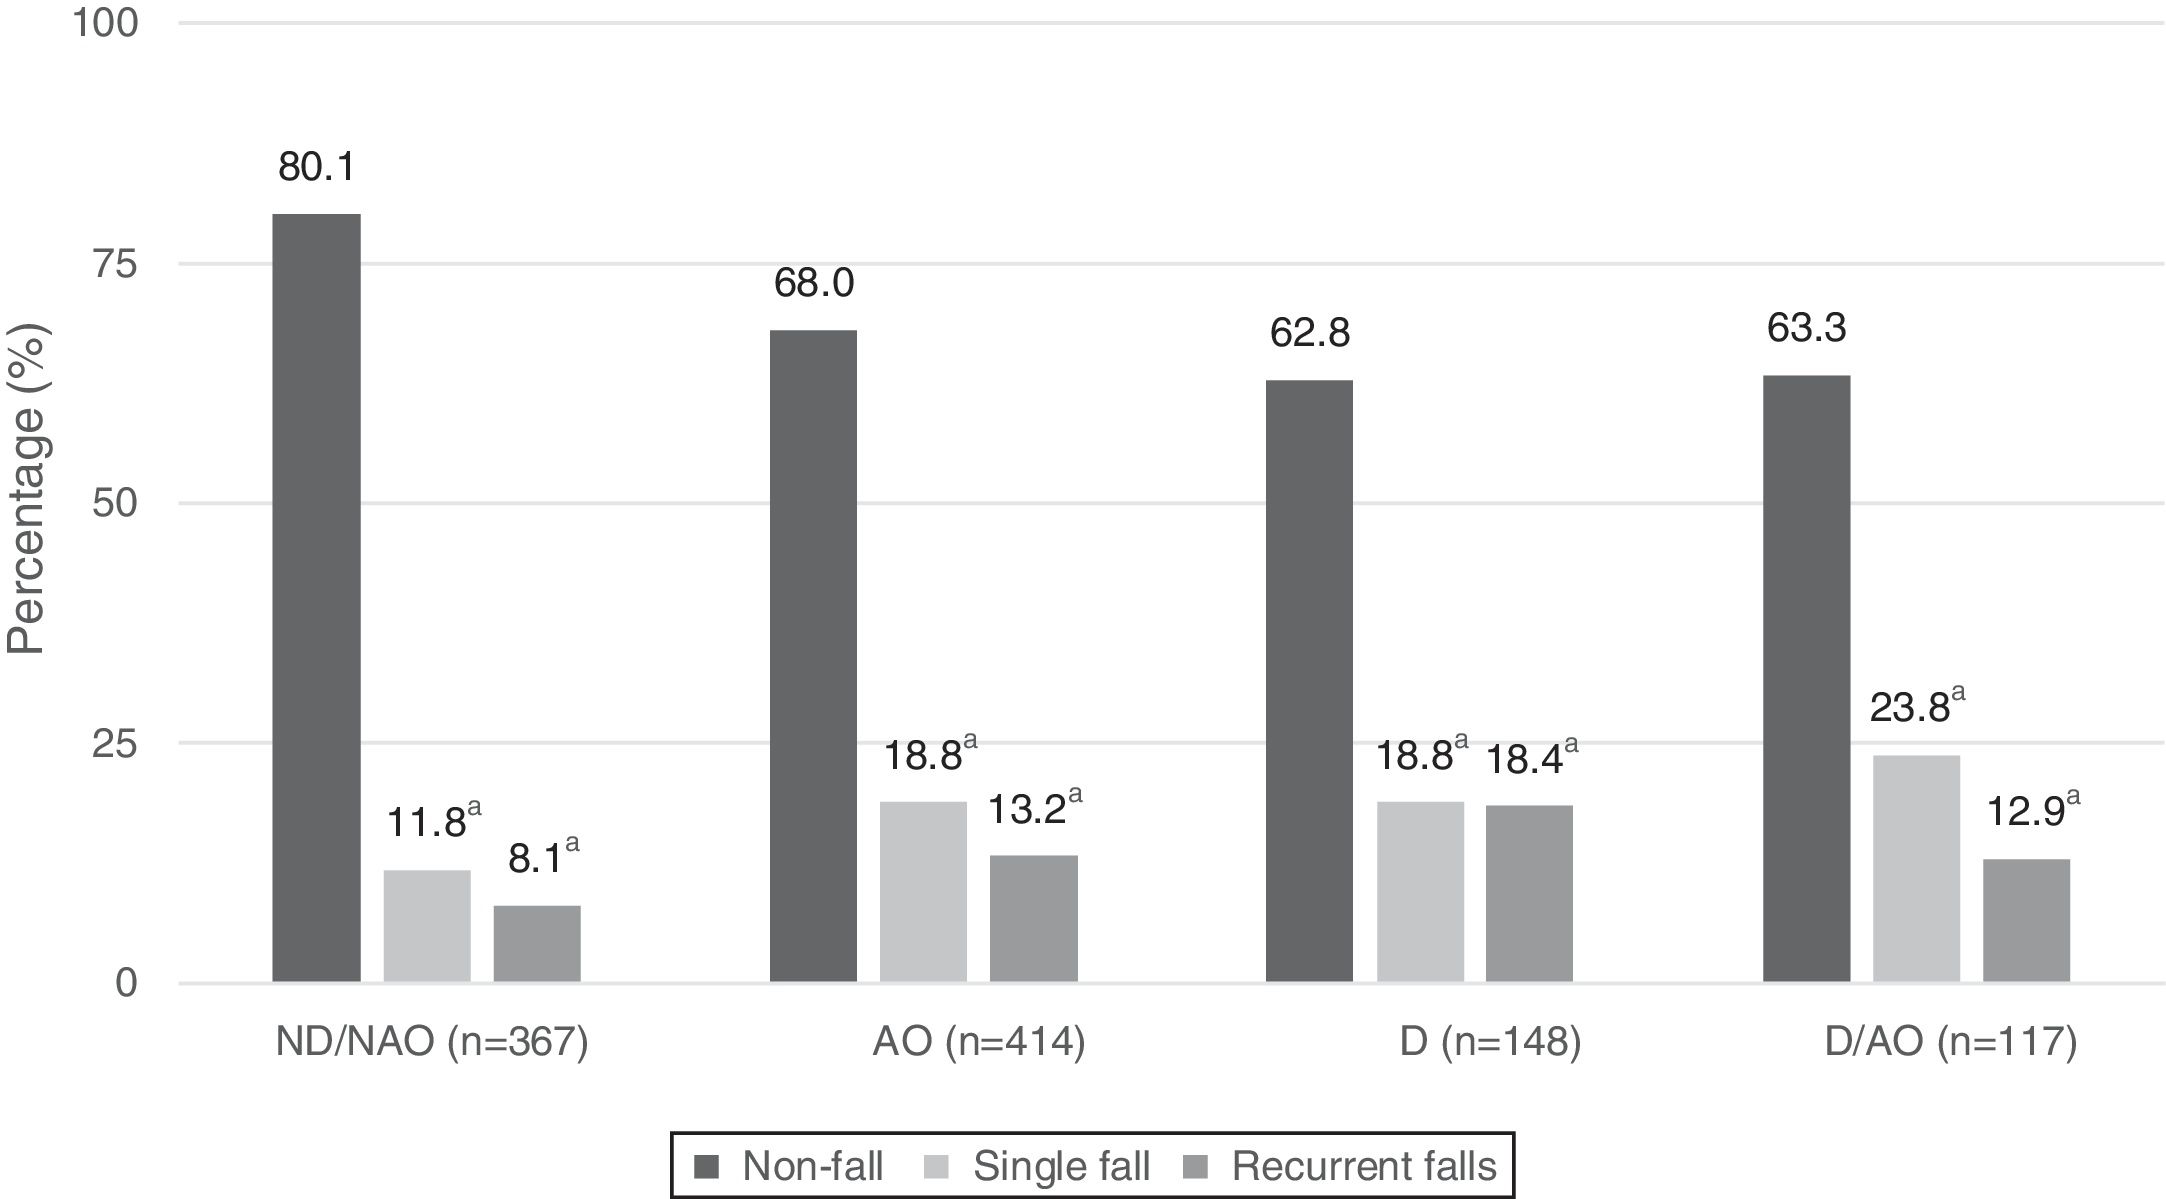
Prevalence of single and recurrent falls according to abdominal obesity and dynapenia status among community-dwelling older adults, SABE Study (n=1,046).
Notes. ND/NAO: non-dynapenic/non-abdominal obese; AO: abdominal obese only; D: dynapenic only; D/AO: dynapenic-abdominal obese; Dynapenic: handgrip strength <26kg for men and <16kg for women; Abdominal obese: waist circumference >102cm for men and >88cm for women. a Significant difference from non-fall; significance: p<0.05. Prevalence was calculated considering the weight of the sample.
Multinomial regression model for a single and recurrent falls according to dynapenia and abdominal obesity status among community-dwelling older adults, SABE study (n=1,046).
| Dynapenia/abdominal obesity status | Single fall | Recurrent falls |
|---|---|---|
| Adjusted modelRRR 95% CI | Adjusted modelRRR 95% CI | |
| Non-dynapenic/non-abdominal obese | 1.00 | 1.00 |
| Abdominal obese only | 1.90 [1.02–3.55] | 0.92 [0.46–1.85] |
| Dynapenic only | 1.80 [1.02–3.19] | 2.33 [1.13–4.81] |
| Dynapenic-abdominal obese | 2.06 [1.04–4.10] | 0.67 [0.30–1.50] |
Notes. Reference category: non-faller; RRR: relative risk ratio; Dynapenia: handgrip strength <26kg for men and <16kg for women; Abdominal obese: waist circumference >102cm for men and >88cm for women. Adjusted for sex, age, floor with different levels, polypharmacy, body mass index, diabetes, joint disease, dizziness/vertigo, depressive symptoms and functional status.
The principal aim of the present study was to investigate whether AO only, dynapenia only and D/AO are associated with single and recurrent falls in older adults. We found that AO only, dynapenia only and D/AO were associated with a single fall, with the latter condition demonstrating a stronger association. Moreover, dynapenia was associated with recurrent falls.
AO has been shown as an associated factor with falls in older adults.14,15 Investigating 1,377 Taiwanese individuals aged 65 and older, Lin et al.14 found that a larger WC was associated with single fall, independently of age, sex and physical functioning. Using longitudinal evidence from 3,383 participants aged 65 and older, Cho et al.15 showed that AO was associated with a single fall (OR=1.37 95% CI: 1.01–1.85), but not overweight and obesity measured by BMI (OR=0.80 95% CI: 0.60–1.07 and OR=0.79 95% CI: 0.56–1.12, respectively). Our findings also showed that AO only was associated to a single fall independently of BMI and other potential covariates and risk factors.
This association could be attributed to the fact that a large WC can cause poor postural alignment, requiring increased efficiency in balance motor strategies to avoid a fall.14,23 Corbeil et al.23 described that a CoM positioned more forward caused by AO requires a significant increase of ankle torque. More importantly, it generates a wrong perception of the torque needed to stabilize one's posture. In other words, there is a difficulty to recruit the required strategies to restore postural equilibrium (ankle, hip and stepping strategies) increasing considerably the risk of falls.
Dynapenia was independently associated with single and recurrent falls in our study, which is in agreement with data described in previous studies.7–9 For example, Miller et al.7 using data from 1,251 participants aged 70 and older found that lower muscle strength measured by HGS predicted, independently, the risk of having a fall in a year. In addition, a recent analysis from the Tasmanian Older Adult Cohort (TASOAC) study including 1,041 individuals aged 50 and older showed that weaker muscular strength increases the risk of falls in 10 years. This risk was similar when measured by HGS (β=0.50 95% CI: 0.27–0.73, p<0.005) and by lower-limb strength (β=0.60 95% CI: 0.39–0.81 p<0.001).9
The inability of muscle due to weakness to respond to the postural corrections required due to imbalance imposed by voluntary movements or external forces, could help to explain these findings. This is because contrary to quiet stance – when oscillations keep the CoM in a position very constant over the support base – gait, postural changes and some risky situations require a complex movement control of the CoM, involving proactive and reactive control balance.21 Since dynapenia consists of dysregulation of neuromuscular function,18 it can potentially lead to a failure to stop an older person of having a fall.
Although the ability to avoid having a fall is more related to muscle strength and function of lower limbs, previous evidence suggests that HGS provides estimates of risk similar to the ones from the lower-limb strength. HGS is also associated to outcomes related to lower-limb muscle activities such as declines in mobility41,60 and even poor lower limb function42 and falls.7,9,43
Dynapenic obesity has been found to increase the risk of a single fall over a 5-year follow-up period.31 Scott et al.31 defined dynapenia based on the lowest tertile of the sample distribution for quadriceps strength, body fat based on the highest tertile of the sample distribution for central obesity, and global obesity based on DEXA.31 Similarly, the present findings demonstrate that the determination of D/AO, measured based on HGS and WC, can also identify greater chance of a single fall in older adults. Our approach can very useful in various low-cost healthcare settings, which is extremely important.
Our findings showed that D/AO individuals are twice more likely to have a fall compared to ND/NAO individuals. This higher change to have a fall could be explained by the combined effect of AO and dynapenia which in turn increases the postural instability and causing a worse effective motor response.23 In these individuals, AO pushes the CoM forwards and it would be required additional muscular strength21 which does not occur due to their dynapenia status. Furthermore, there is substantial evidence from longitudinal studies showing that obesity, measured by WC, is an important risk factor for declines in muscular strength assessed by HGS.19,20
In the present study no association was found between D/AO and recurrent falls. A possible explanation for this may be related to the characteristics that were significantly associated with recurrent falls in the final model: joint disease (RRR=1.99 95% CI: 1.23–3.20), depressive symptoms (RRR=1.91 95% CI: 1.15–3.16), and ADL disability (RRR=1.64 95% CI: 1.00–2.68) (data not shown). One may suspect that recurrent fallers have a poorer health status and more intrinsic predictors than single-time fallers, as suggested by the comparative analyses (Table 2), offering evidence that intrinsic factors seem to exert a greater influence on the mechanisms of recurrent falls than AO or D/AO.
However, as a fall can be considered a sentinel event in older adults, it is plausible that D/AO is a triggering situation of the first event, which, in turn, could lead to an aggravation of joint disease, depression and disability. In addition, to the best of our knowledge there is no other study investigating the association between D/AO and recurrent falls. Therefore, longitudinal studies investigating the incidence of recurrent falls and considering both AO and dynapenia are crucial to clarifying these issues.
Finally, the sensitivity analyses demonstrated the considering dynapenia and AO separately could result in an underestimation of the parameters for single and recurrent falls. This underscores the importance of the analytical approach adopted in the present study, i.e., considering the influence of the combination of AO and dynapenia on single and recurrent falls (Table 4).
Multinomial regression models for a single and recurrent falls according to dynapenia and abdominal obesity status among community-dwelling older adults, SABE study (n=1,046) – sensitivity analysis.
| Dynapenia/abdominal obesity status | Single fall | Recurrent falls |
|---|---|---|
| Adjusted modelRRR 95% CI | Adjusted modelRRR 95% CI | |
| Non-dynapenic/non-abdominal obese | 1.00 | 1.00 |
| Abdominal obese | 1.70 [0.98–2.95] | 0.68 [0.38–1.24] |
| Dynapenic | 1.40 [0.98–2.00] | 1.35 [0.83–2.21] |
Notes. Reference category: non-faller; RRR: relative risk ratio; Dynapenia: handgrip strength <26kg for men and <16kg for women; Abdominal obese: waist circumference >102cm for men and >88cm for women. Adjusted for sex, age, floor with different levels, polypharmacy, body mass index, diabetes, joint disease, dizziness/vertigo, depressive symptoms and functional status.
The major strengths of this study include the use of simple measures to detect dynapenia and AO in clinical practice, the large representative sample of community-dwelling older adults and the use of a wide range of important confounding factors in the analyses. However, the present study has some limitations that should be acknowledged. First, the cross-sectional design does not enable the establishment of cause-and-effect relationships. Secondly, the SABE Study did not include institutionalized older adults. Thus, the greater prevalence of dynapenia in this population could alter the estimates reported herein. Third, self-reported falls could introduce recall bias, however, this type of bias is very common and difficult to be avoided particularly in population based ageing cohorts. Finally, HGS is not the best measure to assess overall muscle strength as well as WC to measure one's total AO.
In conclusion, D/AO was more strongly associated with a single fall than AO only and dynapenia only, whereas dynapenia was the unique condition associated with recurrent falls. The findings suggest that the underlying mechanisms that explain these associations may be distinct and should be explored further in future research.
The present findings have important implications regarding the identification of older adults with a greater chance of falls and can assist in the drafting of rehabilitation strategies. Therefore abdominal obese, dynapenic and dynapenic abdominal obese individuals should be target groups for the management of falls and the consequences of these events.
Conflicts of interestThe authors declare no conflicts of interest.
This work was supported by the São Paulo Research Foundation, FAPESP (Grant number: 2009/53778-3 and 2015/18291-7). This study was financed in part by the Coordenação de Aperfeiçoamento de Pessoal de Nível Superior - Brasil (CAPES) - Finance Code 001.


