


Handgrip strength (HGS) testing is a highly recommended method for screening for sarcopenia in older adults. However, there is no consensus on the optimal protocol and number of trials for screening sarcopenia in older adults with cognitive impairment.
ObjectiveTo investigate the use of the first trial (FT), the mean of three trials (MT), and the highest value (HT) from three trials of the HGS test to screen for sarcopenia in older adults with cognitive impairment. Additionally, to analyze the consistency, agreement, and measurement error in the diagnosis of muscle weakness.
Methods176 older adults with cognitive impairment were evaluated. The HGS test was repeated three times. Analyses were performed using the Friedman repeated measures test with Wilcoxon post-hoc, intraclass correlation coefficient (ICC), Standard Error of Measurement (SEM), Minimal Detectable Change (MDC95), and Kappa index tests.
ResultsThere was no significant difference between the first trial (FT) and the mean of three trials (MT) (d = 0.17 [95 % CI: −0.08, 0.42]), but both differed significantly from the highest value (HT) (p < 0.001). The ICC indicated a reliability of 0.97 (95 % CI: 0.95, 0.98) across all participants, while the kappa index demonstrated over 80 % agreement. The SEM for the first measure of HGS ranged from 0.59 to 2.12 kgf. The MDC95 ranged from 1.64 to 5.87 kgf.
ConclusionFor HGS testing, there was excellent consistency between the FM and MT. All three testing methods demonstrated excellent agreement in diagnosing muscle weakness. The measurement errors confirm that FT can be reliably used to monitor changes during rehabilitation.
Sarcopenia is an important clinical problem affecting millions of older adults1 and is present in about 10 % of individuals aged 60 years or older.2,3 According to the EWGSOP2 (European Working Group on Sarcopenia in Older People 2), sarcopenia is a progressive and generalized muscle disorder associated with adverse outcomes such as falls, fractures, physical disability, and mortality. It is defined by the low grip strength and low muscle mass.1,4
A recent meta-analysis showed that the risk of developing cognitive impairment is higher in patients with sarcopenia, and that the Mini-Mental State Examination (MMSE) scores are lower in those with sarcopenia.5 Therefore, it is important to perform sarcopenia screening in clinical settings and to prevent sarcopenia in older people with cognitive decline to improve their quality of life.
The most recommended method for screening sarcopenia is testing handgrip strength (HGS), which is easy, inexpensive,6 and suitable for both clinical practice and research.7 HGS is a valid and reliable measurement in community-dwelling older adults and in patients with cognitive impairment.8,9 HGS measures the amount of static force exerted while squeezing a dynamometer10 and is reflective of overall muscle strength.11
However, the methodology used to measure HGS varies considerably among studies.12–14 Two protocols are the most often used: one developed by the American Society of Hand Therapists (ASHT)15 and the other referred to as the Southampton protocol.12 Although both protocols recommend performing three trials of the test, the ASHT recommends using the mean of the three trials, while the Southampton protocol recommends using the trial with the maximum value.12,15
Sousa-Santos and Amaral13 reviewed different HGS testing protocols to diagnose sarcopenia and frailty in older adults and suggest the adoption of the ASHT protocol. In contrast, Mehmet et al14 recommend using the trial with the maximum force value, as suggested by the Southampton protocol, to assess frailty in older adults. Furthermore, Abizanda et al16 verified muscle fatigability when testing HGS three times in community-dwelling older adults and indicated that just one trial is sufficient. However, no prior studies have examined the best protocols for screening for sarcopenia in older adults with cognitive impairment.
There is a lack of consensus regarding the optimal number of trials needed for HGS testing to screen for sarcopenia in older adults with cognitive impairment. Therefore, the aim of the present study was to investigate the use of the first trial (FT), the mean of three trials (MT), and the highest of three trials (HT) for sarcopenia screening in older adults with cognitive impairment. Additionally, we analyzed the consistency, agreement, and measurement error of muscle weakness diagnosis in this population.
MethodsStudy designThis cross-sectional observational study is reported according to The Strengthening the Reporting of Observational Studies in Epidemiology (STROBE) recommendations.17 The study was approved by the Research Ethics Committee of the Faculty of Ceilândia – University of Brasília, Brasília, Federal District, Brazil (approval 3.650.491). All participants signed a written informed Consent Form before enrolment. The study was conducted at the Polyclinic and screening center for older adults in the western health region of the Federal District.
ParticipantsBetween 2019 and 2021, 304 adults aged 60 years or older completed the multidimensional assessment for older people in the specialized geriatric service of the Polyclinic (convenience sample). Of these individuals, 176 of both sexes, who had adequate capacity to perform the HGS test8 and exhibited cognitive impairment as measured by the MMSE with education-adjusted scores (28 or less for subjects with more than 7 years of education; 24 or less for those with 4–7 years of schooling; 23 or less for those with 1–3 years; and 19 or less for those who were illiterate),18 agreed to participate and were included in this study (Fig. 1).

A sample size of at least 100 participants was determined to be needed a priori, in accordance with the COSMIN recommendations checklist, which considers this a very good number of patients for studies of reliability measures and agreement.19
Participants were characterized by age, sex, level of education, number of medications used, previous diagnosis of dementia (issued by the Polyclinic geriatrician), and level of physical activity. “Active” was defined as performing moderate-intensity physical exercise for 150–300 min per week or vigorous-intensity exercise for 75–150 min per week.20 Nutritional state was classified using body mass index (BMI): underweight (BMI < 22 kg/m2), eutrophic (BMI 22–27 kg/m2), and overweight (BMI > 27 kg/m2).21 Functional capacity for instrumental daily living activities was assessed using the Functional Activities Questionnaire (FAQ): independent (scores from 0 to 5) or functional dependent (scores from 6 to 30).22–24 The FAQ was answered by the older adults’ caregiver.
Participants were classified into two subgroups based on the previous diagnosis of dementia issued by the Polyclinic geriatrician: older adults with a dementia diagnosis and those without.
Handgrip strength (HGS)Isometric HGS was measured in kgf using the Saehan® hydraulic hand dynamometer (Saehan Corporation, 973, Yangdeok-Dong, Masan, Korea), a valid and reliable instrument comparable to the Jamar dynamometer for measuring muscle strength.25 The procedures were conducted consistent with a previous study on the reliability of HGS testing in older adults with dementia.8 Participants were seated in a straight-backed chair with feet flat on the floor, shoulder adducted and neutrally rotated, elbow flexed at 90°, forearm in a neutral rotation, and thumb up. To familiarize participants with the procedure, they had the opportunity to handle the dynamometer before recording the measures.
After familiarization, the test was performed with the dominant hand and included six seconds of verbal encouragement. The following verbal directions were used: “Are you ready? Squeeze as hard as you can!”. As the participant began to squeeze, the effort was maintained with the verbal encouragements, “Harder! Harder!”. Three measures were taken with a 1-minute rest interval between them. The first trial (FT), the mean of three trials (MT), and the highest of the three trials (HT) were recorded. Values less than 27 kgf for males and 16 kgf for females were used to classify individuals as having muscle weakness.4
Statistical analysisThe data were analyzed using the IBM SPSS Statistics for Windows version 23.0. Continuous data were analyzed using the Kolmogorov-Smirnov test, which showed that only age data had a normal distribution. Descriptive analysis was performed for numerical data using measures of central tendency (mean and median) and measures of variability (standard deviation and interquartile range [percentiles 25 % and 75 %]). Categorical data were analysed using absolute frequency and percentage measures.
The repeated measures Friedman test was used to compare the three HGS values (FT, MT, and HT) with a multiple comparison post hoc analysis using Wilcoxon test. The intraclass correlation coefficient (ICC) with a 95 % confidence interval (CI) based on the two-way mixed-effects model, single measurement, and absolute agreement was used to determine the consistency of the three measures. ICC values were classified as follows: poor correlation (0.00–0.20); fair correlation (0.21–0.40); good correlation (0.41–0.60); very good correlation (0.61–0.80), and excellent correlation (0.81–1.00).26
Standard Error of Measurement (SEM) and Minimal Detectable Change (MDC95) were used to determine measurement error for each HGS measure. SEM was calculated to determine the response stability for the HGS measures. MDC95 was calculated using the formula SEMx22x1.96. Agreement between FT, MT, and HT was evaluated using the Kappa coefficient, with values indicating excellent agreement above 80 %, substantial agreement from 60 % to 80 %, moderate agreement from 40 % to 60 %, and poor agreement below 40 %.27
The analyses were performed for all participants and also stratified by sex (male and female) and by previous dementia diagnosis (with and without a dementia diagnosis). A significance level of 5 % was used.
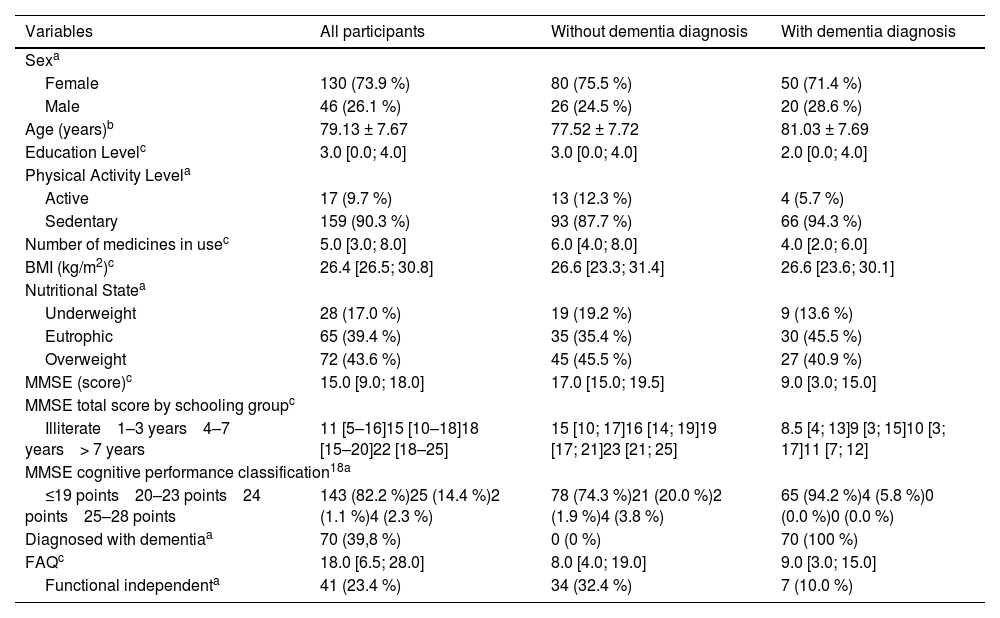
ResultsThe characteristics of the participants are provided in Table 1. Most of the sample were female, with low level of education and sedentary lifestyle. The mean age was 79.13 years.
Participants characteristics (n = 176).
| Variables | All participants | Without dementia diagnosis | With dementia diagnosis |
|---|---|---|---|
| Sexa | |||
| Female | 130 (73.9 %) | 80 (75.5 %) | 50 (71.4 %) |
| Male | 46 (26.1 %) | 26 (24.5 %) | 20 (28.6 %) |
| Age (years)b | 79.13 ± 7.67 | 77.52 ± 7.72 | 81.03 ± 7.69 |
| Education Levelc | 3.0 [0.0; 4.0] | 3.0 [0.0; 4.0] | 2.0 [0.0; 4.0] |
| Physical Activity Levela | |||
| Active | 17 (9.7 %) | 13 (12.3 %) | 4 (5.7 %) |
| Sedentary | 159 (90.3 %) | 93 (87.7 %) | 66 (94.3 %) |
| Number of medicines in usec | 5.0 [3.0; 8.0] | 6.0 [4.0; 8.0] | 4.0 [2.0; 6.0] |
| BMI (kg/m2)c | 26.4 [26.5; 30.8] | 26.6 [23.3; 31.4] | 26.6 [23.6; 30.1] |
| Nutritional Statea | |||
| Underweight | 28 (17.0 %) | 19 (19.2 %) | 9 (13.6 %) |
| Eutrophic | 65 (39.4 %) | 35 (35.4 %) | 30 (45.5 %) |
| Overweight | 72 (43.6 %) | 45 (45.5 %) | 27 (40.9 %) |
| MMSE (score)c | 15.0 [9.0; 18.0] | 17.0 [15.0; 19.5] | 9.0 [3.0; 15.0] |
| MMSE total score by schooling groupc | |||
| Illiterate 1–3 years 4–7 years > 7 years | 11 [5–16]15 [10–18]18 [15–20]22 [18–25] | 15 [10; 17]16 [14; 19]19 [17; 21]23 [21; 25] | 8.5 [4; 13]9 [3; 15]10 [3; 17]11 [7; 12] |
| MMSE cognitive performance classification18a | |||
| ≤19 points 20–23 points 24 points 25–28 points | 143 (82.2 %)25 (14.4 %)2 (1.1 %)4 (2.3 %) | 78 (74.3 %)21 (20.0 %)2 (1.9 %)4 (3.8 %) | 65 (94.2 %)4 (5.8 %)0 (0.0 %)0 (0.0 %) |
| Diagnosed with dementiaa | 70 (39,8 %) | 0 (0 %) | 70 (100 %) |
| FAQc | 18.0 [6.5; 28.0] | 8.0 [4.0; 19.0] | 9.0 [3.0; 15.0] |
| Functional independenta | 41 (23.4 %) | 34 (32.4 %) | 7 (10.0 %) |
BMI, body mass index; FAQ, Functional Activities Questionnaire; MMSE, Mini Mental State Examination.
The values for FT, MT, and HT for HGS by sex and by subgroups of older adults with and without dementia diagnosis are presented in Fig. 2.

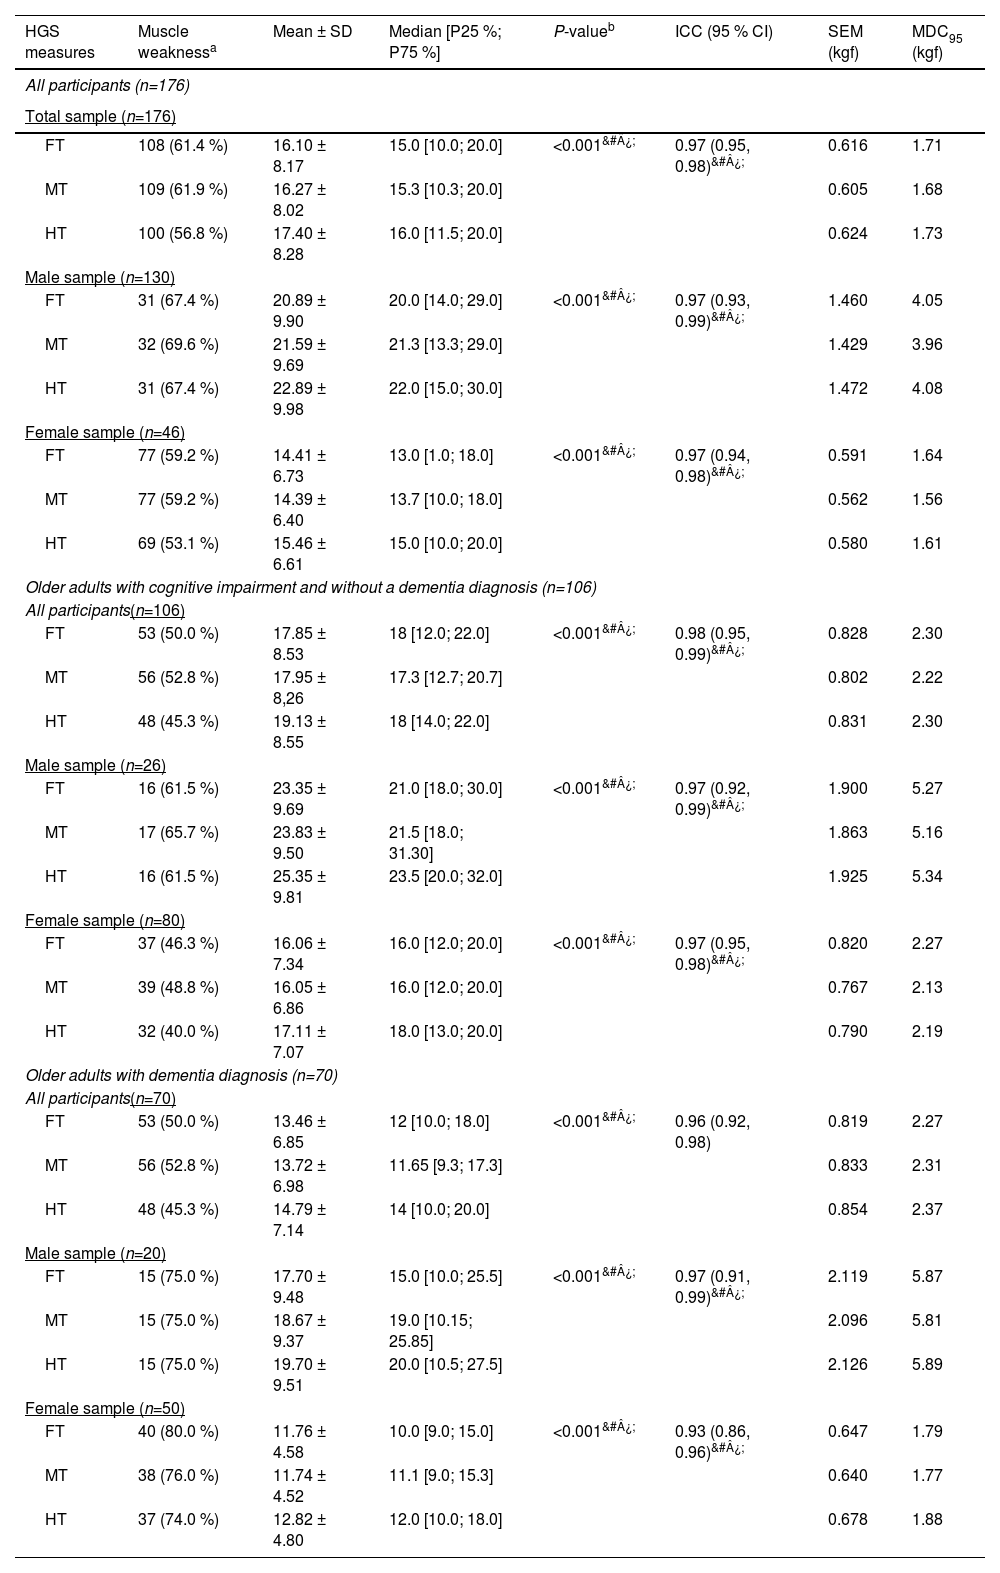
Data analysis for the differences between FT, MT, and HT values and the consistency of the data for all participants and subgroups are shown in Table 2. For all participants, there is an effect of the type of measurement on the value obtained for the HGS (p < 0.001). No differences were found between the FT and the MT (d = 0.17 [95 %CI: −0.08, 0.42]). However, the FT and the MT differ significantly from the HT (p < 0.001). The ICC indicated excellent reliability between the HGS measures (FT, MT, and HT) (ICC=0.97 [95 % CI: 0.95, 0.98]). The ICC analyzes stratified by sex and by subgroups also showed excellent reliability. The SEM for the first trial data ranged from 0.591 kgf (all women) to 2.119 kgf (men diagnosed with dementia) and the MDC95 ranged from 1.64 kgf (all women) to 5.87 kgf (men diagnosed with dementia) (Table 2).
Handgrip strength test measurements data.
| HGS measures | Muscle weaknessa | Mean ± SD | Median [P25 %; P75 %] | P-valueb | ICC (95 % CI) | SEM (kgf) | MDC95 (kgf) |
|---|---|---|---|---|---|---|---|
| All participants (n=176) | |||||||
| Total sample (n=176) | |||||||
| FT | 108 (61.4 %) | 16.10 ± 8.17 | 15.0 [10.0; 20.0] | <0.001&#¿; | 0.97 (0.95, 0.98)&#¿; | 0.616 | 1.71 |
| MT | 109 (61.9 %) | 16.27 ± 8.02 | 15.3 [10.3; 20.0] | 0.605 | 1.68 | ||
| HT | 100 (56.8 %) | 17.40 ± 8.28 | 16.0 [11.5; 20.0] | 0.624 | 1.73 | ||
| Male sample (n=130) | |||||||
| FT | 31 (67.4 %) | 20.89 ± 9.90 | 20.0 [14.0; 29.0] | <0.001&#¿; | 0.97 (0.93, 0.99)&#¿; | 1.460 | 4.05 |
| MT | 32 (69.6 %) | 21.59 ± 9.69 | 21.3 [13.3; 29.0] | 1.429 | 3.96 | ||
| HT | 31 (67.4 %) | 22.89 ± 9.98 | 22.0 [15.0; 30.0] | 1.472 | 4.08 | ||
| Female sample (n=46) | |||||||
| FT | 77 (59.2 %) | 14.41 ± 6.73 | 13.0 [1.0; 18.0] | <0.001&#¿; | 0.97 (0.94, 0.98)&#¿; | 0.591 | 1.64 |
| MT | 77 (59.2 %) | 14.39 ± 6.40 | 13.7 [10.0; 18.0] | 0.562 | 1.56 | ||
| HT | 69 (53.1 %) | 15.46 ± 6.61 | 15.0 [10.0; 20.0] | 0.580 | 1.61 | ||
| Older adults with cognitive impairment and without a dementia diagnosis (n=106) | |||||||
| All participants(n=106) | |||||||
| FT | 53 (50.0 %) | 17.85 ± 8.53 | 18 [12.0; 22.0] | <0.001&#¿; | 0.98 (0.95, 0.99)&#¿; | 0.828 | 2.30 |
| MT | 56 (52.8 %) | 17.95 ± 8,26 | 17.3 [12.7; 20.7] | 0.802 | 2.22 | ||
| HT | 48 (45.3 %) | 19.13 ± 8.55 | 18 [14.0; 22.0] | 0.831 | 2.30 | ||
| Male sample (n=26) | |||||||
| FT | 16 (61.5 %) | 23.35 ± 9.69 | 21.0 [18.0; 30.0] | <0.001&#¿; | 0.97 (0.92, 0.99)&#¿; | 1.900 | 5.27 |
| MT | 17 (65.7 %) | 23.83 ± 9.50 | 21.5 [18.0; 31.30] | 1.863 | 5.16 | ||
| HT | 16 (61.5 %) | 25.35 ± 9.81 | 23.5 [20.0; 32.0] | 1.925 | 5.34 | ||
| Female sample (n=80) | |||||||
| FT | 37 (46.3 %) | 16.06 ± 7.34 | 16.0 [12.0; 20.0] | <0.001&#¿; | 0.97 (0.95, 0.98)&#¿; | 0.820 | 2.27 |
| MT | 39 (48.8 %) | 16.05 ± 6.86 | 16.0 [12.0; 20.0] | 0.767 | 2.13 | ||
| HT | 32 (40.0 %) | 17.11 ± 7.07 | 18.0 [13.0; 20.0] | 0.790 | 2.19 | ||
| Older adults with dementia diagnosis (n=70) | |||||||
| All participants(n=70) | |||||||
| FT | 53 (50.0 %) | 13.46 ± 6.85 | 12 [10.0; 18.0] | <0.001&#¿; | 0.96 (0.92, 0.98) | 0.819 | 2.27 |
| MT | 56 (52.8 %) | 13.72 ± 6.98 | 11.65 [9.3; 17.3] | 0.833 | 2.31 | ||
| HT | 48 (45.3 %) | 14.79 ± 7.14 | 14 [10.0; 20.0] | 0.854 | 2.37 | ||
| Male sample (n=20) | |||||||
| FT | 15 (75.0 %) | 17.70 ± 9.48 | 15.0 [10.0; 25.5] | <0.001&#¿; | 0.97 (0.91, 0.99)&#¿; | 2.119 | 5.87 |
| MT | 15 (75.0 %) | 18.67 ± 9.37 | 19.0 [10.15; 25.85] | 2.096 | 5.81 | ||
| HT | 15 (75.0 %) | 19.70 ± 9.51 | 20.0 [10.5; 27.5] | 2.126 | 5.89 | ||
| Female sample (n=50) | |||||||
| FT | 40 (80.0 %) | 11.76 ± 4.58 | 10.0 [9.0; 15.0] | <0.001&#¿; | 0.93 (0.86, 0.96)&#¿; | 0.647 | 1.79 |
| MT | 38 (76.0 %) | 11.74 ± 4.52 | 11.1 [9.0; 15.3] | 0.640 | 1.77 | ||
| HT | 37 (74.0 %) | 12.82 ± 4.80 | 12.0 [10.0; 18.0] | 0.678 | 1.88 | ||
Mucle weakness is presented as absolute frequency and percentage. bRepeated measures Friedman test with a multiple comparison post hoc analysis using Wilcoxon test. *p < 0.05.
FT, first trial; HGS, handgrip strength; HT, highest of three trials; MDC95, minimal detectable change based on 95 % confidence interval; MT, mean of three trials; SEM, Standard Error of Measurement.
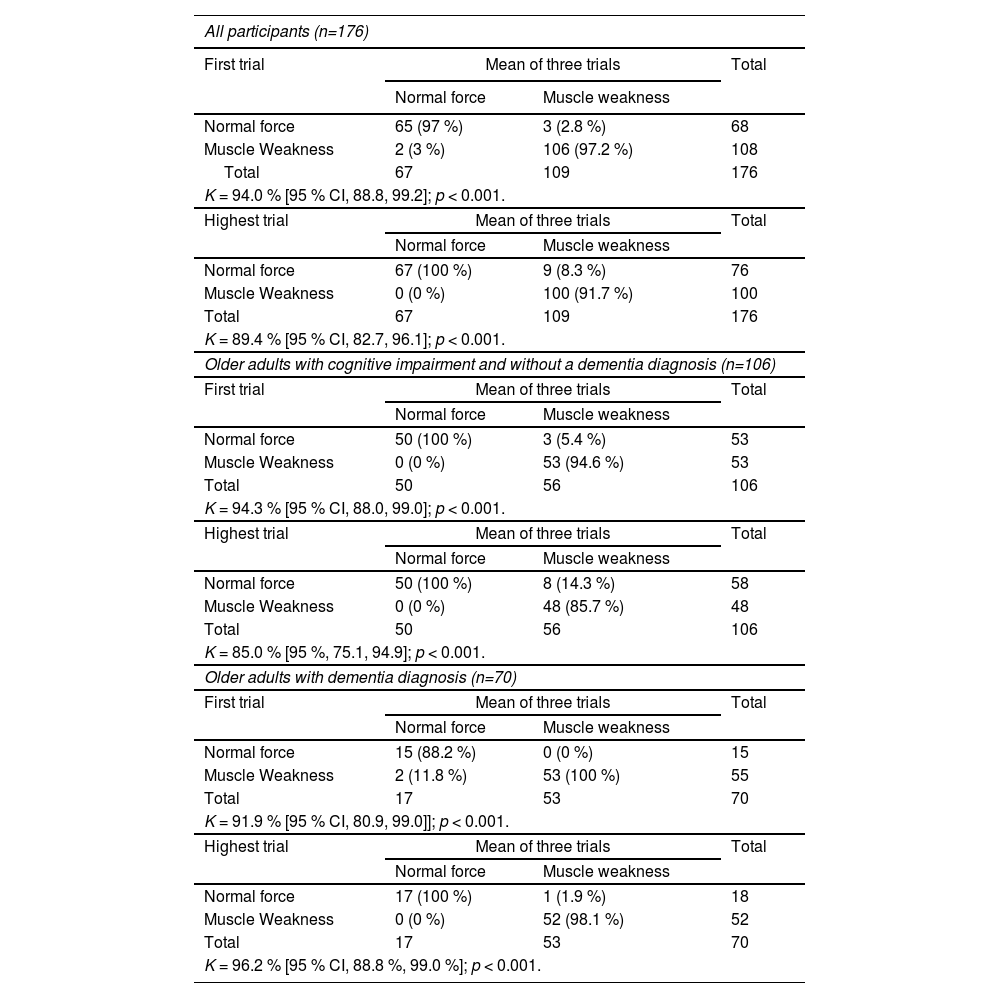
Data for the level of agreement between HGS measurements are shown in Table 3. For all participants, the percentage of agreement for the diagnosis of muscle weakness between the FT and MT values was 97.16 % and between the MT and HT values was 94.8 %. For these analyses, a Kappa index value of 94 % between the FM and MT and a Kappa index of 89.4 % between MT and MF indicated excellent agreement between measurements. The agreement analyzes stratified by sex and by subgroups with and without a dementia diagnosis also showed excellent agreement between the types of measurements.
Agreement between the three handgrip measures.
The present study, measuring HGS in older individuals with and without cognitive impairments, showed no difference between the value obtained with the first trial and values averaged from three trials. However, using the highest value of the three trials leads to a different result compared to either the first trial or the mean of the three trials. The low measurement errors suggest that values from a single trial of HGS can be used to monitor changes over time or during rehabilitation. This contrasts with the results of a recent review that showed the mean of three trials is most commonly used in research and clinical practice.14
Contradicting our findings, Mehmet et al14 in their scoping review aimed at identifying protocols for measuring HGS in a geriatric population, verified that the use of the maximum force is more appropriate and recommended for interpreting muscle strength in older adults. Due to the high fatigability in frail patients, the mean of three measures is likely to be lower than their maximal grip strength.14
To our knowledge, the only study that previously verified the reliability of using HGS for sarcopenia screening in older people with cognitive impairment showed excellent test-retest reliability for individuals with mild to moderate dementia (ICC=0.96; p = 0.001 and ICC=0.97; p = 0.001, respectively). However, the test was not reliable for those with severe dementia.8 In that study, the mean of three trials was used. Since the present study did not find any significant difference between the use of the first trial and the mean of three trials, it suggests the possibility of using just the first trial as a method to screen for sarcopenia in this population.
When analyzing the agreement of the measures for muscle weakness according to the sarcopenia cutoff of the EWGSOP2,4 the results of the first trial showed substantial concordance (K = 94 %) with the mean of three trials, with only 2.8 % of the weak older adults being classified as having normal strength using the first trial. When the highest of three trials was used for classification, there was substantial concordance (K = 89.4 %) with the mean of three trials, where 8.3 % of the weak older adults would be identified as having normal strength, and 91.7 % would be correctly classified as having muscle weakness.
The MDC95 for HGS testing was determined to identify the magnitude of improvement needed to exceed measurement error. The small measurement errors obtained with older adults with cognitive impairment when using the first trial values (1.77–5.89 kgf) suggest that a single trial is useful for monitoring changes over time. These MDCs provide useful criteria for goal setting and interpretation of changes in handgrip strength for older adults with cognitive impairment participating in sarcopenia treatment and prevention programs.
The present study had some limitations. Most (75 %) of our sample with cognitive impairment included older people with low level of education (less than four years study) and who were sedentary (93 %). The criteria used to classify cognitive impairment18 and identify eligible participants could be questioned in light of more current criteria.28 However, 82 % of participants scored 19 points or less, regardless of educational level. Additionally, although we stratified the sample into people with cognitive impairment and with dementia, they were not classified according to the cognitive impairment stages as mild, moderate, or severe. Therefore, our results are limited to this population, and we cannot affirm that these results can be generalized.
ConclusionThis study suggests that a single trial of HGS can be used in the process of screening for sarcopenia in older adults with cognitive impairment. The diagnosis of muscle weakness using the first trial, the mean of three trials, and the maximum value of three trials showed excellent concordance.


