


The relationship between cardiorespiratory fitness and its possible determinants in post-COVID-19 survivors has not been systematically assessed.
ObjectivesTo identify and summarize studies comparing cardiorespiratory fitness measured by cardiopulmonary exercise testing in COVID-19 survivors versus non-COVID-19 controls, as well as to determine the influence of potential moderating factors.
MethodsWe conducted a systematic search of MEDLINE/PubMed, Cochrane Library, EMBASE, Google Scholar, and SciELO since their inceptions until June 2022. Mean differences (MD), standard mean differences (SMD), and 95% confidence intervals (CI) were calculated. Subgroup and meta-regression analyses were used to evaluate potential moderating factors.
Results48 studies (3372 participants, mean age 42 years, and with a mean testing time of 4 months post-COVID-19) were included, comprising a total of 1823 COVID-19 survivors and 1549 non-COVID-19 controls. After data pooling, VO2 peak (SMD=1.0 95% CI: 0.5, 1.5; 17 studies; N = 1273) was impaired in COVID-19 survivors. In 15 studies that reported VO2 peak values in mL/min/kg, non-COVID-19 controls had higher peak VO2 values than COVID-19 survivors (MD=6.2, 95% CI: 3.5, 8.8; N = 905; I2=84%). In addition, VO2 peak was associated with age, time post-COVID-19, disease severity, presence of dyspnea, and reduced exercise capacity.
ConclusionThis systematic review provides evidence that cardiorespiratory fitness may be impaired in COVID-19 survivors, especially for those with severe disease, presence of dyspnea, and reduced exercise capacity. Furthermore, the degree of reduction of VO2 peak is inversely associated with age and time post-COVID.
Cardiorespiratory fitness refers to the capacity of the circulatory and respiratory systems to supply oxygen to skeletal muscle mitochondria for energy production needed during physical activity.1 Cardiorespiratory fitness has been considered a vital sign by the American Heart Association.2 Low cardiorespiratory fitness is associated to health outcomes and mortality, even in healthy individuals.2,3 Cardiorespiratory fitness is also a clinical hallmark of chronic conditions, such as cardiovascular diseases.3,4
The gold standard method to assess cardiorespiratory fitness is exercise testing to measure peak oxygen consumption (VO2 peak).2,5 Therefore, the importance of assessing cardiorespiratory fitness by cardiopulmonary exercise test has gained even more attention in the Coronavirus Disease 2019 (COVID-19) pandemic.5
Recently, a systematic review that included 35 studies concluded that COVID-19 survivors had reduced levels of physical function, activities of daily living, and health-related quality of life.6 Furthermore, incomplete recovery of physical function, and performance in activities of daily living were observed 1 to 6 months post-infection. Thus, physical disability is a common condition in COVID-19 survivors.6 According to Arena & Faghy,5 the evidence that COVID-19 has upon cardiorespiratory fitness is not surprising given the potential impact of COVID-19 on the cardiac, pulmonary, and skeletal muscular systems.5 In addition, Rahmati et al. ,7 published a recent meta-analysis to analyze the long-term sequelae conditions of COVID-19. Their findings suggest that 2-year after recovery from severe acute respiratory syndrome coronavirus 2 (SARS-CoV-2) infection, 41.7% of survivors still present with either neurological, physical, or psychological sequela.7
It is well established that cardiopulmonary exercise test gives valid information regarding cardiorespiratory fitness impairment and insights about the mechanisms of this reduction.5,8 Analyzing the impact of COVID-19 on cardiorespiratory fitness and its determinants is particularly important to improve clinical-decision making in the context of rehabilitation.5,8
The purpose of this systematic review and meta-analysis was to identify and summarize studies comparing cardiorespiratory fitness using cardiopulmonary exercise testing between COVID-19 survivors versus non-COVID-19 controls, as well as to summarize the determinants of cardiorespiratory fitness.
MethodsThis systematic review was designed and performed in accordance with the recommendations from the Cochrane Handbook9 and completed in accordance with the PRISMA guidelines.10 This systematic review was registered with PROSPERO 2022: CRD42022325991. Available from: https://www.crd.york.ac.uk/prospero/display_record.php?ID=CRD42022325991
Eligibility criteriaThis systematic review included studies that investigated cardiorespiratory fitness measured by cardiopulmonary exercise test in COVID-19 survivors. Studies were eligible for this systematic review if they met the following criteria: a) Population: adult COVID-19 survivors (≥18 years); b) outcome: studies that investigated cardiorespiratory fitness measured by cardiopulmonary exercise test; c) study design: observational (cross-sectional, case-control, or cohort) studies with or without age-matched non-COVID-19 controls. Studies that enrolled patients with other pre-existing cardiopulmonary, neurological, oncological, and/or musculoskeletal diseases were excluded.
The primary outcome of this study was a cardiorespiratory fitness measure, VO2 peak expressed in mL/min/kg or L/min. Secondary outcomes were oxygen consumption at anaerobic threshold (VO2 AT) (mL/min/kg or L/min), first and/or second ventilatory threshold, and maximal workload in the cardiopulmonary exercise test.
Information sources and search strategyWe screened the MEDLINE/PubMed, Cochrane Library, EMBASE, Google Scholar, and Scientific Electronic Library Online (SciELO) from inception to June 2022, without language restrictions. For gray literature search, Opengrey and Proquest were used. A standard protocol for this search was developed and whenever possible, controlled vocabulary (Mesh term for PubMed and Cochrane) was used. Keywords and their synonyms were used for a more sensitive search.9
Search strategyThe strategy developed by Higgins and Green9 was used to identify the published studies in MEDLINE/PubMed. To identify the studies in the other databases, an adapted search strategy using similar terms was adopted. For the preparation of the search strategy, three groups of keywords were used: study design, participants, and outcomes. The search strategy for MEDLINE via PubMed, EMBASE, Cochrane library, and Scielo are presented in Supplementary material - Table S1. We checked the reference lists used in articles included in this systematic review to identify other potentially eligible studies.
Data collection and analysisEach identified title and abstract were independently evaluated by two reviewers. If at least one of the reviewers considered one reference eligible, the full text was obtained for complete assessment. Two reviewers independently assessed the full texts to verify if they met the eligibility criteria. In case of any disagreement, authors discussed the reasons for their decisions and a consensual decision was made.
Two reviewers independently extracted data from the published reports using standard data extraction forms adapted from the Cochrane Handbook.9 The following variables were summarized in a pre-formatted spreadsheet: authors, year of publication, inclusion/exclusion criteria, characteristics of study participants (n, age, sex, body mass index, comorbidities, disease severity, hospitalization, time post-COVID-19).
The software EndNote X7.8 (Clarivate, Philadelphia, PA) was used for analysis of eligibility criteria and duplicate analysis. Thus, all studies selected from the databases were exported in an appropriate file and analyzed in the software EndNote X7.8. Then, the exported files were also added to the Rayyan Software for evaluation, selection, and data extraction independently by two reviewers. Aspects of the study population, measures performed, follow-up period and rates of missing data, outcome measures, and results were reviewed.
Risk of bias assessmentTwo independent reviewers assessed the methodological quality and risk of bias for all studies, using the Newcastle Ottawa Quality Assessment Scale (NOS)11 for observational cohort and case-control studies, and the Newcastle Ottawa Quality Assessment Scale adapted for cross-sectional studies. With the original version, all studies were judged based on 8 items grouped into 3 major domains (participant selection, group comparability, and ascertainment of exposure); scores range from 0 to 9, with scores ≥7 indicating high quality. The modified and adapted NOS evaluates 7 methodological items and their reporting (scores 0−10), with scores ≥7 consistent with high-quality studies.11
Data analysisFor continuous data (VO2 peak, VO2AT), the mean difference between-groups (COVID-19 group vs non-COVID-19 controls or data before the pandemic) was calculated with pertinent 95% confidence intervals (CIs). An α value <0.05 was considered statistically significant. Statistical heterogeneity of the treatment effect among studies was assessed using Cochran's Q test and the I2 inconsistency test statistic, in which values 0–40%: might not be important; 30–60%: may represent moderate heterogeneity; 50–90%: may represent substantial heterogeneity; 75–100%: considerable heterogeneity.9 To investigate the influence of participant characteristics and clinical outcomes on pooled meta-analysis, subgroup analyses (categorical covariates) and random-effects meta-regression (continuous covariates) were performed. Where applicable, subgroup analyses were performed to determine the associations among VO2 peak and categorical variables such as sex, previous physical activity (athletes vs non-athletes), dyspnea, and disease severity. Meta-regression analyses were performed to determine the associations among the VO2 peak and potential modulating factors (sample size, age, % females, body mass index, and post-COVID-19 time). In all meta-regression models, studies were weighted by the inverse variance of the dependent variable. Potential modulating factors were entered as independent variables in regressions models with VO2 peak as the dependent variable. To explore the robustness of our findings we performed a sensitivity analysis. We repeated the main analysis by including only high-quality studies (NOS score ≥7). We also repeated the analysis separating the studies by their design (cohort and cross-sectional). To re-express the SMD, we selected a study included in the original meta-analysis that we considered representative of the population with low risk of bias and multiplied its standard deviation by the pooled SMD. The analyses were conducted using Review Manager Version 5.4 (Cochrane Collaboration)12 and R 4.1.3.13
Funnel plots of effect size (Hedge's g) against the standard error, Begg rank correlation test, or Egger's regression test were used to assess publication bias if more than 10 studies were included in the meta-analysis.9
ResultsDescription of selected studiesThe initial search identified 7167 records. A total of 1183 records were excluded after reading the titles and abstracts, for not meeting the eligibility criteria. After a complete reading of 65 full-text records, 17 records were excluded (reasons presented in the flowchart and Supplementary material - Table S2). Finally, 48 studies14–61 met the eligibility criteria. Manual search did not find additional relevant studies. Supplementary material – Fig. S1 shows the flow diagram of studies in this review according to PRISMA guidelines.
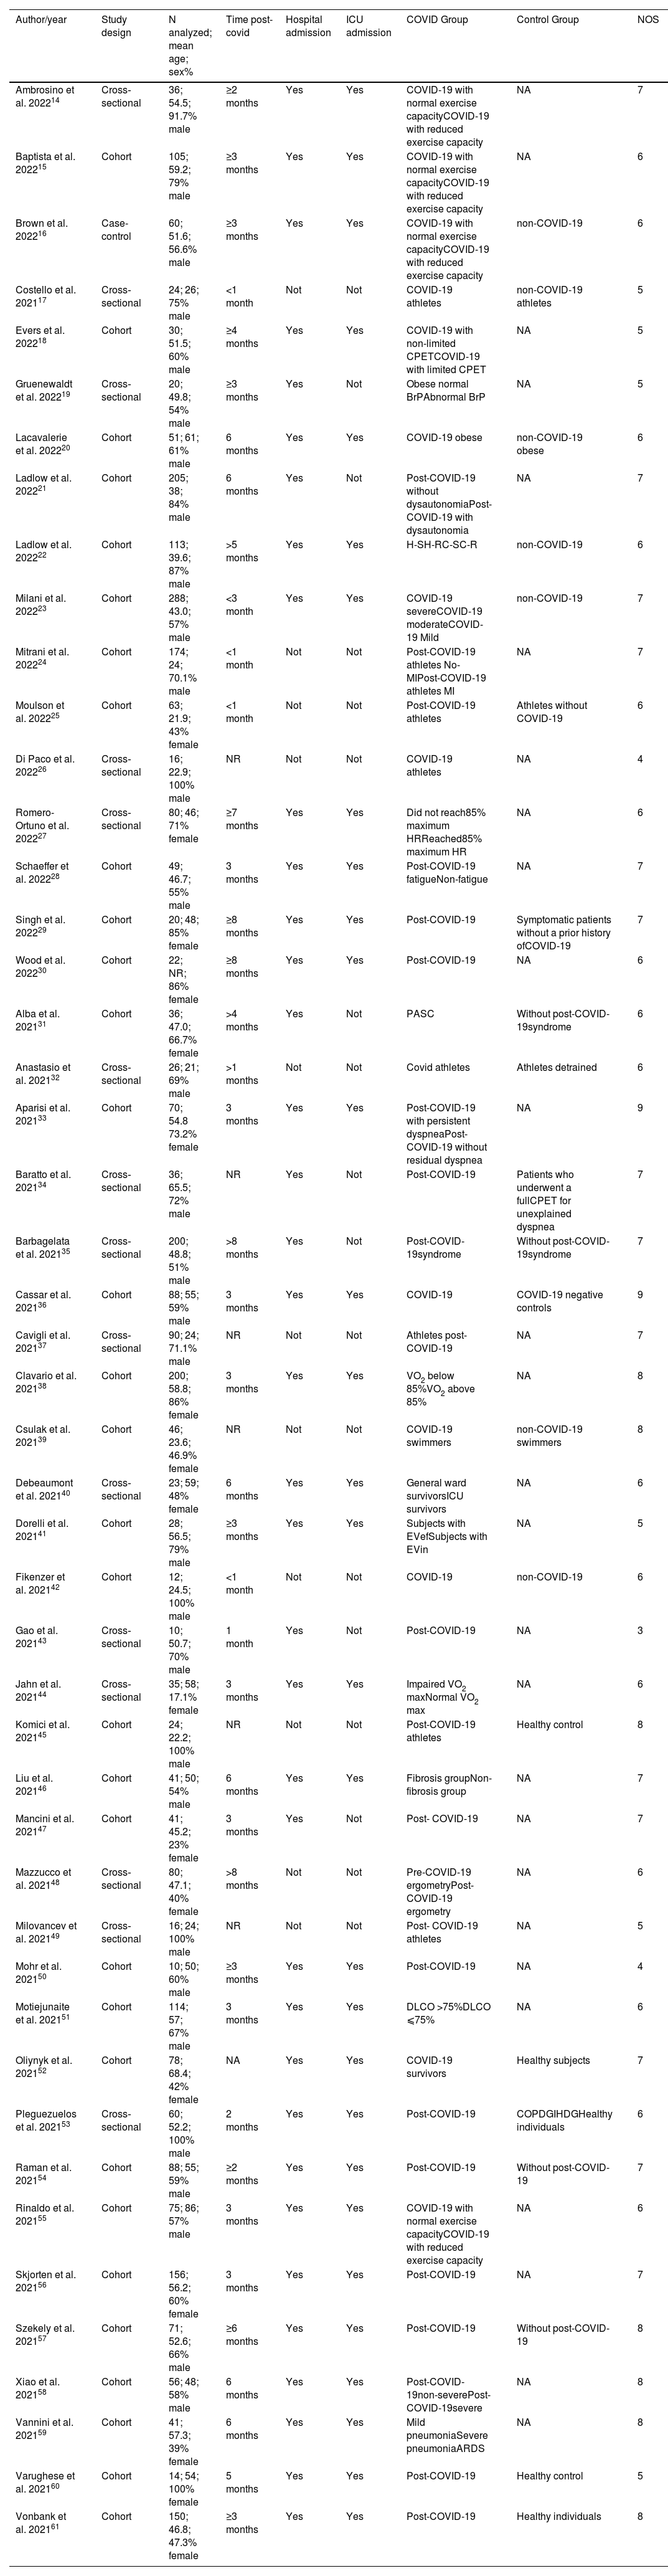
Of the 48 studies included in this systematic review, 32 were cohort, and 16 cross-sectional studies. For each study, design, sample size, sex, outcomes measures, methodological quality, and key findings were extracted (Table 1).
Characteristics of the participants of the studies included in the systematic review.
| Author/year | Study design | N analyzed; mean age; sex% | Time post-covid | Hospital admission | ICU admission | COVID Group | Control Group | NOS |
|---|---|---|---|---|---|---|---|---|
| Ambrosino et al. 202214 | Cross‐sectional | 36; 54.5; 91.7% male | ≥2 months | Yes | Yes | COVID-19 with normal exercise capacityCOVID-19 with reduced exercise capacity | NA | 7 |
| Baptista et al. 202215 | Cohort | 105; 59.2; 79% male | ≥3 months | Yes | Yes | COVID-19 with normal exercise capacityCOVID-19 with reduced exercise capacity | NA | 6 |
| Brown et al. 202216 | Case-control | 60; 51.6; 56.6% male | ≥3 months | Yes | Yes | COVID-19 with normal exercise capacityCOVID-19 with reduced exercise capacity | non-COVID-19 | 6 |
| Costello et al. 202117 | Cross‐sectional | 24; 26; 75% male | <1 month | Not | Not | COVID-19 athletes | non-COVID-19 athletes | 5 |
| Evers et al. 202218 | Cohort | 30; 51.5; 60% male | ≥4 months | Yes | Yes | COVID-19 with non-limited CPETCOVID-19 with limited CPET | NA | 5 |
| Gruenewaldt et al. 202219 | Cross‐sectional | 20; 49.8; 54% male | ≥3 months | Yes | Not | Obese normal BrPAbnormal BrP | NA | 5 |
| Lacavalerie et al. 202220 | Cohort | 51; 61; 61% male | 6 months | Yes | Yes | COVID-19 obese | non-COVID-19 obese | 6 |
| Ladlow et al. 202221 | Cohort | 205; 38; 84% male | 6 months | Yes | Not | Post-COVID-19 without dysautonomiaPost-COVID-19 with dysautonomia | NA | 7 |
| Ladlow et al. 202222 | Cohort | 113; 39.6; 87% male | >5 months | Yes | Yes | H-SH-RC-SC-R | non-COVID-19 | 6 |
| Milani et al. 202223 | Cohort | 288; 43.0; 57% male | <3 month | Yes | Yes | COVID-19 severeCOVID-19 moderateCOVID-19 Mild | non-COVID-19 | 7 |
| Mitrani et al. 202224 | Cohort | 174; 24; 70.1% male | <1 month | Not | Not | Post-COVID-19 athletes No-MIPost-COVID-19 athletes MI | NA | 7 |
| Moulson et al. 202225 | Cohort | 63; 21.9; 43% female | <1 month | Not | Not | Post-COVID-19 athletes | Athletes without COVID-19 | 6 |
| Di Paco et al. 202226 | Cross‐sectional | 16; 22.9; 100% male | NR | Not | Not | COVID-19 athletes | NA | 4 |
| Romero-Ortuno et al. 202227 | Cross‐sectional | 80; 46; 71% female | ≥7 months | Yes | Yes | Did not reach85% maximum HRReached85% maximum HR | NA | 6 |
| Schaeffer et al. 202228 | Cohort | 49; 46.7; 55% male | 3 months | Yes | Yes | Post-COVID-19 fatigueNon-fatigue | NA | 7 |
| Singh et al. 202229 | Cohort | 20; 48; 85% female | ≥8 months | Yes | Yes | Post-COVID-19 | Symptomatic patients without a prior history ofCOVID-19 | 7 |
| Wood et al. 202230 | Cohort | 22; NR; 86% female | ≥8 months | Yes | Yes | Post-COVID-19 | NA | 6 |
| Alba et al. 202131 | Cohort | 36; 47.0; 66.7% female | >4 months | Yes | Not | PASC | Without post-COVID-19syndrome | 6 |
| Anastasio et al. 202132 | Cross‐sectional | 26; 21; 69% male | >1 months | Not | Not | Covid athletes | Athletes detrained | 6 |
| Aparisi et al. 202133 | Cohort | 70; 54.8 73.2% female | 3 months | Yes | Yes | Post-COVID-19 with persistent dyspneaPost-COVID-19 without residual dyspnea | NA | 9 |
| Baratto et al. 202134 | Cross‐sectional | 36; 65.5; 72% male | NR | Yes | Not | Post-COVID-19 | Patients who underwent a fullCPET for unexplained dyspnea | 7 |
| Barbagelata et al. 202135 | Cross‐sectional | 200; 48.8; 51% male | >8 months | Yes | Not | Post-COVID-19syndrome | Without post-COVID-19syndrome | 7 |
| Cassar et al. 202136 | Cohort | 88; 55; 59% male | 3 months | Yes | Yes | COVID-19 | COVID-19 negative controls | 9 |
| Cavigli et al. 202137 | Cross‐sectional | 90; 24; 71.1% male | NR | Not | Not | Athletes post-COVID-19 | NA | 7 |
| Clavario et al. 202138 | Cohort | 200; 58.8; 86% female | 3 months | Yes | Yes | VO2 below 85%VO2 above 85% | NA | 8 |
| Csulak et al. 202139 | Cohort | 46; 23.6; 46.9% female | NR | Not | Not | COVID-19 swimmers | non-COVID-19 swimmers | 8 |
| Debeaumont et al. 202140 | Cross‐sectional | 23; 59; 48% female | 6 months | Yes | Yes | General ward survivorsICU survivors | NA | 6 |
| Dorelli et al. 202141 | Cohort | 28; 56.5; 79% male | ≥3 months | Yes | Yes | Subjects with EVefSubjects with EVin | NA | 5 |
| Fikenzer et al. 202142 | Cohort | 12; 24.5; 100% male | <1 month | Not | Not | COVID-19 | non-COVID-19 | 6 |
| Gao et al. 202143 | Cross‐sectional | 10; 50.7; 70% male | 1 month | Yes | Not | Post-COVID-19 | NA | 3 |
| Jahn et al. 202144 | Cross‐sectional | 35; 58; 17.1% female | 3 months | Yes | Yes | Impaired VO2 maxNormal VO2 max | NA | 6 |
| Komici et al. 202145 | Cohort | 24; 22.2; 100% male | NR | Not | Not | Post-COVID-19 athletes | Healthy control | 8 |
| Liu et al. 202146 | Cohort | 41; 50; 54% male | 6 months | Yes | Yes | Fibrosis groupNon-fibrosis group | NA | 7 |
| Mancini et al. 202147 | Cohort | 41; 45.2; 23% female | 3 months | Yes | Not | Post- COVID-19 | NA | 7 |
| Mazzucco et al. 202148 | Cross‐sectional | 80; 47.1; 40% female | >8 months | Not | Not | Pre-COVID-19 ergometryPost-COVID-19 ergometry | NA | 6 |
| Milovancev et al. 202149 | Cross‐sectional | 16; 24; 100% male | NR | Not | Not | Post- COVID-19 athletes | NA | 5 |
| Mohr et al. 202150 | Cohort | 10; 50; 60% male | ≥3 months | Yes | Yes | Post-COVID-19 | NA | 4 |
| Motiejunaite et al. 202151 | Cohort | 114; 57; 67% male | 3 months | Yes | Yes | DLCO >75%DLCO ⩽75% | NA | 6 |
| Oliynyk et al. 202152 | Cohort | 78; 68.4; 42% female | NA | Yes | Yes | COVID-19 survivors | Healthy subjects | 7 |
| Pleguezuelos et al. 202153 | Cross‐sectional | 60; 52.2; 100% male | 2 months | Yes | Yes | Post-COVID-19 | COPDGIHDGHealthy individuals | 6 |
| Raman et al. 202154 | Cohort | 88; 55; 59% male | ≥2 months | Yes | Yes | Post-COVID-19 | Without post-COVID-19 | 7 |
| Rinaldo et al. 202155 | Cohort | 75; 86; 57% male | 3 months | Yes | Yes | COVID-19 with normal exercise capacityCOVID-19 with reduced exercise capacity | NA | 6 |
| Skjorten et al. 202156 | Cohort | 156; 56.2; 60% female | 3 months | Yes | Yes | Post-COVID-19 | NA | 7 |
| Szekely et al. 202157 | Cohort | 71; 52.6; 66% male | ≥6 months | Yes | Yes | Post-COVID-19 | Without post-COVID-19 | 8 |
| Xiao et al. 202158 | Cohort | 56; 48; 58% male | 6 months | Yes | Yes | Post-COVID-19non-severePost-COVID-19severe | NA | 8 |
| Vannini et al. 202159 | Cohort | 41; 57.3; 39% female | 6 months | Yes | Yes | Mild pneumoniaSevere pneumoniaARDS | NA | 8 |
| Varughese et al. 202160 | Cohort | 14; 54; 100% female | 5 months | Yes | Yes | Post-COVID-19 | Healthy control | 5 |
| Vonbank et al. 202161 | Cohort | 150; 46.8; 47.3% female | ≥3 months | Yes | Yes | Post-COVID-19 | Healthy individuals | 8 |
ARDS, Acute Respiratory Distress Syndrome; BrP, abnormal/normal breathing pattern; C-R, community-recovered; C-S, community-symptomatic; CON, control; COPD, chronic obstructive pulmonary disease group; COVIDG, COVID-19 group; COVID+ athletes, athletes who tested positive to COVID-19; COVID- athletes, athletes who tested negative to COVID-19; CPET, cardiopulmonary exercise testing; DLCO, diffusing capacity of the lung for carbon monoxide; EVef, exercise ventilatory efficiency; Evin, inefficiency exercise ventilatory; HDG, heart disease group; H-R,: hospitalized-recovered; H-S, hospitalized-symptomatic; NA, not analyzed; NOS, Newcastle-Ottawa scale; NR, not reported; PASC, patients post-acute sequelae of SARS-CoV-2 infection; PostCG, Post Covid Group; T0, before the sport season; T1,: immediately after return to COCID negative.
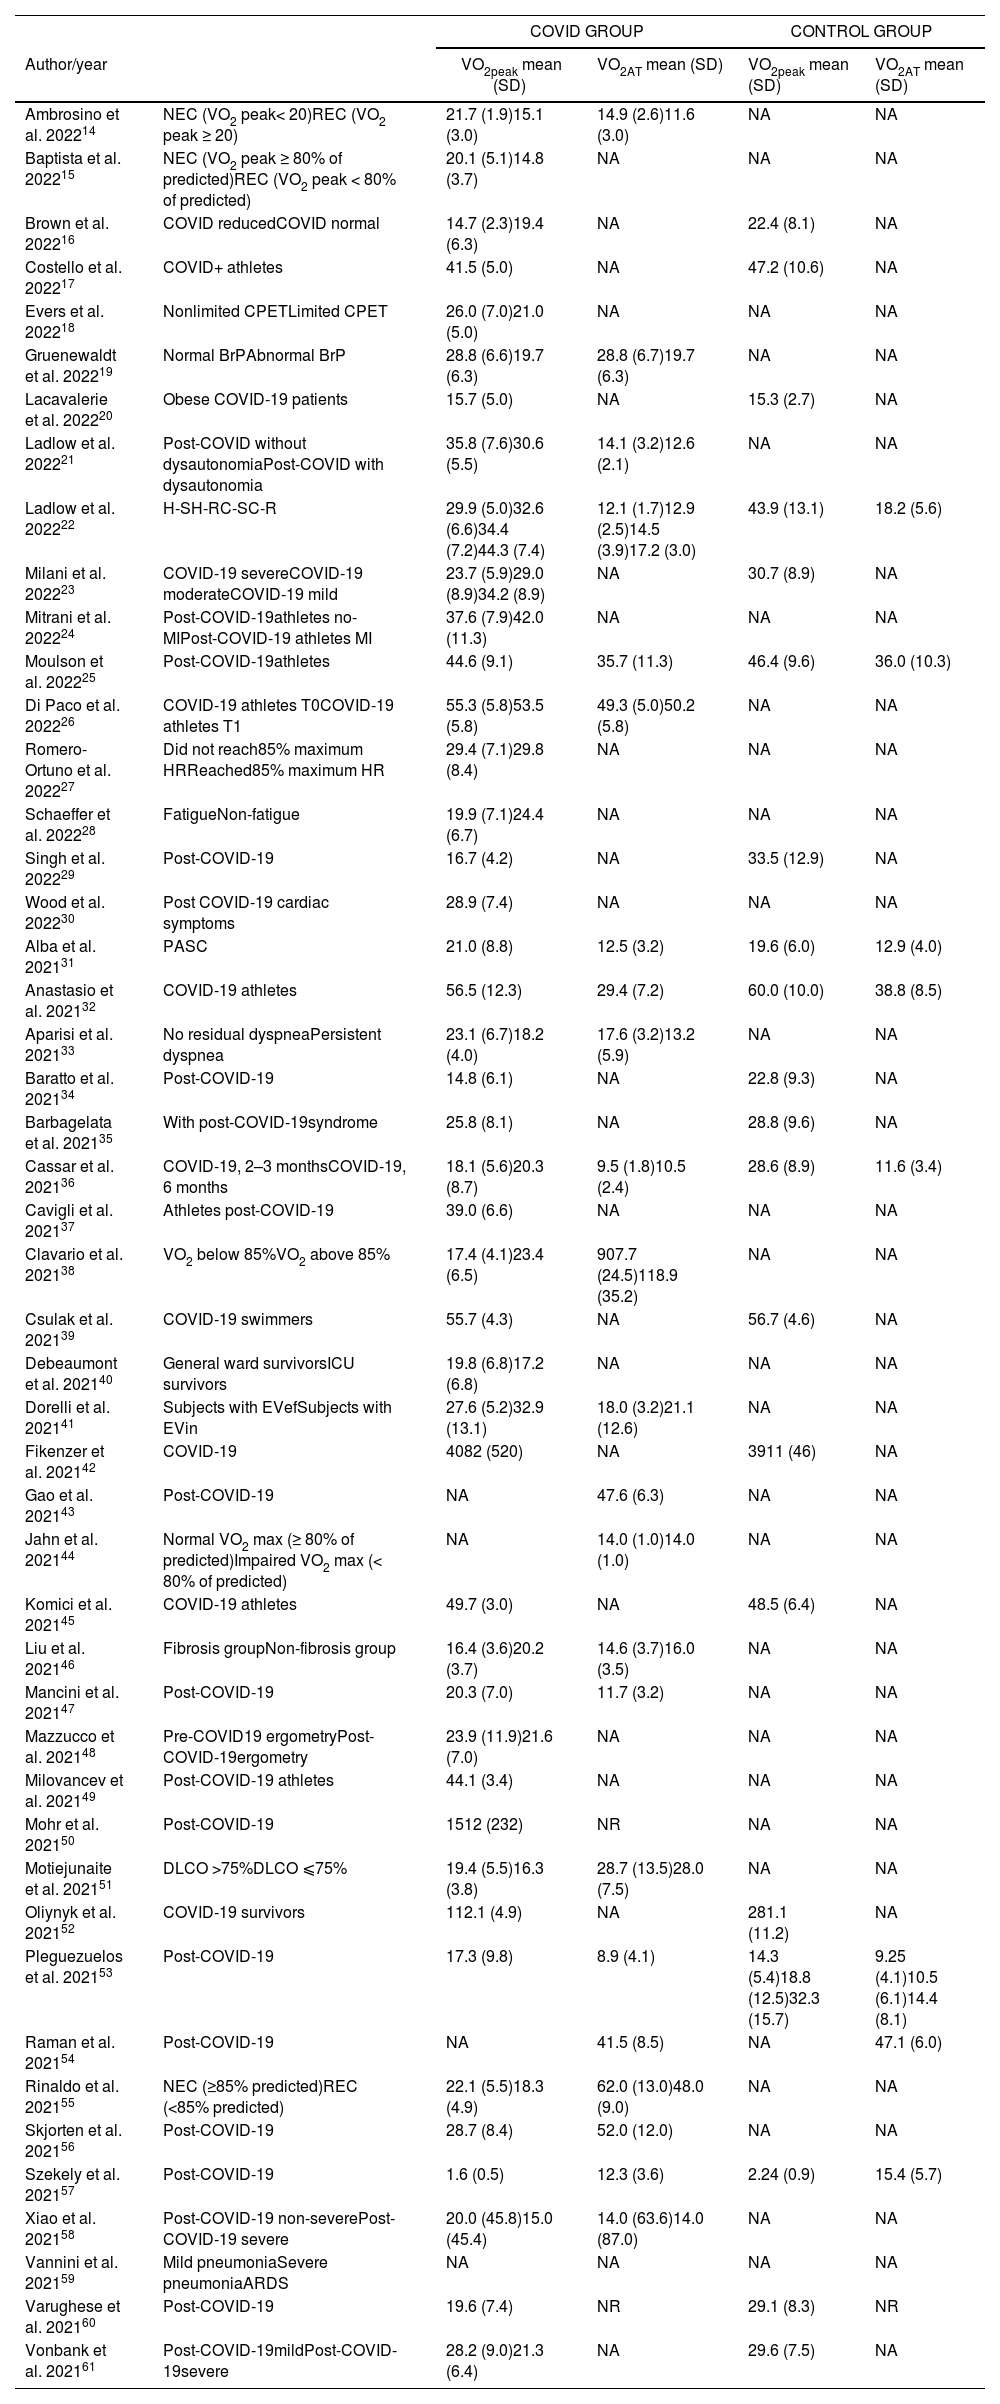
COVID-19-related outcomes on cardiorespiratory fitness measured by cardiopulmonary exercise test in included studies are described in Table 2. The % of predicted VO2 peak for both groups are presented in Supplementary material - Table S3. The mean quality of the studies was moderate-to-high, with an average score of 6.4 ± 1.2 (Supplementary material – Table S4).
Outcomes VO2peak, VO2AT, FVC, FEV1 for studies included in the systematic review.
| COVID GROUP | CONTROL GROUP | ||||
|---|---|---|---|---|---|
| Author/year | VO2peak mean (SD) | VO2AT mean (SD) | VO2peak mean (SD) | VO2AT mean (SD) | |
| Ambrosino et al. 202214 | NEC (VO2 peak< 20)REC (VO2 peak ≥ 20) | 21.7 (1.9)15.1 (3.0) | 14.9 (2.6)11.6 (3.0) | NA | NA |
| Baptista et al. 202215 | NEC (VO2 peak ≥ 80% of predicted)REC (VO2 peak < 80% of predicted) | 20.1 (5.1)14.8 (3.7) | NA | NA | NA |
| Brown et al. 202216 | COVID reducedCOVID normal | 14.7 (2.3)19.4 (6.3) | NA | 22.4 (8.1) | NA |
| Costello et al. 202217 | COVID+ athletes | 41.5 (5.0) | NA | 47.2 (10.6) | NA |
| Evers et al. 202218 | Nonlimited CPETLimited CPET | 26.0 (7.0)21.0 (5.0) | NA | NA | NA |
| Gruenewaldt et al. 202219 | Normal BrPAbnormal BrP | 28.8 (6.6)19.7 (6.3) | 28.8 (6.7)19.7 (6.3) | NA | NA |
| Lacavalerie et al. 202220 | Obese COVID-19 patients | 15.7 (5.0) | NA | 15.3 (2.7) | NA |
| Ladlow et al. 202221 | Post-COVID without dysautonomiaPost-COVID with dysautonomia | 35.8 (7.6)30.6 (5.5) | 14.1 (3.2)12.6 (2.1) | NA | NA |
| Ladlow et al. 202222 | H-SH-RC-SC-R | 29.9 (5.0)32.6 (6.6)34.4 (7.2)44.3 (7.4) | 12.1 (1.7)12.9 (2.5)14.5 (3.9)17.2 (3.0) | 43.9 (13.1) | 18.2 (5.6) |
| Milani et al. 202223 | COVID-19 severeCOVID-19 moderateCOVID-19 mild | 23.7 (5.9)29.0 (8.9)34.2 (8.9) | NA | 30.7 (8.9) | NA |
| Mitrani et al. 202224 | Post-COVID-19athletes no-MIPost-COVID-19 athletes MI | 37.6 (7.9)42.0 (11.3) | NA | NA | NA |
| Moulson et al. 202225 | Post-COVID-19athletes | 44.6 (9.1) | 35.7 (11.3) | 46.4 (9.6) | 36.0 (10.3) |
| Di Paco et al. 202226 | COVID-19 athletes T0COVID-19 athletes T1 | 55.3 (5.8)53.5 (5.8) | 49.3 (5.0)50.2 (5.8) | NA | NA |
| Romero-Ortuno et al. 202227 | Did not reach85% maximum HRReached85% maximum HR | 29.4 (7.1)29.8 (8.4) | NA | NA | NA |
| Schaeffer et al. 202228 | FatigueNon-fatigue | 19.9 (7.1)24.4 (6.7) | NA | NA | NA |
| Singh et al. 202229 | Post-COVID-19 | 16.7 (4.2) | NA | 33.5 (12.9) | NA |
| Wood et al. 202230 | Post COVID-19 cardiac symptoms | 28.9 (7.4) | NA | NA | NA |
| Alba et al. 202131 | PASC | 21.0 (8.8) | 12.5 (3.2) | 19.6 (6.0) | 12.9 (4.0) |
| Anastasio et al. 202132 | COVID-19 athletes | 56.5 (12.3) | 29.4 (7.2) | 60.0 (10.0) | 38.8 (8.5) |
| Aparisi et al. 202133 | No residual dyspneaPersistent dyspnea | 23.1 (6.7)18.2 (4.0) | 17.6 (3.2)13.2 (5.9) | NA | NA |
| Baratto et al. 202134 | Post-COVID-19 | 14.8 (6.1) | NA | 22.8 (9.3) | NA |
| Barbagelata et al. 202135 | With post-COVID-19syndrome | 25.8 (8.1) | NA | 28.8 (9.6) | NA |
| Cassar et al. 202136 | COVID-19, 2–3 monthsCOVID-19, 6 months | 18.1 (5.6)20.3 (8.7) | 9.5 (1.8)10.5 (2.4) | 28.6 (8.9) | 11.6 (3.4) |
| Cavigli et al. 202137 | Athletes post-COVID-19 | 39.0 (6.6) | NA | NA | NA |
| Clavario et al. 202138 | VO2 below 85%VO2 above 85% | 17.4 (4.1)23.4 (6.5) | 907.7 (24.5)118.9 (35.2) | NA | NA |
| Csulak et al. 202139 | COVID-19 swimmers | 55.7 (4.3) | NA | 56.7 (4.6) | NA |
| Debeaumont et al. 202140 | General ward survivorsICU survivors | 19.8 (6.8)17.2 (6.8) | NA | NA | NA |
| Dorelli et al. 202141 | Subjects with EVefSubjects with EVin | 27.6 (5.2)32.9 (13.1) | 18.0 (3.2)21.1 (12.6) | NA | NA |
| Fikenzer et al. 202142 | COVID-19 | 4082 (520) | NA | 3911 (46) | NA |
| Gao et al. 202143 | Post-COVID-19 | NA | 47.6 (6.3) | NA | NA |
| Jahn et al. 202144 | Normal VO2 max (≥ 80% of predicted)Impaired VO2 max (< 80% of predicted) | NA | 14.0 (1.0)14.0 (1.0) | NA | NA |
| Komici et al. 202145 | COVID-19 athletes | 49.7 (3.0) | NA | 48.5 (6.4) | NA |
| Liu et al. 202146 | Fibrosis groupNon-fibrosis group | 16.4 (3.6)20.2 (3.7) | 14.6 (3.7)16.0 (3.5) | NA | NA |
| Mancini et al. 202147 | Post-COVID-19 | 20.3 (7.0) | 11.7 (3.2) | NA | NA |
| Mazzucco et al. 202148 | Pre-COVID19 ergometryPost-COVID-19ergometry | 23.9 (11.9)21.6 (7.0) | NA | NA | NA |
| Milovancev et al. 202149 | Post-COVID-19 athletes | 44.1 (3.4) | NA | NA | NA |
| Mohr et al. 202150 | Post-COVID-19 | 1512 (232) | NR | NA | NA |
| Motiejunaite et al. 202151 | DLCO >75%DLCO ⩽75% | 19.4 (5.5)16.3 (3.8) | 28.7 (13.5)28.0 (7.5) | NA | NA |
| Oliynyk et al. 202152 | COVID-19 survivors | 112.1 (4.9) | NA | 281.1 (11.2) | NA |
| Pleguezuelos et al. 202153 | Post-COVID-19 | 17.3 (9.8) | 8.9 (4.1) | 14.3 (5.4)18.8 (12.5)32.3 (15.7) | 9.25 (4.1)10.5 (6.1)14.4 (8.1) |
| Raman et al. 202154 | Post-COVID-19 | NA | 41.5 (8.5) | NA | 47.1 (6.0) |
| Rinaldo et al. 202155 | NEC (≥85% predicted)REC (<85% predicted) | 22.1 (5.5)18.3 (4.9) | 62.0 (13.0)48.0 (9.0) | NA | NA |
| Skjorten et al. 202156 | Post-COVID-19 | 28.7 (8.4) | 52.0 (12.0) | NA | NA |
| Szekely et al. 202157 | Post-COVID-19 | 1.6 (0.5) | 12.3 (3.6) | 2.24 (0.9) | 15.4 (5.7) |
| Xiao et al. 202158 | Post-COVID-19 non-severePost-COVID-19 severe | 20.0 (45.8)15.0 (45.4) | 14.0 (63.6)14.0 (87.0) | NA | NA |
| Vannini et al. 202159 | Mild pneumoniaSevere pneumoniaARDS | NA | NA | NA | NA |
| Varughese et al. 202160 | Post-COVID-19 | 19.6 (7.4) | NR | 29.1 (8.3) | NR |
| Vonbank et al. 202161 | Post-COVID-19mildPost-COVID-19severe | 28.2 (9.0)21.3 (6.4) | NA | 29.6 (7.5) | NA |
ARDS, Acute Respiratory Distress Syndrome; BrP, breathing pattern; DLCO, diffusing capacity of the lung for carbon monoxide; C-R, community-recovered; C-S, community-symptomatic; CON, control; COPD, chronic obstructive pulmonary disease group; CPET, cardiopulmonary exercise testing; COVID+ athletes, athletes who tested positive to COVID-19; COVID- athletes, athletes who tested negative to COVID-19; COVIDG, COVID-19 group; H-R, hospitalized-recovered; H-S, hospitalized-symptomatic; HDG: heart disease group; HG: healthy group; MI: Myocardial involvement; NA: not analyzed; NR: not registered; NEC, Normal exercise capacity; No-Mi, No myocardial involvement;; REC, reduced exercise capacity; SD, standard deviation; T0, before the sport season; T1. immediately after return to COVID negative; VO2 AT, oxygen consumption at anaerobic threshold; VO2 peak: peak oxygen consumption in mL/min/kg or mL/min.
When pooling all studies together that compared COVID-19 survivors to non-COVID-19 controls (independent of the unit of measure of VO2 peak), we observed a significantly higher VO2 peak in the non-COVID-19 control group compared to COVID-19 survivors (SMD=1.1, 95% CI: 0.6, 1.6; 18 studies; N = 1491), with considerable heterogeneity across studies (I2 = 94%, P < 0.001), (Fig. 1). Re-expressing the SMD to VO2 peak values in mL/min/kg showed an MD of 7.7 mL/min/kg, 95% CI: 4.3, 11.4.

In the 15 studies with 16 arms (1123 participants) that reported VO2 peak values in mL/min/kg, non-COVID-19 controls showed higher VO2 peak values than COVID-19 survivors (MD=5.9 mL/min/kg, 95% CI: 3.8, 8.0; N = 905; I2 = 85%, P < 0.001) (Fig. 2). In a subgroup analysis, considering the previous physical activity status (athletes vs non-athletes), the meta-analysis showed a significantly higher VO2 peak for non-athletes non-COVID-19 survivors compared with non-athletes COVID-19 survivors (MD=7.6 mL/min/kg, 95% CI: 5.3, 10.1; 10 studies; N = 929; I2 = 83%, P < 0.001). When we performed a subgroup analysis with studies of athletes non-COVID-19 survivors compared with athletes COVID-19 survivors the meta-analyses showed a non-significant difference in VO2 peak (MD=2.4 mL/min/kg, 95% CI: −2.2, 7.0; 5 studies; N = 194; I2 = 84%, P = 0.31) (Fig. 2).

In another subgroup analysis, considering the disease severity (severe vs non-severe COVID-19), the meta-analyses showed a significantly higher VO2 peak for non-severe COVID-19 group compared with severe COVID-19 group (MD=4.97 mL/min/kg, 95% CI: 1.8, 8.1; 6 studies; N = 368; I2 = 86%, P < 0.002) (Fig. 3a). When we performed a subgroup analysis with studies considering the presence of dyspnea in COVID-19 survivors (dyspnea vs non-dyspnea), the meta-analysis showed a significantly higher VO2 peak for participants in the non-dyspnea COVID-19 group compared with dyspnea COVID-19 group (MD=6.0 mL/min/kg, 95% CI: 4.1, 7.8; 3 studies; N = 245; I2 = 35%, P < 0.001) (Fig. 3b). In another subgroup analysis, considering the exercise capacity in COVID-19 survivors (normal vs reduced exercise capacity) the meta-analysis showed a significantly higher VO2 peak for participants in the normal exercise capacity COVID-19 group compared with reduced exercise capacity COVID-19 group (MD=5.8 mL/min/kg, 95% CI: 4.9, 6.6; 6 studies; N = 526; I2 = 0%; P < 0.001) (Fig. 3c).

Across 8 studies evaluating VO2 AT that compared COVID-19 survivors to non-COVID-19 controls we found a significantly higher VO2 AT in non-COVID-19 controls than in COVID-19 survivors (MD=2.5 mL/min/kg, 95% CI: 1.3, 3.7), with moderate heterogeneity (I2 = 49%, N = 88, p < 0.001) (Fig. 3). In a subgroup analysis, considering the previous physical activity status (athletes vs non-athletes), the meta-analysis showed a significantly higher VO2 AT for non-athletes non-COVID-19 controls compared with non-athletes COVID-19 survivors (MD = 2.2 mL/min/kg, 95% CI: 1.3, 3.1; 6 studies; N = 399; I2 = 24%, P < 0.001). When we performed a subgroup analysis with studies of athletes non-COVID-19 controls compared with athletes COVID-19 survivors the meta-analyses showed a non-significant difference in VO2 AT (MD = 4.9 mL/min/kg, 95% CI: −4.9, 14.7; 2 studies; N = 89; I2 = 83%, P = 0.32). In addition, considering the disease severity (severe vs non-severe COVID-19), the meta-analysis showed a significantly higher VO2 AT for non-severe COVID-19 group compared with severe COVID-19 group (MD = 2.2 mL/min/kg, 95% CI: 0.8, 3.6; 3 studies; N = 210; I2 = 28%, P < 0.002).
Across 7 studies evaluating % of predicted VO2 peak, we found significantly higher % of predicted VO2 peak in non-COVID-19 controls than COVID-19 survivors (MD = 19%, 95% CI: 6.4, 31.4; N = 380), with considerable heterogeneity (I2 = 86%, p < 0.001). In a subgroup analysis, considering the previous physical activity status (athletes vs non-athletes), the meta-analysis showed a significantly higher % of predicted VO2 peak for non-athletes non-COVID-19 controls compared with non-athletes COVID-19 survivors (MD = 21.7 mL/min/kg, 95% CI: 7.3, 36.1; 6 studies; N = 399; I2 = 88%, P < 0.003). When we performed a subgroup analysis with studies of athletes non-COVID-19 controls compared with athletes COVID-19 survivors the analysis showed a non-significant difference in % of predicted VO2 peak (MD = 4.0 mL/min/kg, 95% CI: −10.6, 18.6; 1 studies; N = 89, P = 0.56).
Meta-regression analysesTwo factors (age and time post-COVID-19) were found to be significant (P < 0.05) and two factors (body mass index and % female) were found to be non-significant (P > 0.05) predictors in univariable analysis. Age and post-COVID-19 time were significantly associated with VO2 peak reduction in COVID-19 survivors compared to non-COVID-19 controls. Higher age was associated with a larger magnitude of COVID-19 survivors–control mean difference, that is, a mean reduction in VO2 peak of −0.20 mL/min/kg (95% CI: −0.34, −0.01; I2 = 80.2%) for each one-year increase in mean age across studies. Higher mean post-COVID-19 time across studies was associated with a larger magnitude of COVID-19 survivors versus non-COVID-19 controls mean difference, that is, a mean reduction in VO2 peak of −1.1 mL/min/kg (95% CI: −2.2, −1.0; I2 = 81.3%) for each one month increase in mean time post-COVID-19 across studies (Supplementary material – Figure S2).
Assessment of small study biasFor studies reporting VO2 peak there was no evidence of funnel plot asymmetry (Supplementary material - Fig. S3) and the Egger test was non-significant (P = 0.10).
Sensitivity analysisTo explore the robustness of our findings, we repeated the main analysis by including only high-quality studies (NOS score ≥7). In 11 high-quality studies (1125 participants), we observed a significantly higher VO2 peak in the non-COVID-19 control group compared to COVID-19 survivors (SMD= 1.4, 95% CI 0.7, 2.2; I2 = 96%, P < 0.0001).
In another sensitivity analysis we explored the influence of study design (cohort vs cross-sectional) on heterogeneity, and effect estimates of meta-analyses. We separated the meta-analyses for cohort studies and cross-sectional studies. As already reported before when pooling all 18 studies together that compared COVID-19 survivors to non-COVID-19 controls (independent of the unit of measure of VO2 peak), we observed a significantly higher VO2 peak in the non-COVID-19 control group compared to COVID-19 survivors (SMD = 1.1, 95% CI: 0.6, 1.6; N = 1491; I2 = 94%). Re-expressing the SMD to VO2 peak values in mL/min/kg showed an MD of 7.7 mL/min/kg (95% CI: 4.3, 11.4). In the 12 cohort studies (1015 participants), non-COVID-19 controls showed higher VO2 peak values than COVID-19 survivors (SMD=1.4 mL/min/kg, 95% CI: 0.7, 2.1; I2 = 95%). Re-expressing the SMD to VO2 peak values in mL/min/kg showed an MD of 9.8 mL/min/kg, 95% CI: 4.7, 14.2). In the 6 cross-sectional studies (476 participants), non-COVID-19 controls showed higher VO2 peak values than COVID-19 survivors (SMD = 0.8 mL/min/kg, 95% CI: 0.2, 1.4; I2 = 85%). Re-expressing the SMD to VO2 peak values in mL/min/kg showed an MD of 4.8 mL/min/kg, (95% CI: 1.2, 8.1).
As already reported before when pooling all studies (cohort and cross-sectional) together, we observed a significantly higher VO2 peak in the non-COVID-19 control group compared to COVID-19 survivors (MD = 5.4, 95% CI: 2.3, 8.4; I2 = 88%; 13 studies). In the 8 cohort studies (539 participants), non-COVID-19 controls showed higher VO2 peak values than COVID-19 survivors (MD=4.7 mL/min/kg, 95% CI: 0.9, 8.5; I2 = 88%). In the 8 cross-sectional studies (316 participants), non-COVID-19 controls showed higher VO2 peak values than COVID-19 survivors (MD=6.4 mL/min/kg, 95% CI: 0.7, 12.2; N = 905, I2 = 89%).
Across 8 studies evaluating VO2 AT that compared COVID-19 survivors to non-COVID-19 controls we found a significantly higher VO2 AT in non-COVID-19 controls than in COVID-19 survivors (MD = 2.5 mL/min/kg, 95% CI: 1.3, 3.7; I2 = 49%). In the 6 cohort studies (432 participants), non-COVID-19 controls showed higher VO2 AT values than COVID-19 survivors (MD = 2.0 mL/min/kg, 95% CI: 1.2, 2.8; I2 = 9%). In the 8 cross-sectional studies (56 participants), non-COVID-19 controls showed higher VO2 peak values than COVID-19 survivors (MD = 7.0 mL/min/kg, 95% CI: 2.8, 11.9; I2 = 41%).
DiscussionOverall, the meta-analyses demonstrate that absolute and predicted VO2 peak and VO2 AT may be impaired in COVID-19 survivors. Our analyses also showed that lower VO2 peak was associated with the disease severity, presence of dyspnea, and reduced exercise capacity. The MD in VO2 peak shows inverse linear associations with age and time post-COVID-19 between COVID-19 survivors and non-COVID-19 controls. Despite the significant difference on most outcomes between COVID-19 survivors and non-COVID-19 controls, the high risk of bias among included studies and substantial heterogeneity found in the meta-analyses, can affect the certainty of the evidence generated by this review.
In our analyses, we included VO2 peak, and VO2 AT, important outcomes associated with prognosis in patients with cardiopulmonary conditions. Thus, these findings (a MD above 7 mL/min/kg) should be viewed as clinically relevant, considering that decrement in cardiorespiratory fitness is associated with poor prognosis and high mortality in patients with chronic conditions.62–67 A cardiorespiratory fitness level <5 METs (1MET = 3.5 mL/min/kg) in adults is associated with high risk for mortality; cardiorespiratory fitness levels >8 to 10 METs are associated with increased survival. Additionally, each 5 mL/min/kg lower level of cardiorespiratory fitness corresponded to a 56% higher odds of cardiovascular risk factors.2 Thus, the information provided in our analysis may assist practitioners in the process of diagnosing and rehabilitating COVID-19 survivors.
Reduced cardiorespiratory fitness is the central hallmark of COVID-19 survivors. However, such abnormality is also common in different comorbidities, such as heart failure, making it difficult to differentiate the causes of impaired cardiorespiratory fitness, particularly in COVID-19 survivors. Whichever the etiology of reduced VO2 peak in COVID-19 survivors, the underlying mechanism(s) remain unclear. However, exercise performance limiting factors can be related to impaired ventilation, impaired circulation, deconditioning, or peripheral conditions.55
In healthy people at sea level, lung function does not limit VO2 peak. However, in COVID-19 patients, impaired gas perfusion and impaired lung function, because of the lung infection, may contribute to the decrease in maximal cardiorespiratory fitness. A previous meta-analysis showed a prevalence of 14% in low total lung capacity, 12% in low forced vital capacity, and 7% in low forced expiratory volume in the first second.68 On the other hand, in healthy people, peak cardiac output does limit VO2 peak. Cardiac output is represented by stroke volume x heart rate. Although inconclusive, it is possible that chronotropic incompetence may contribute to VO2 peak impairment, especially in the first few months of post-COVID-19 infection.69 Bed restriction and deconditioning (low O2 extraction, mitochondrial dysfunction, and muscles loss) can also be related to low VO2 peak in healthy people and in COVID-19 survivors.69
This systematic review provides important information to clinical practice and research, as we warn to the magnitude of low cardiorespiratory fitness of COVID-19 survivors. We also reinforce the need of rehabilitation protocols focused on cardiorespiratory fitness of this population, respecting the condition of each patient and the adaptation to the exercise protocol. In a recent meta-analysis, Pouliopoulou et al70 reported that rehabilitation interventions were associated with improvements in functional exercise capacity. These improvements had a 99% posterior probability of superiority when compared with current standard care.70 Chen et al,71 investigated the possible benefits of inspiratory muscle training on mechanical and clinical outcomes. They reported that significant improvements were found in change from baseline of VO2 max (MD: 4.54, 95% CI: 1.8, 7.3). Thus, physical rehabilitation interventions may be safe, feasible, and effective in COVID-19 patients discharged from the hospital and can improve a variety of clinically relevant outcomes.72
Considering that VO2 peak shows inverse linear associations with age and time post-COVID-19, special attention seems to be worth to be given to old people and to the timing to start the rehabilitation program. Future clinical trials should investigate if early rehabilitation can improve cardiorespiratory fitness more efficiently in these populations. Moreover, our findings reinforce the potential beneficial effect of good physical conditioning to mitigate loss in cardiorespiratory fitness post-COVID-19.
Limitations in the present systematic review need attention. Results were limited by heterogeneity among studies, insufficient standardization, and absence of control for confounders in individual studies. It is important to highlight the considerable heterogeneity found in the meta-analyses. These aspects are important and may question the certainty of the evidence generated by this review. In addition to the inclusion of different study designs (cohort and cross-sectional), clinical characteristics, such as (hospitalization, disease severity), type of population (athletes and non-athletes), and patient profile (symptomatic and asymptomatic) may have contributed to the high heterogeneity. Ultimately, sub-group and meta-regression analyses should be considered exploratory and not as proof of causality. Thus, we recommend caution in interpreting the results. On the other hand, a strength of this systematic review is the rigorous systematic review methodology that was used which was key to dealing effectively with a very heterogeneous literature. Additionally, we reported significant and non-significant comparisons, which allows a suggestion of possible determinants of VO2 peak in COVID-19 survivors. It is worth noting that despite the inclusion of prospective and cross-sectional studies, according to the sensitivity analysis performed, the reduction in VO2 was not influenced by the study design (cohort or cross-sectional).
ConclusionThis systematic review and meta-analysis suggest that cardiorespiratory fitness may be impaired in COVID-19 survivors, especially for those with severe disease, presence of dyspnea, and reduced exercise capacity, compared to non- COVID-19 controls. Furthermore, the degree of reduction of VO2 peak may be inversely associated with age and time post-COVID-19. Caution is important in interpreting the results due to high heterogeneity in the meta-analyses and high risk of bias among included studies.
None
Systematic review registration: PROSPERO CRD42022325991


