
Adaptive postural control can be impaired in the presence of frailty syndrome, given that this condition causes homeostatic dysregulation in physiological systems.
ObjectivesTo compare the center of pressure (CoP) displacements of non-frail, pre-frail, and frail elderly subjects in the standing position before and after postural transition of sitting and rising from a chair, using linear and nonlinear methods.
MethodsForty-two elderly subjects were divided into 3 groups: non-frail (n=15), pre-frail (n=15), and frail (n=12). The CoP displacements in the anteroposterior (AP) and mediolateral (ML) direction in the orthostatic position, 30s before and after sitting down and rising from a chair, were evaluated by means of linear measurements (root mean square (RMS), amplitude, and total average speed) and nonlinear measurements (corrected approximate entropy – CApEn), sample entropy (SampEn), and complexity index (CI) and its normalized versions.
ResultsAfter sitting and rising, there was an increase in RMS in the ML direction in all groups and in the AP direction in the non-frail and frail groups. The frail group showed no reduction in entropy values in either direction, and the pre-frail group showed no reduction in the ML direction.
ConclusionsThe results of this study indicate that, in the presence of frailty syndrome, the organization of CoP displacements does not show less regularity after sitting and rising from a chair, reflecting a possible impairment of the integration of the systems involved in postural control.
The aging process is associated with a decline in physiological reserves and a progressive homeostatic dysregulation in the physiological systems.1 Frailty syndrome occurs when the dysregulation of these physiologically interconnected systems exceeds a certain threshold, impairing the proper response to stressful events and/or external disturbances. Thus, frail elderly individuals present a clinical state of vulnerability characterized by increased risk of adverse outcomes such as mortality, institutionalization, hospitalization, loss of independence, and falls.2,3
Regarding falls, it is extremely important to assess postural control, which is responsible for maintaining balance and for postural adjustments to the surroundings, to the specific demands of a task, and to the intentionality of the individual's movement, e.g., posture transfer.4,5 For postural control to function properly, a complex interaction is needed between motor and sensory components that are integrated by the central nervous system.6,7 The assessment of postural control is usually conducted by linear analysis of center of pressure (CoP) displacements. CoP is the point of location of the vertical ground reaction force vector.5 Linear analysis quantifies the magnitude and/or variance of the CoP displacements; however postural control is organized in multiple control systems and feedback mechanisms that interact in a nonlinear way. Therefore, it would be important to add nonlinear analysis, which would characterize the dynamic organization of the CoP displacement. Tallon et al.8 claim that these measures provide new and complementary information.
Regarding frailty syndrome, Kang et al.9 report that frail elderly patients, in standing posture with eyes open, were less stable compared to pre-frail and non-frail patients, showing greater CoP displacement and a simplified (i.e., more regular and repetitive) organization of this displacement. Nevertheless, no studies were found that investigated whether the adaptive capacity of the postural control system after a voluntary disturbance, such as postural change, may be impaired in the presence of frailty syndrome. It is noteworthy that rising from the sitting position is a functional activity and a prerequisite to mobility in the orthostatic position that is often impaired in the elderly.10 Thus, the objective of this study was to compare CoP displacements in non-frail, pre-frail, and frail elderly patients in the standing position before and after the postural transition from sitting to standing, using linear and nonlinear methods.
The hypothesis of this study is that frail elderly patients would present reduced adaptive capacity of the postural control system after a voluntary disturbance of balance, i.e., after the postural transition from sitting to standing. This reduced capacity would be reflected by: (a) higher values of linear measurements in relation to other groups, indicating a greater CoP displacement, and (b) lower values of nonlinear measurements compared to the other groups, indicating a reduction in the interaction and integration of the sensorimotor systems involved in postural control.
MethodsParticipantsThe study sample included elderly patients of both sexes, divided into non-frail, pre-frail, and frail, according to the phenotype proposed by Fried et al.2 The sample size calculation was made a priori in G*Power (version 3.1.3, Kiel, Germany), which led to a sample containing 42 participants (power=80% effect size=0.4, and alpha=0.05).
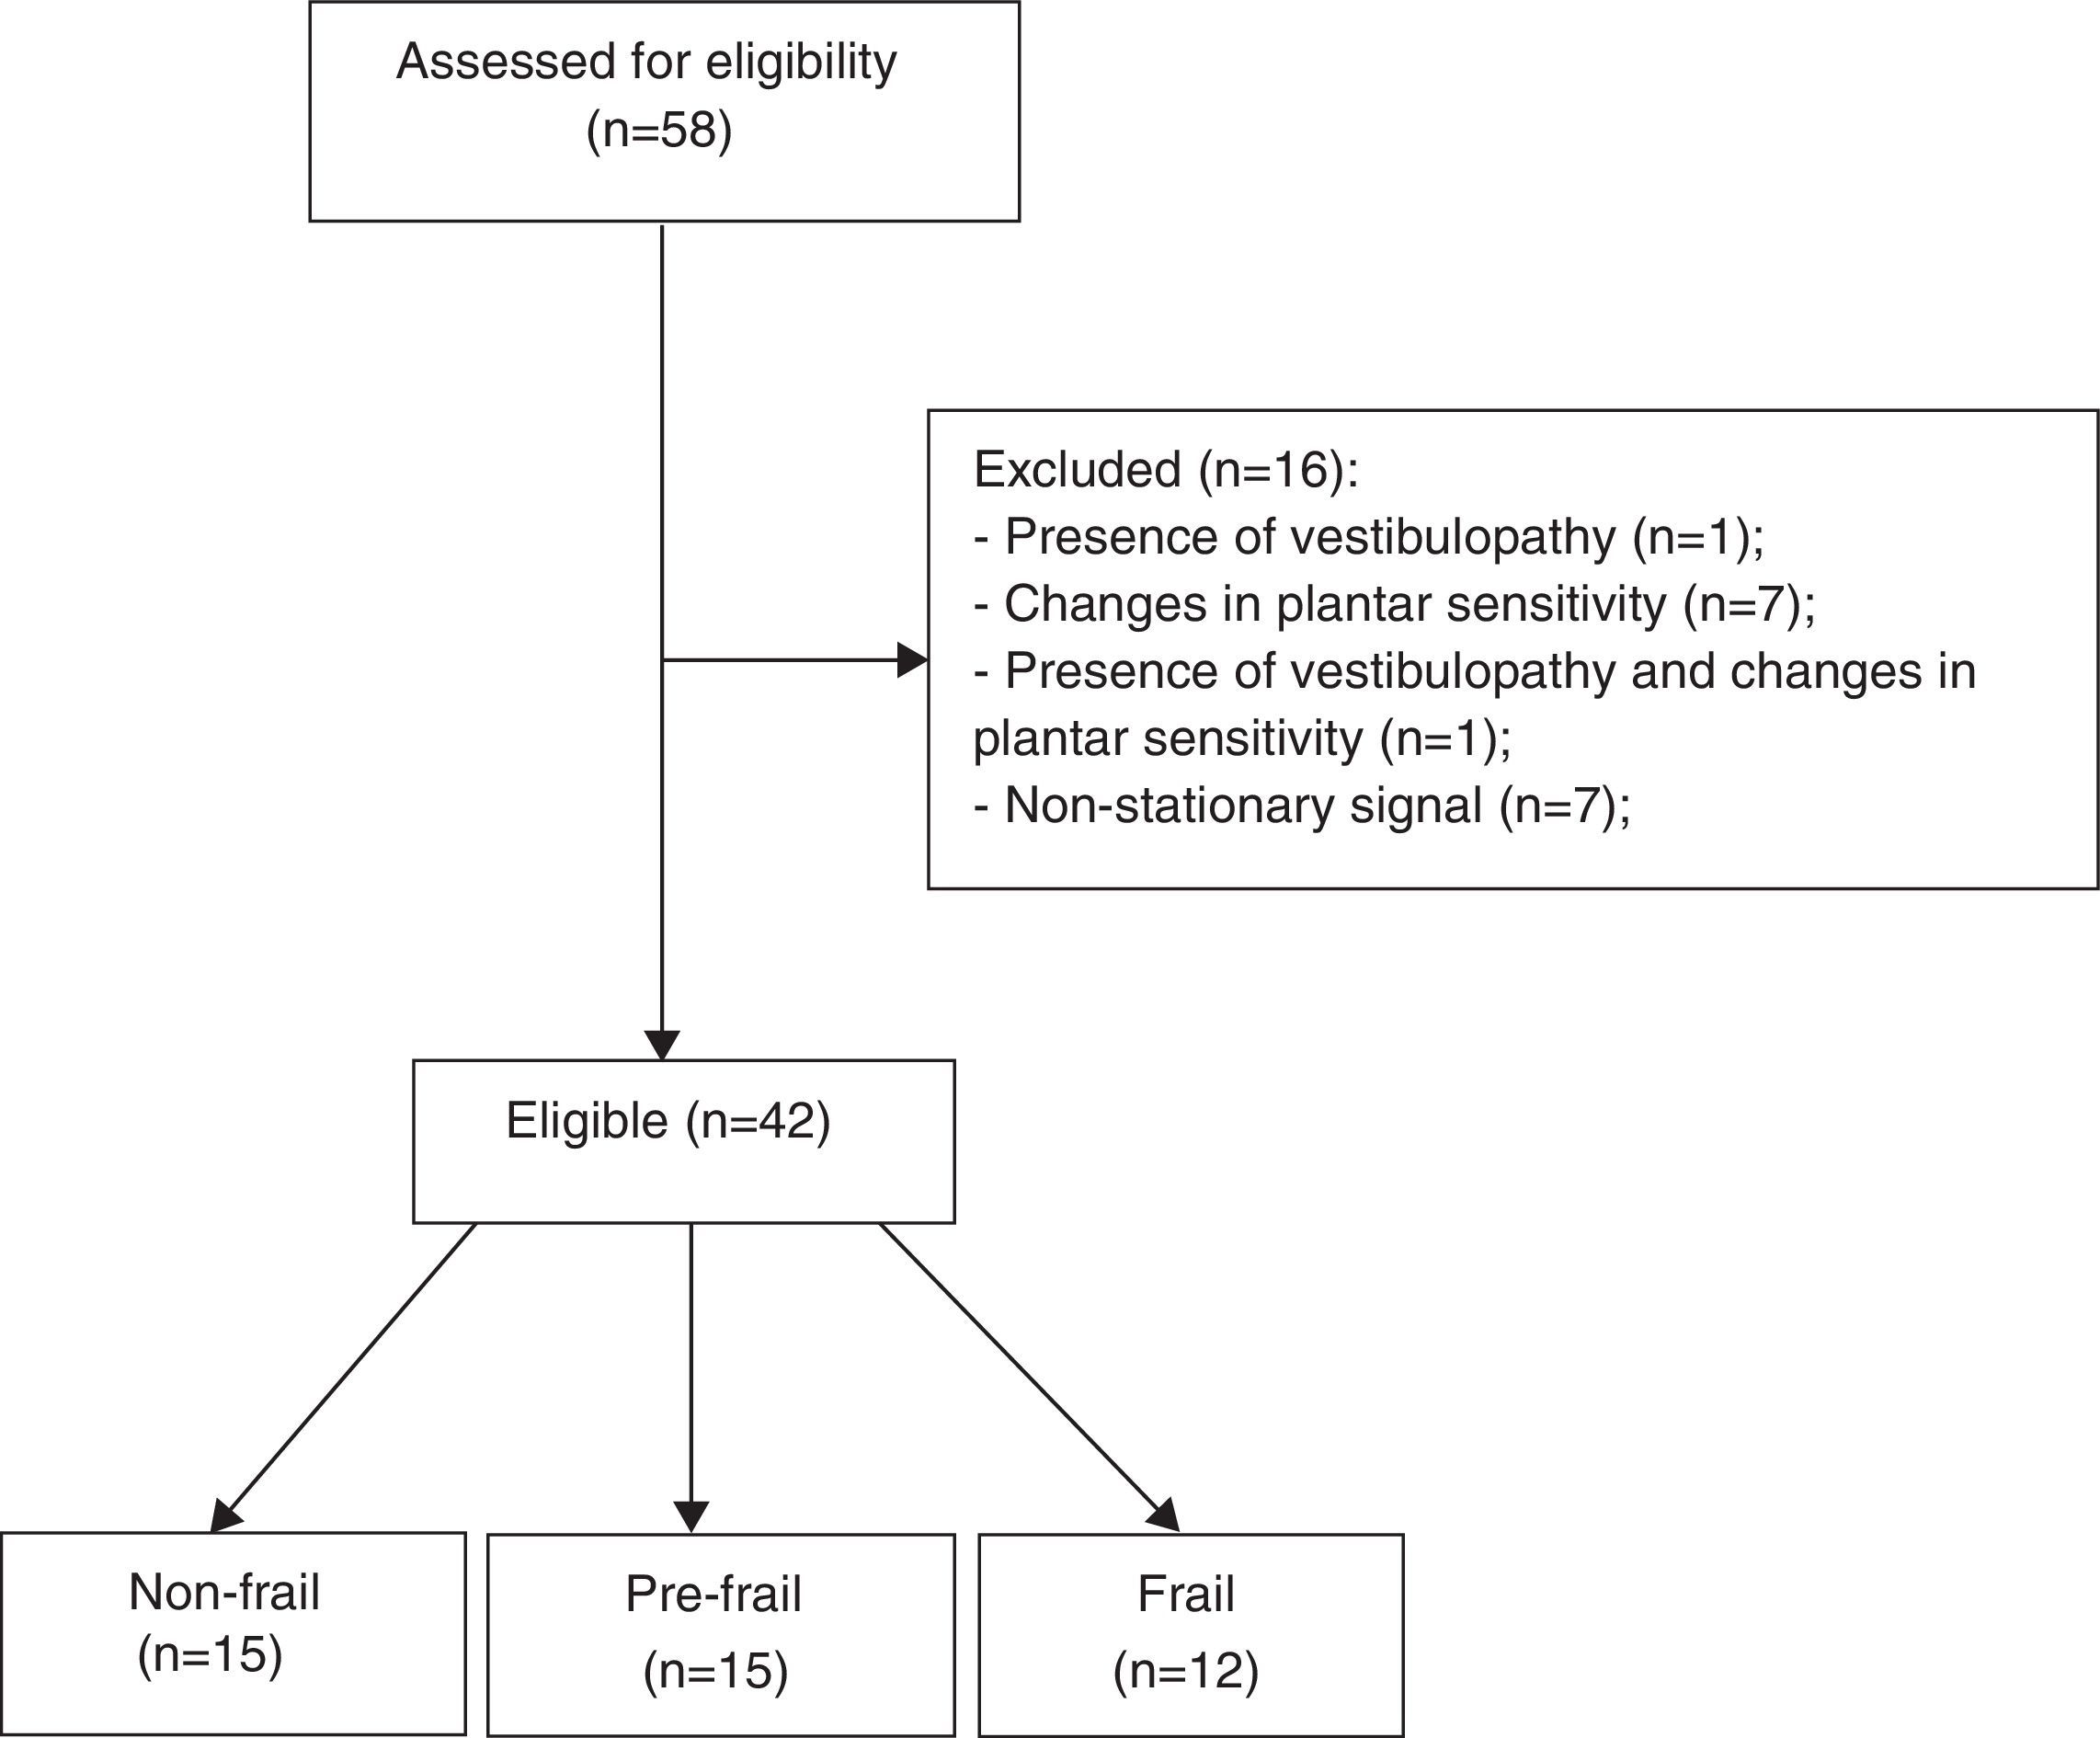
The inclusion criteria were age 60 years or older, ability to understand the instructions, and agreement to participate in the study. The exclusion criteria were as follows: (a) history of stroke with loss of strength and aphasia; (b) severe motor impairment; (c) Parkinson's disease; (d) peripheral neuropathy11 assessed by Semmes-Weinstein monofilaments 5:07 (10g)12; (e) visual disorders; (f) vestibular problems; (g) non-stationary posture oscillations; (h) the presence of cognitive impairment with scores ≤18 in the Mini-Mental State Examination (MMSE).2 The sample selection flowchart is shown in Fig. 1.

This study was approved by the Research Ethics Committee of Universidade Federal de São Carlos (UFSCar), São Carlos, SP, Brazil (approval no. 508205). After the experimental procedures were explained, the participants signed an informed consent form.
Experimental protocolMedical history and physical examinationMedical history, physical examination, and anthropometric data were carried out. The participants were asked about the occurrence of falls in the last year. Falls were defined as any non-accidental and involuntary event in which the participant lost their balance and fell to the floor or onto a hard surface.13 All elderly patients also performed the Timed Up and Go test (TUG), according to the instructions of Alexandre et al.14
FrailtyThe participants were screened according to the frailty phenotype proposed by Fried et al.,2 which evaluates reduced handgrip strength (below the 20th percentile of the population) adjusted for sex and body mass index, reduced walking speed (below the 20th percentile of the population) over a distance of 4.6 meters adjusted for sex and height, unintentional weight loss over the last year (4.5kg or more than 5% of body weight), self-reported exhaustion identified by the CES-D scale (Center Epidemiological Studies – Depression) and low physical activity level (below the 20th percentile of the population measured in kcal/week) according to the Minnesota Leisure Time Activity Questionnaire, translated and adapted for use in Brazil.15 Participants with three or more of these clinical signs were classified as frail. Those with one or two characteristics were classified as pre-frail, and those with none of these characteristics were considered non-frail.
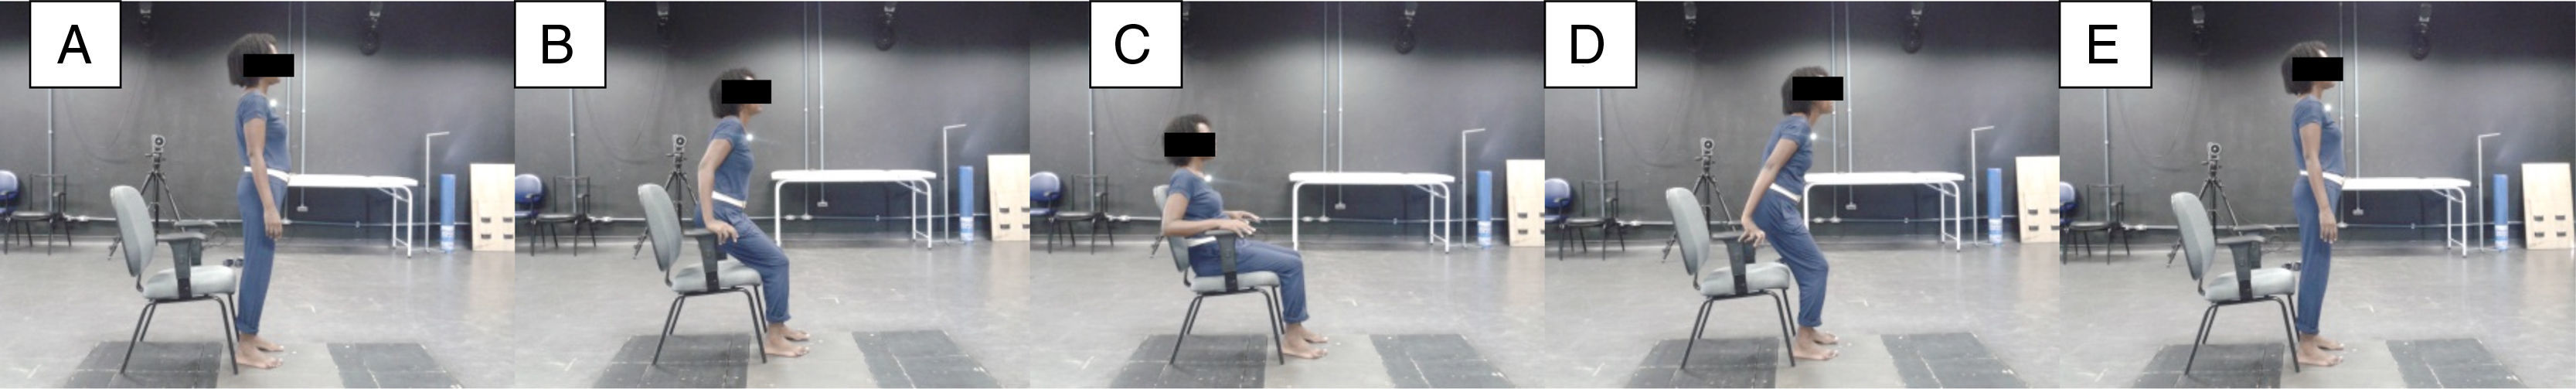
Postural controlThe CoP displacement in the anteroposterior direction (AP) and mediolateral (ML) were collected for 90s with a sampling frequency of 100Hz on a force platform (version 4.0.11, Bertec Corporation, Columbus, OH, USA). The test began with the participant in the standing posture for 30s. After this period, a standardized verbal command was given: “Attention. Sit.” The participant would sit on the chair and as soon as their trunk touched the backrest, the following command was given: “Attention. Rise.” The participant would then rise and remain in the standing position until the end of the collection, i.e., for 90s (Fig. 2). After that, the assessor told the participant that the collection time was completed and allowed a one-minute rest interval. The chair had armrests and its height was adjusted individually to keep knees and hips flexed to 90°. During the assessment, the participants were barefoot, with feet positioned hip-width apart and eyes open. The force platform was integrated and synchronized with the Qualisys motion analysis system (version 2.9, Qualisys AB Company, Gothenburg, Sweden), which uses eight optical digital cameras, with high speed and resolution. A reflective marker was placed on the participant's sternum manubrium to allow trimming of the data for the analysis of CoP displacements. Each participant performed three attempts.
Data analysisSelecting the segments to be analyzed 30s in the standing posture before sitting and rising from the chair; (B)–(D) transition from sitting to rising; (E) 30s in the standing posture after sitting and rising from the chair.")
The segments of data collection used for the CoP analysis were the 30s before and the 30s after the end of the activity of sitting and rising from the chair. To obtain these segments, a function was created in MATLAB (version 7.6.0.324, MathWorks Inc., Natick, MA, USA) using the position of the reflective marker indicating: (a) the time when the marker began moving toward the ground (start of the sitting movement), (b) the moment at which the marker reached the same height as the beginning of the data collection (end of the rising movement). Thus, the following were selected: (i) 30s prior to point “a” for the pre-task analysis and (ii) 30s after point “b” for the post-task analysis.
Pre-processingAfter obtaining the pre- and post-task segments, the signals of the CoP displacements were filtered with a fourth-order Butterworth filter with cutoff frequency of 10Hz.5 The signal was resampled from 100 to 20Hz for nonlinear analysis, resulting in 600-point sections, in order to reduce redundancy while preserving the essential information of the signal. The choice among the three attempts was based on the stationarity of the signal, which is a premise for the calculation of entropy. Stationarity was verified by observation of the behavior of the mean and variance of each signal, i.e., if it had no abrupt fluctuations of mean or variance. If a signal did not present stationarity, it was excluded from the study. If all attempts of the same participant showed stationarity, one was chosen at random.
Linear analysisFor this analysis, we calculated amplitude, root mean square (RMS), and total average speed (TAS) of CoP displacement. The amplitude corresponds to the distance between the maximum and the minimum CoP displacement evaluated for each direction. The RMS quantifies the dispersion of CoP displacement of the average position over a period of time. TAS determines how fast the CoP displacements were.5
Nonlinear analysisNonlinear analysis was performed by calculating entropy. Entropy is a measure of information carried by a time-series and has been widely used to quantify regularity of physiological signals.16 Entropy provides a characterization of the dynamic of a signal, which can vary between predictable and regular, frequently found when a regulatory mechanism takes priority over others, and unpredictable and random, characterizing a system with no degree of determinism, frequently found when different control mechanisms do not interact with each other.17 In this study, we calculated: (a) approximate entropy (ApEn) in the form referred to as corrected ApEn (CApEn), (b) sample entropy (SampEn), and (c) conditional entropy (CE) in the form referred to as corrected CE (CCE).
ApEn quantifies the regularity of short time series and has three input parameters defined as follows: m represents the length of the vector to be compared; r represents the radius within which the comparisons between the vectors are achieved (i.e., the similarity criterion); and N is the length of the series to be analyzed.18 According to Pincus and Huang,19 ApEn quantifies the logarithmic likelihood that vectors of length m that are close within the tolerance r will remain nearby after incrementing m by one. When ApEn is low, the process is regular and its complexity is negligible.18 When computing ApEn the reference vector is counted when computing the number of vectors close to it and this strategy biases the estimate of ApEn toward an excess of regularity. To reduce this bias, the CApEn was defined by substituting the excess of regularity with the maximal irregularity estimated in the series.20
SampEn exploited a different strategy to tackle the excess of regularity introduced by including the reference vector in the number of close neighbors of the reference vector. Indeed, SampEn simply excludes the reference vector from its nearby neighbors, thus avoiding undue increases in regularity.21 Similarly to CApEn, lower values for SampEn indicate regularity and predictability. In this study, CApEn and SampEn were computed with m=2, r=0.2 times the standard deviation of the signal, and N=600.
Additionally, we proposed the use of CE, which uses a metric to compute the distance between vectors and to evaluate similarity among them different from CApEn and SampEn.20,22 CE quantifies the information carried by a new sample, which cannot be obtained from a sequence of past values.22 Thus, it measures the complexity of CoP displacements, i.e., if the information carried by the most recent sample is low when the previous ones are known, the signal is more predictable and less complex. Conversely, if the most recent value is difficult to be predicted based on past values, the series is irregular. To calculate the CE, each time-series containing CoP displacement data was normalized by subtracting the mean and then dividing it by the standard deviation, thus obtaining the series expressed in dimensionless units. Next, the overall range of values (i.e., the difference between the minimum and the maximum of CoP displacement) was divided into 6 levels. Thus, the CoP displacements that were originally given in millimeters are converted into a sequence of symbols ranging from 0 to 6. From this nominal series, the symbols are grouped to form patterns and the length of the pattern was optimized. CE was corrected for the bias resulting from the null CE associated to the unique occurrence of a vector inside the series and the resulting function was referred to as corrected CE (CCE).20,22 It was shown that the CCE: (i) remains constant if past values are not helpful to reduce the information carried by the current value as in the case of white noise; (ii) CCE decreased to zero in case of entirely predictable signals, i.e., the current value did not add new information with respect to that contained in the past values; (iii) CCE showed a minimum if repetitive patterns were present but they were embedded in noise. Thus, the minimum value of the CCE as a function of past values, is defined to be the CI. This value can be normalized by the Shannon entropy of the signal, thus defining the normalized CI (NCI) and allowing us it to express the complexity in dimensionless units. NCI ranges from 0 (maximal regularity) to 1 (maximal complexity).23 The higher the CI and NCI is, the greater the complexity and the lower the regularity of the series. Both CApEn and SampEn were also presented in their normalized versions in order to reduce dependence on the Shannon entropy of the series and, thus, on the type of distribution of the signal.20,22,23
Statistical analysisThe Shapiro–Wilk test was used to verify the normality of the data distribution. The variables that did not present normal distribution were converted to log10. One-way ANOVA or Kruskal–Wallis with Dunn's post hoc were used to compare the groups regarding clinical and anthropometric characteristics. Two-way repeated measures ANOVA was used to evaluate the effect of the independent variables, i.e., groups and time (pre- and post-task) and their interaction for the linear and nonlinear CoP means (dependent variables). Where appropriate, multiple comparisons were performed using the Holm–Sidak test. The significance level for the tests was 5% and the statistical analysis was performed in SigmaPlot 11.0 (Systat Software, San Jose, CA, USA).
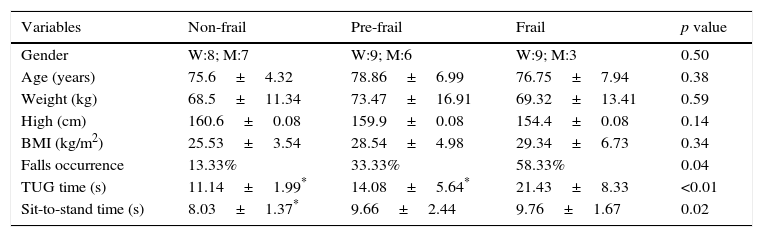
ResultsWe evaluated 42 participants: 15 classified as non-frail, 15 as pre-frail, and 12 as frail. The anthropometric characteristics of the participants are shown in Table 1. No significant differences were observed between the groups for clinical and anthropometric variables; however, the time required for the TUG was significantly higher in the frail group. An association was found between group and occurrence of falls, with the frail group falling more (58.33%) compared to the pre-frail (33.33%) and non-frail (13.33%) groups. Regarding the time for the movement of sitting and rising, the frail group was slower than the non-frail group.
Clinical and anthropometric characteristics of the participants.
| Variables | Non-frail | Pre-frail | Frail | p value |
|---|---|---|---|---|
| Gender | W:8; M:7 | W:9; M:6 | W:9; M:3 | 0.50 |
| Age (years) | 75.6±4.32 | 78.86±6.99 | 76.75±7.94 | 0.38 |
| Weight (kg) | 68.5±11.34 | 73.47±16.91 | 69.32±13.41 | 0.59 |
| High (cm) | 160.6±0.08 | 159.9±0.08 | 154.4±0.08 | 0.14 |
| BMI (kg/m2) | 25.53±3.54 | 28.54±4.98 | 29.34±6.73 | 0.34 |
| Falls occurrence | 13.33% | 33.33% | 58.33% | 0.04 |
| TUG time (s) | 11.14±1.99* | 14.08±5.64* | 21.43±8.33 | <0.01 |
| Sit-to-stand time (s) | 8.03±1.37* | 9.66±2.44 | 9.76±1.67 | 0.02 |
W: woman; M: man; values expressed as mean±standard deviation.
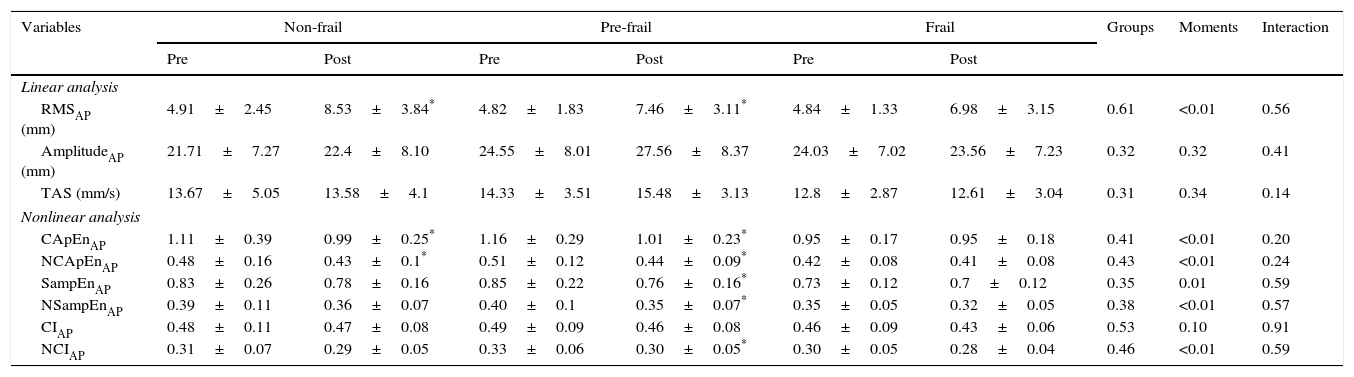
The results for the linear and nonlinear analysis of CoP displacements in the AP direction before and after sitting and rising from the chair are presented in Table 2. For the linear measurements, only the RMS increased after sitting and rising in the non-frail and pre-frail groups. No significant group, time, or group-by-time effects were found for the other linear measurements. Regarding nonlinear measures, the pre-frail participants showed a reduction in all indices, except CI after sitting and rising. The same result was observed in the non-frail group for CApEn and NCApEn.
Linear and nonlinear analysis of the CoP in the anteroposterior direction, before and after sitting and rising from the chair in the non-frail, pre-frail and frail groups.
| Variables | Non-frail | Pre-frail | Frail | Groups | Moments | Interaction | |||
|---|---|---|---|---|---|---|---|---|---|
| Pre | Post | Pre | Post | Pre | Post | ||||
| Linear analysis | |||||||||
| RMSAP (mm) | 4.91±2.45 | 8.53±3.84* | 4.82±1.83 | 7.46±3.11* | 4.84±1.33 | 6.98±3.15 | 0.61 | <0.01 | 0.56 |
| AmplitudeAP (mm) | 21.71±7.27 | 22.4±8.10 | 24.55±8.01 | 27.56±8.37 | 24.03±7.02 | 23.56±7.23 | 0.32 | 0.32 | 0.41 |
| TAS (mm/s) | 13.67±5.05 | 13.58±4.1 | 14.33±3.51 | 15.48±3.13 | 12.8±2.87 | 12.61±3.04 | 0.31 | 0.34 | 0.14 |
| Nonlinear analysis | |||||||||
| CApEnAP | 1.11±0.39 | 0.99±0.25* | 1.16±0.29 | 1.01±0.23* | 0.95±0.17 | 0.95±0.18 | 0.41 | <0.01 | 0.20 |
| NCApEnAP | 0.48±0.16 | 0.43±0.1* | 0.51±0.12 | 0.44±0.09* | 0.42±0.08 | 0.41±0.08 | 0.43 | <0.01 | 0.24 |
| SampEnAP | 0.83±0.26 | 0.78±0.16 | 0.85±0.22 | 0.76±0.16* | 0.73±0.12 | 0.7±0.12 | 0.35 | 0.01 | 0.59 |
| NSampEnAP | 0.39±0.11 | 0.36±0.07 | 0.40±0.1 | 0.35±0.07* | 0.35±0.05 | 0.32±0.05 | 0.38 | <0.01 | 0.57 |
| CIAP | 0.48±0.11 | 0.47±0.08 | 0.49±0.09 | 0.46±0.08 | 0.46±0.09 | 0.43±0.06 | 0.53 | 0.10 | 0.91 |
| NCIAP | 0.31±0.07 | 0.29±0.05 | 0.33±0.06 | 0.30±0.05* | 0.30±0.05 | 0.28±0.04 | 0.46 | <0.01 | 0.59 |
Values expressed as mean±standard deviation;
p<0.05 pre versus post; AP, anteroposterior direction; RMS, root mean square; TAS, total average speed; CApEnAP, corrected approximate entropy in the AP direction; NCApEnAP, normalized CApEnAP; SampEnAP, corrected sample entropy in the AP direction; NSampEnAP, normalized SampEnAP; CIAP, complexity index in the AP direction; NCIAP, normalized CIAP.
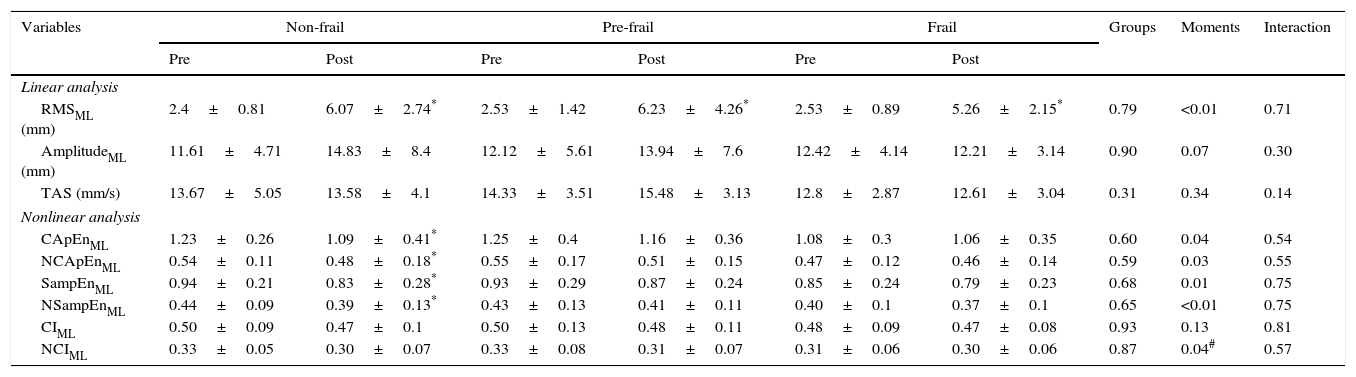
Table 3 shows the results in the ML direction. With regard to linear measurements, all groups showed a higher RMS after sitting and rising. The other linear measurements showed no group, time or group-by-time effects. With regard to nonlinear measurements, only the non-frail group had reduced CApEn, NCApEn, SampEn, and NSampEn after sitting down and rising from the chair.
Linear and nonlinear analysis of the CoP in the mediolateral direction, before and after sitting and rising from the chair in the non-frail, pre-frail and frail groups.
| Variables | Non-frail | Pre-frail | Frail | Groups | Moments | Interaction | |||
|---|---|---|---|---|---|---|---|---|---|
| Pre | Post | Pre | Post | Pre | Post | ||||
| Linear analysis | |||||||||
| RMSML (mm) | 2.4±0.81 | 6.07±2.74* | 2.53±1.42 | 6.23±4.26* | 2.53±0.89 | 5.26±2.15* | 0.79 | <0.01 | 0.71 |
| AmplitudeML (mm) | 11.61±4.71 | 14.83±8.4 | 12.12±5.61 | 13.94±7.6 | 12.42±4.14 | 12.21±3.14 | 0.90 | 0.07 | 0.30 |
| TAS (mm/s) | 13.67±5.05 | 13.58±4.1 | 14.33±3.51 | 15.48±3.13 | 12.8±2.87 | 12.61±3.04 | 0.31 | 0.34 | 0.14 |
| Nonlinear analysis | |||||||||
| CApEnML | 1.23±0.26 | 1.09±0.41* | 1.25±0.4 | 1.16±0.36 | 1.08±0.3 | 1.06±0.35 | 0.60 | 0.04 | 0.54 |
| NCApEnML | 0.54±0.11 | 0.48±0.18* | 0.55±0.17 | 0.51±0.15 | 0.47±0.12 | 0.46±0.14 | 0.59 | 0.03 | 0.55 |
| SampEnML | 0.94±0.21 | 0.83±0.28* | 0.93±0.29 | 0.87±0.24 | 0.85±0.24 | 0.79±0.23 | 0.68 | 0.01 | 0.75 |
| NSampEnML | 0.44±0.09 | 0.39±0.13* | 0.43±0.13 | 0.41±0.11 | 0.40±0.1 | 0.37±0.1 | 0.65 | <0.01 | 0.75 |
| CIML | 0.50±0.09 | 0.47±0.1 | 0.50±0.13 | 0.48±0.11 | 0.48±0.09 | 0.47±0.08 | 0.93 | 0.13 | 0.81 |
| NCIML | 0.33±0.05 | 0.30±0.07 | 0.33±0.08 | 0.31±0.07 | 0.31±0.06 | 0.30±0.06 | 0.87 | 0.04# | 0.57 |
Values expressed as mean±standard deviation.
p<0.05 pre versus post; # multiple comparisons did not identify significant intragroup differences. ML, mediolateral direction; RMS, root mean square; TAS, total average speed; CApEnML, corrected approximate entropy in the ML direction; NCApEnML, normalized CApEnML; SampEnML, corrected sample entropy in the ML direction; NSampEnML, normalized SampEnML; CIML, complexity index in the ML direction; NCIML, normalized CIML.
In this study, the sample was homogeneous with respect to the anthropometric characteristics; however, the frail group had a higher percentage of falls in the last year compared to the other groups. This finding is in agreement with a 7-year follow-up study that showed that the occurrence of falls is higher in frail elderly subjects compared to non-frail subjects (41% versus 27%, respectively).2 The frail elderly subjects also showed a worse performance in the TUG, taking longer than the 15s proposed by Nordi et al.24 for identifying older people at high risk for falls. It is worth noting that the movements of sitting and rising from a chair are present in the TUG and are important components in the evaluation of this test. Ganea et al.25 indicated that the postural transition of sitting and rising is less stable in frail older people due to the greater functional limitation of this group. In this study, the frail group took longer to perform the movement, which was used to assess the ability to adjust CoP displacements.
Given that complex dynamical systems as a response to an increased demand or to stimulus present a simplification of its dynamics,26 it was expected that the movement of sitting and rising would lead to greater CoP displacement, accompanied by simplification and greater regularity of the dynamics of these displacements. This increase in regularity, evidenced by lower entropy values, would be a result of the adjustments and reorganization of the postural control system in order to maintain the new posture.
This behavior was observed in the non-frail and pre-frail groups in the AP direction and only in the non-frail group in the ML direction. These data are consistent with the study of Donker et al.26 who evaluated another type of stimulus to the postural control system (deprivation of visual information in the standing posture) and observed greater and more regular CoP displacements.
Interestingly, after the motion of sitting and rising, the frail group did not present more regular displacements, despite having a greater dispersion of the CoP displacement (RMS) in the AP direction. This result may indicate a difficulty of the postural control system to adjust and reorganize in response to a stimulus. Some studies have correlated the presence of frailty syndrome with reduced ability to maintain homeostasis or difficulty adapting in response to different stimuli.27 Kang et al.9 reported increased regularity in CoP displacements in frail and pre-frail elderly subjects compared to non-frail subjects in the orthostatic position with open eyes. Thus, given that the frail elderly subjects already presented simplified, more regular dynamics when exposed to a new stimulus such as postural change, these dynamics would already be in an extreme situation from which there would be no reserve for adjustment and reorganization. This fact could compromise an adequate response of postural control, leading to a greater predisposition to falls.
With regard to the direction of CoP displacements, studies show that the orthostatic posture is controlled primarily in the sagittal plane.28 Based on our results, pre-frail elderly patients show no change in the regularity of the CoP displacements after sitting and rising in the frontal plane. In contrast, frail subjects do not present change in the regularity of CoP displacements in either of the two planes. Given the cross-sectional design of this study, it is not possible to determine whether the changes in terms of dynamics of CoP displacements begin in the frontal plane and move to the sagittal plane as the syndrome progresses.
One limitation of this study was the high percentage of exclusion of participants, about 30% due to the criteria adopted for this study. Nevertheless, these were required to reduce bias in the results as the presence of plantar sensitivity deficits and vestibulopathy that interfere in postural control.12,29 Future studies should explore whether a falls prevention program can help frail and pre-frail elderly people exhibit the same CoP behavior as non-frail elderly people.
ConclusionsThe results of this study indicate that frail elderly people have extremely simplified and regular CoP dynamics, evidenced by low entropy values, even in the standing position. Thus, the movement of sitting and rising from a chair did not cause further reduction in entropy values. This simplification and regularity of the CoP in the AP and ML directions in the frail group and in the ML direction in the pre-frail group indicate that the integration of the systems involved in postural control is impaired, given that these subjects did not show an expected response to the balance disturbance used in this study.
Conflict of interestThe authors declare no conflicts of interest.
We wish to thank Conselho Nacional de Desenvolvimento Científico e Tecnológico – CNPq (number 479769/2013-3) and Coordenação de Aperfeiçoamento de Pessoal de Nível Superior – CAPES – AUXPE-CSF-PVE (number 23038.007721/2013-4) for funding this study.


