
Smartphone use has been constantly increasing. Smartphone addiction can lead to changes in the emotional state and musculoskeletal system of users. To identify smartphone addicts, the Smartphone Addiction Scale-Short Version was developed; however, this scale has not been translated into Brazilian Portuguese and tested for its measurement properties.
ObjectiveTo translate and cross-culturally adapt the Smartphone Addiction Scale-Short Version into Brazilian Portuguese; to assess the internal consistency, reliability and construct validity of the scale among university students.
MethodsThe cross-cultural adaptation was performed following the guidelines for cross-cultural adaptation of self-report measures, and data were collected via online surveys administered to 59 university students over 18 years of age for test–retest. To test the measurement properties of the final version of the Smartphone Addiction Scale-Short Version, a convenience sample including 130 university students was used.
ResultsThe Smartphone Addiction Scale-Short Version showed good reliability for test–retest scores (ICC3,1=0.82; 95% CI=0.70–0.89) and good internal consistency considering all 10 items (Cronbach's alpha=0.95). The construct validity was calculated comparing the Smartphone Addiction Scale-Short Version score to data from a questionnaire prepared by the authors of this study, including frequency per day (r=0.35; p<0.001), leisure time on the smartphone (r=0.33; p<0.001), and time working on the smartphone (r=0.18; p=0.04) that were significantly positively associated with higher Smartphone Addiction Scale-Short Version scores. The results show a high prevalence of smartphone addiction among university students (33.1%).
ConclusionIt can be concluded that the Brazilian Portuguese version of the Smartphone Addiction Scale-Short Version is a reliable and valid tool for screening smartphone addiction in university students.
In Brazil, the use of smartphones has been constantly increasing. According to a survey conducted by the Brazilian Institute of Geography and Statistics1 in 2015, 92.1% of the population used smartphones and other devices (i.e. computer, tablet, television) to access the Internet and 27% use only the smartphone to access the Internet in their households. The same institute showed that, in 2014, 80.4% used smartphones and other devices,1 confirming the considerable increase in the use of these devices.
Excessive use of smartphones can lead to addictive behaviors,2 and, this behaviors could cause changes in the musculoskeletal system of users.3 Furthermore, Laconi et al.2 observed that Problematic Internet Use (PIU) (technological addictions) is significantly more common in young adults (18–30 years) who are in constant contact with the new technologies. A systematic review4 found an association between musculoskeletal disorders and tasks performed while using mobile devices, such as cervical flexion posture, frequency of phone calls, text messages, and games.4 However, some studies did not find an association between neck posture and neck pain.5
In order to identify smartphone addicts, some authors6,7 developed scales to assess smartphone addiction. Among them, we can highlight the “Smartphone Addiction Scale” (SAS)6,8 and the “Smartphone Addiction Inventory” (SPAI)7 as the most frequently used screening instruments in recent studies. The SPAI has 26 items and has been validated to Brazilian Portuguese.9 However, the SAS has a short version (SAS-SV) with 10 questions8 that is shorter and easier to complete, and therefore more suitable for Brazilian young adults. In addition, the SAS has been widely used in other countries, such as Switzerland,10 Saudi Arabia,11 Spain, and France,12 thus allowing the comparison between the results of the surveys of several countries.13
The SAS is a self-administered scale, and the SAS-SV14 was published in 2013 and showed good reliability and validity for the assessment of smartphone addiction. The short version could be used efficiently for the evaluation of smartphone addiction in community and research areas. The Spanish, French, and German10 adaptations of the SAS-SV12 are available in the literature; however, there is no Brazilian Portuguese version of the SAS-SV.
Thus, the objective of the study was the translation and cross-cultural adaptation of the short version of the scale into Brazilian Portuguese and the assessment of the internal consistency, reliability, and validity of the Brazilian scale among university students.
MethodsThe study was conducted according to the COSMIN guidelines.15,16 The study was conducted in two stages. In the first stage, the scale was translated into Brazilian Portuguese and adapted into the Brazilian culture. In the second stage, it was tested among university studies to assess the reliability, internal consistency, and validity of the Brazilian SAS-SV.
The English version of the SAS-SV8 was the original scale used for translation and adaptation. The original SAS-SV comprises 10 questions with six answer choices, scored according to a Likert scale: strongly disagree=1, disagree=2, somewhat disagree=3, somewhat agree=4, agree=5, and strongly agree=6. The total score ranges from 10 (minimum) to 60 (maximum), with the highest score being a greater chance of being addicted to the smartphone. The original version has good content/concurrent validity and internal consistency.8 The authorization to translate to the Brazilian Portuguese language of SAS-SV was given by Kwon et al.,8 the authors of the original instrument.
The Brazilian SAS-SV was called “Versão curta da Escala de Dependência do Smartphone” (Appendix 1). The university students volunteered to take part in the study after an electronic invitation. Assurances of confidentiality and anonymity were given, and a consent form was signed online by the participants. This study was approved by the local Research Ethics Committee of “Universidade Metodista de Piracicaba”, Piracicaba, São Paulo, Brazil (Protocol no. CAE 65444417.1.0000.5507).
Cross-cultural adaptation processThe process of cross-cultural adaptation followed the guidelines17 for cross-cultural adaptation of self-report measures. A five-stage process is recommended for cross-cultural adaptation: translation, synthesis, back translation, expert committee review, and pre-testing. This process should adapt the concepts to the target population's culture and verify whether the connotative meaning is equivalent to the original scale.
The initial translation into Brazilian Portuguese was performed independently by two bilingual native speakers from Brazil, both language teachers. They were assisted by the researchers if they had any questions about the scale's content. The researchers were physical therapists familiar with the scale's concepts and smartphone addiction theory. They also had considerable experience with assessments using questionnaires. The two translators combined the translations into a consensus version based on the original scale. All decisions were made by consensus among the two translators and researchers. The common translated/adapted version was then back-translated into English by two bilingual native speakers from the United States, both language teachers, who worked independently.
A multi-professional expert committee consisting of five experts – one expert in methodology, one Brazilian language professional, one English language professional, and the two physical therapists who participated in the first stage – reviewed and compared the common translation, the two back translations, and the original scale to produce a pre-final Brazilian Portuguese version of the SAS-SV. The expert committee's decisions were made to achieve semantic, idiomatic, experimental, and conceptual cross-cultural equivalence.
Pre-testing was performed to verify if this version was equivalent to the original scale and if the target group could understand it properly. For the pre-testing, we used a sample of 33 university students who received a link by e-mail or text message to access the scale and all the instructions. All students were enrolled in random courses at a university in the state of São Paulo, Brazil. The students were asked to read the scale, fully explain their answers, and to report any issues. None of the students reported difficulty in understanding or interpreting the questions.
For the test–retest, 106 students enrolled in different courses at a university in the state of São Paulo, Brazil were invited to participate in the study. The students received a link to access the scale and all the instructions by e-mail or text message. Of the 106 students invited to participate in the study, 59 (18 men and 41 women; mean age 24.5; SD=4.2 years) responded to the scale once. Therefore, the questionnaire was sent back to this population after one week. The scale was completed by 53 of the 59 students, and six students did not respond to the scale the second time.
To test the measurement properties of the final Brazilian Portuguese version of the SAS-SV, another convenience sample including 160 students, also enrolled in random courses at a university in São Paulo state, were invited to participate in the study in this phase. Of the 160 students invited to take part, 130 students answered the scale and 30 did not respond. The students received a link to access the scale and all the instructions by e-mail or text message. They responded to the scale and received the score via email and they did not receive any incentives.
The study sample size was estimated, as proposed by Terwee et al.18 and Beaton et al.,17 to be at least 50 subjects for reliability and construct validity and at least 100 subjects for internal consistency.
Evaluation of measurement propertiesThe consistency of a measurement, i.e., reliability, can be defined when the related conditions are constant. Reliability can be estimated through stability and internal consistency and refers to the extent to which the same score is provided on two different occasions for the same conditions, denoting stability.18–20
The subgroup of 53 university students, who answered the scale twice, participated in this test. A one or two week interval between the tests was allowed as recommended by Terwee et al.,18 because it is considered long enough to prevent recall. A minimum of 0.7 is the recommended criterion for a reliable measure.18 Good internal consistency ranges from 0.7 to 0.95.18 Moreover, for validation purposes, correlations between the total SAS-SV score and time indicators (frequency per day in hours, time working on the smartphone, leisure time on the smartphone, and age) were used to examine the construct validity. No other instrument was used for construct validity analysis due to the absence of Brazilian Portuguese questionnaires assessing smartphone addiction during the period of data collection.
MeasuresThe online survey comprised three sections: (a) socio-demographic, (b) mobile phone usage patterns, and (c) the SAS-SV adapted into Brazilian Portuguese. The variables examined in the socio-demographic section included: sex, age, weight, height, civil status (i.e., single, in a partnership/cohabitating/married, separated/divorced, widow(er), other), physical exercise, and pain in wrist and/or neck. Participants were asked about the presence of pain in the wrist and neck, and they could answer “yes” or “no”. In the case of physical activity, those who answered that they exercised three times or more per week were considered active. Otherwise, they were considered sedentary.
The patterns of smartphone use measured were: average minutes per day spent on the smartphone, average minutes per day of smartphone use for activities related to work/study per typical weekday; average minutes per day of smartphone use for online leisure activities per typical week; and time that the participant has owned a smartphone. All patterns of smartphone data were obtained using a questionnaire prepared by the authors of this study. The same participants answered all of the online survey questions about socio-demographic data, mobile phone usage patterns data, and the SAS-SV adapted into Brazilian Portuguese.
Statistical analysisAll statistical analyses were performed using IBM SPSS Statistics 21, and a significance level of 0.05 was adopted throughout. The normality of data distribution was assessed with the Kolmogorov–Smirnov test (p<0.001). The test has a p-value lower than 0.05, which indicates non-normal data distribution.
Intraclass Correlation Coefficient (ICC) (ICC3,1; model: two-way mixed; type: absolute agreement – single measurement) and confidence intervals (CI) of the mean coefficients (95%) were used to verify the reliability of the SAS-SV scale in the test and retest. Internal consistency was assessed using Cronbach's alpha for the 10 items. For this test, the data from a subgroup of 53 university students, who answered the scale twice were used. A minimum of 0.7 is the recommended criterion for a reliable measure.18 Good internal consistency ranges from 0.7 to 0.95.18 The analysis was also conducted excluding one item each time to check the contribution of that item to the homogeneity of the scale.
All data related to the prevalence of smartphone use were analyzed by median, maximum, and minimum. The variables sex, civil status, physical exercise and symptoms in the cervical region and wrist were associated with smartphone addiction using the Chi-Square test. Moreover, for validation purposes, Spearman correlations between the total SAS-SV score and time indicators (frequency per day in hours, time working on the smartphone, leisure time on the smartphone, time that the volunteer has owned a smartphone and age) were used to examine the construct validity. The Spearman correlation values (r) considered were: r=0.10 (small effect); r=0.30 (medium effect); and r=0.50 (large effect).21
According to Nunnally22 the sample sizes (n=130) were sufficient to do the measurement properties, because of the SAS-SV, includes ten items, so at least 100 participants were tested.
ResultsCross-cultural adaptation processDuring the translation process of the scale, few disagreements were found between translators and researchers. The most common problem was adapting the verbal tense of the questions. All differences were resolved by consensus between translators and researchers, and the most appropriate terms were chosen. During the application of the scale in the sample of 33 university students, no issues were reported regarding the understanding and interpretation of the questions.
Measurement propertiesThe SAS-SV showed good reliability for the test–retest scores (ICC3,1=0.82; 95% CI 0.70–0.89) among 53 university students. The SAS-SV also showed good internal consistency considering all 10 items (Cronbach's alpha=0.95). Whenever one item was excluded, alpha values did not reveal changes in scale homogeneity (Table 1).
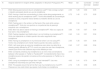
Item analysis and internal consistency in the SAS-SV for Brazilian university students (n=130) (item number; its statement in English and Brazilian Portuguese; mean and standard deviation (SD), corrected item-total correlation, and Cronbach's alpha if item deleted).
| N | Original statement in English (ENG); adaptation in Brazilian Portuguese (PT) | Mean | SD | Corrected item-total r | α if item deleted |
|---|---|---|---|---|---|
| 1 | ENG: Missing planned work due to smartphone usePT: Não consigo cumprir o trabalho planejado devido ao uso do smartphone | 2.35 | 1.29 | 0.66 | 0.95 |
| 2 | ENG: Having a hard time concentrating in class, while doing assignments, or while working due to smartphone usePT: Tenho dificuldades de concentração durante as aulas, enquanto realizo tarefas ou trabalho devido ao uso do smartphone | 2.72 | 1.45 | 0.70 | 0.95 |
| 3 | ENG: Feeling pain in the wrists or at the back of the neck while using a smartphonePT: Sinto dor nos punhos ou na parte de trás do pescoço enquanto uso o smartphone | 2.80 | 1.50 | 0.78 | 0.94 |
| 4 | ENG: Won’t be able to stand not having a smartphonePT: Não sou capaz de ficar sem o meu smartphone | 3.56 | 1.54 | 0.87 | 0.94 |
| 5 | ENG: Feeling impatient and fretful when I am not holding my smartphonePT: Sinto-me impaciente ou irritado quando não estou segurando meu smartphone | 2.42 | 1.24 | 0.91 | 0.94 |
| 6 | ENG: Having my smartphone in my mind even when I am not using itPT: Tenho meu smartphone em mente mesmo quando não estou usando-o | 2.53 | 1.35 | 0.91 | 0.94 |
| 7 | ENG: I will never give up using my smartphone even when my daily life is already greatly affected by itPT: Eu nunca vou parar de usar meu smartphone, mesmo que minha vida cotidiana seja muito afetada por isso | 2.42 | 1.07 | 0.89 | 0.94 |
| 8 | ENG: Constantly checking my smartphone so as not to miss conversations between other people on Twitter or FacebookPT: Constantemente checo meu smartphone para não perder conversas entre outras pessoas no Twitter ou no Facebook | 3.15 | 1.51 | 0.82 | 0.94 |
| 9 | ENG: Using my smartphone longer than I had intendedPT: Uso meu smartphone mais tempo do que tinha intenção | 4.05 | 1.41 | 0.73 | 0.94 |
| 10 | ENG: The people around me tell me that I use my smartphone too muchPT: Pessoas ao meu redor dizem que passo muito tempo no smartphone | 2.72 | 1.35 | 0.59 | 0.95 |
Regarding construct validity, the variables frequency per day, time working on the smartphone, leisure time on the smartphone and time that the participant has owned a smartphone were significantly positively correlated with higher SAS-SV scores (Table 2). The correlation between SAS-SV score and frequency per day and leisure time on the smartphone were classified as medium effect (Table 2). The correlation between SAS-SV score and time working on the smartphone and time that the participant has owned a smartphone were classified as small effect (Table 2). Age was not significantly correlated with the SAS-SV score (Table 2).
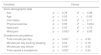
Values for associations between the socio-demographic variables and SAS-SV categories (addicted and not addicted) and values for correlation between patterns of smartphone use and SAS-SV scores (n=130).
| Variables | Values | |
|---|---|---|
| Socio-demographic data | ||
| Sex | p=0.78 | x2=0.08 |
| Age | p=0.50 | r=−0.06 |
| Civil status | p=0.55 | x2=2.11 |
| Physical exercise | p=0.95 | x2=0.004 |
| Neck pain | p=0.03* | x2=4.76 |
| Wrist pain | p=0.003* | x2=8.90 |
| Smartphone use patterns | ||
| Total minutes per day | p<0.001* | r=0.35 |
| Minutes per day working studying | p=0.04 | r=0.18 |
| Minutes per day leisure | p<0.001* | r=0.33 |
| Time owned a smartphone | p=0.007 | r=0.24 |
The variables pain in the neck and pain in the wrist were positively associated with the SAS-SV score (Table 2). Accordingly, the participants classified as not addicted to the smartphone showed a small prevalence of pain. In contrast, the variables sex, civil status, and physical were not significantly associated with the SAS-SV score (Table 2).
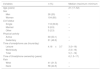
Socio-demographic and descriptive characteristics of mobile phone use patternsThe socio-demographic and descriptive characteristics of smartphone use patterns are shown in Table 3.
Socio-demographic characteristics of sample (n=130).
| Variables | n (%) | Median (maximum–minimum |
|---|---|---|
| Age (years) | 21 (17–52) | |
| Sex | ||
| Men | 26 (20) | – |
| Woman | 104 (80) | – |
| Civil status | ||
| Single | 118 (90.8) | – |
| Married | 9 (6.9) | – |
| Other | 3 (2.3) | – |
| Physical activity | ||
| Active | 69 (53.1) | – |
| Sedentary | 61 (46.9) | – |
| Time of smartphone use (hours/day) | ||
| Leisure | 4.18±3.7 | 3 (0–19) |
| Work/study | 2 (0–16) | |
| Total | 5 (1–19) | |
| Time of Smartphone ownership (years) | 6 (1.5–17) | |
| Pain | ||
| Wrist | 41 (31.5) | – |
| Neck | 58 (44.6) | – |
Table 3 shows that the population evaluated consisted mostly of young individuals with median age of 21 years. The median time spent daily on the smartphone was 5h, and the largest amount of time reported was 19h per day. In addition, the present study found high rates of wrist pain (31.4%) and neck pain (44.6%).
Estimation of the prevalence of “smartphone addiction”Based on Kwon et al.,8 we adopted a cut-off point of 31 for boys and 33 for girls to classify smartphone addicts. The present study classifies participants as “not addicted” or “addicted” according to Kwon et al.,8 and the results show that 87 (66.9%) of the population were classified as not addicted and 43 (33.1%) of the population were classified as addicted. The median, maximum, and minimum SAS-SV scores obtained in the group classified as not addicted were 25 (32-10) and for the group classified as addicted were 39 (50-32).
DiscussionConsidering the results, it is possible to affirm that no uncertainties were reported regarding the volunteers understanding and interpreting the scale. The results related test–retest evaluation demonstrated good reliability of the responses. Regarding construct validity, all the variables related to time indicators were significantly and positively correlated with higher SAS-SV scores, however the magnitude of the correlation was considered moderate. Age was not significantly correlated with the SAS-SV score. The variables related to pain in the neck and pain in the wrist had a positive association with the SAS-SV score. The variables sex, marital status, and exercise were not significantly associated with the SAS-SV score. The population consisted mostly of young individuals who spent a significant amount of time on the smartphone. In addition, the present study found high rates of wrist pain and neck pain and found high rates of prevalence of university students addicted to the smartphone use (33.1%).
No uncertainties were reported regarding the comprehension of the scale. Consequently, there was no need for revision of the questions.23 Furthermore, the results related to test–retest evaluation demonstrated good reliability of the responses. In light of these results, it can be said that the scale has easy applicability and can be completed remotely by university students without the need for face-to-face application.
The SAS-SV showed high reliability values in item-by-item retrieval since Cronbach's alpha values remained high for all questions. These findings agree with studies on the validation of the scale in other languages.12 In addition, the scale presented good internal consistency, which confirms the homogeneity of the scale, that is, all the questions are important for the construct. This result confirms the findings of Lopez-Fernandez12 for Spanish (α=0.88) and French (α=0.90) and those of Haug et al.10 for German.
Construct validity was carried out through correlation with time indicators. However, the magnitude of the correlation was considered as medium. Lopez-Fernandez and Lin et al.,7 performed the same analysis and found similar correlation values. In addition, there was an association between the SAS-SV score and pain in the wrist and cervical regions. Several studies3,4,24–26 have found a relationship between neck pain and the use of mobile devices due to the static cervical flexion posture adopted during the use of the device.
The participants evaluated in the present study were mostly young individuals who spend a median of five hours a day on the smartphone. That figure represents almost 21% of the day spent using the device, an alarming rate for this young population. Regarding the rating of the scale, we found a high prevalence of smartphone addiction (33.1%). The SAS-SV was also used in another countries such as Saudi Arabia, where the rate of smartphone addiction among students was 71.9%,11 Switzerland (16.9%),10 and Malaysia (46.9%).13 Lopez-Fernandez used the SAS-SV with a different classification (excessive, moderate, and non-excessive smartphone use) and found that the prevalence of potential excessive smartphone use was 12.5% in Spanish students and 21.5% in Belgian students.12 Therefore, it is possible to see an ever-increasing trend in the young population concerning smartphone use.
A limitation of the study is the fact that only university students were evaluated. Future studies should be conducted with the SAS-SV in the Brazilian population to characterize it regarding the level of addiction to smartphones and to provide specific information to professionals in the area and in overall community. Another limitation is that, in the translation process, one translator should be a lay person and the other a specialist.17 In this study, both translators were lay persons, however research staff were available to help and consult with physical therapists familiar with the concepts of the scale and with smartphone addiction theory.
ConclusionThe present study provides insights into smartphone use and smartphone addiction in university students from Brazil. Therefore, it can be concluded that the Brazilian Portuguese version of the SAS-SV is a reliable and valid tool for the screening of smartphone addiction in Brazilian university students.
Conflicts of interestThe author declares no conflicts of interest.
The authors would like to thank people involved in the translation process. This work was funded by grants from Comissão de Aperfeiçoamento de Pessoal de Nível Superior (CAPES), Brasília, DF, Brazil.
The following are the supplementary data to this article:


