

Statistical analysis plans describe the planned data management and analysis for clinical trials. This supports transparent reporting and interpretation of clinical trial results. This paper reports the statistical analysis plan for the RESOLVE clinical trial. The RESOLVE trial assigned participants with chronic low back pain to graded sensory-motor precision training or sham-control.
ResultsWe report the planned data management and analysis for the primary and secondary outcomes. The primary outcome is pain intensity at 18-weeks post randomization. We will use mixed-effects models to analyze the primary and secondary outcomes by intention-to-treat. We will report adverse effects in full. We also describe analyses if there is non-adherence to the interventions, data management procedures, and our planned reporting of results.
ConclusionThis statistical analysis plan will minimize the potential for bias in the analysis and reporting of results from the RESOLVE trial.
Trial registrationACTRN12615000610538 (https://www.anzctr.org.au/Trial/Registration/TrialReview.aspx?id=368619).
Low back pain is a burdensome and disabling health condition.1,2 People who experience low back pain for longer than three months have a low chance of recovery and experience substantial functional and financial difficulty.3–10 Results of clinical trials of contemporary interventions indicate that, on average, people with persistent low back pain experience small to no benefit, compared to control. Accordingly, there is an urgent need to develop more effective interventions.
Recent progress in understanding the role of the central nervous system (CNS) in the low back pain experience bears promise for the development of new treatment approaches. Accumulating data indicate that people with persistent low back pain have differences in CNS structure, function, and biochemistry; compared to people without pain.11–20 Research has demonstrated that these differences may be related to aspects of the low back pain experience.21–23
Interventions designed to target the CNS (termed herein, psychophysical interventions) have been developed and tested in a number of small studies.24–27 Further research has combined these new interventions with traditional interventions directed towards functioning of the back, or psychological aspects of the pain experience. These data suggest that there may be additional benefit from a combined approach.28–32 Work is underway to evaluate these treatment programmes in adequately powered, prospectively registered, randomized controlled trials.33–35
The aim of the RESOLVE Trial is to evaluate the effectiveness of a psychophysical-traditional intervention (graded sensory-motor precision training) compared to a sham intervention for reducing pain intensity for people with persistent low back pain at 18-weeks post-randomization. This statistical analysis plan reports the planned analyses of primary and secondary outcomes.
MethodsTrial designThe RESOLVE Trial is a two-group, parallel, randomized clinical trial with 1:1 allocation. Participants and outcome assessors are blinded to group allocation and study hypotheses.33 Ethical approval was granted by the University of New South Wales Human Research Ethics Committee (HC15357). This statistical analysis plan follows the recommendations of the Guidelines for the Content of Statistical Analysis Plans in Clinical Trials.36
EligibilityThe eligibility criteria are described briefly here and comprehensively in the protocol.33 We included people with pain (intensity rated at least 3/10) between the 12th rib and buttock crease, with or without leg pain, that had persisted for at least 12 weeks. Participants must have been aged 18–70, fluent in English, able to access the internet, and have a trusted person to assist with the intervention at home. We excluded people with known or suspected serious spinal pathology, nerve root compromise, or contraindications to physical activity, transcranial direct current stimulation, cranial electrical stimulation, low-intensity laser therapy or short-wave diathermy. We excluded people who were pregnant or had given birth less than 6 months previously, undergone spinal surgery less than 12 months previously, scheduled major surgery during the next 12 months, or self-identified [an] uncontrolled mental health condition(s) that they felt may impact participation.
InterventionsThe interventions are described briefly here and comprehensively in the protocol.33 Graded sensory-motor precision training comprised pain neuroscience education (2 sessions) followed by contiguous sensory precision training and graded movement imagery (3 sessions) and concluded with graded precision-focused and feedback-enriched, functional movement (7 sessions). There were twelve 60-minute clinical sessions, scheduled approximately weekly, over a period of 12–18 weeks; and, daily 30-minute sessions at home, concluding at session 12. The sham intervention was matched for time and clinician interaction and comprised passive discussion of the participant's back pain experience followed by sham transcranial direct current stimulation, sham cranial electrical stimulation (at home only), de-tuned low-intensity laser therapy, and de-tuned short-wave diathermy.
RandomizationA scientist with no involvement in the conduct of the trial used a blocked randomization model to generate the allocation sequence. The allocations were printed and placed in 276 sealed, opaque, sequentially numbered envelopes.33
Outcome assessments and withdrawalOutcomes were measured at baseline and 18, 26, and 52-weeks post-randomization. Intervention credibility was measured at baseline and 2-weeks post-randomization. We did not specify interim analyses in the trial protocol.33
We determined during the trial that we had sufficient funding to complete recruitment and collect the primary endpoint at 18-weeks for all participants, after which we would close the trial. We collected the primary endpoint for participant ID276 on 28th November 2019 and initiated the final collection of outcome data for all remaining participants that had not completed follow-up (defined as receipt of outcome data for the 52-week time point). We contacted n=45 participants to provide their 52-week time point data early and n=34 participants to provide their 26-week time point data early. This latter group of participants did not provide outcome data for the 52-week time point.
We will use an adapted CONSORT flow diagram37 and accompanying table to describe the movement of participants through the study. A shell of the adapted flow diagram is shown in Fig. 1. Participants may withdraw from the trial intervention, fail to provide follow up data, or both. Additionally, participants may withdraw their consent from the trial completely. We will report these items in the flow diagram and a separate table (Supplemental Material Table A1).
Sample size.")
The required sample size is n=276 participants to have at least 80% power to detect a minimal clinically important difference38 of 1-point (SD 2.0) in pain intensity (0–10 numeric rating scale, NRS), between levels of intervention, at 18-weeks post-randomization. We calculated the sample size for an interaction between time (four observations) and levels of intervention, using an estimated inter-observation correlation of base 0.6 with decay rate 0.1 and adjusted for up to 15% loss to follow up.33,39
Data integrity and missing dataWe collected data from participants ID001-070 in hard copy format. These data will be entered in duplicate. Discrepancies will be resolved by consensus, with recourse to the Chief Investigator as required. We collected data from participants ID071-276 using a custom-developed on-line system. These data do not require entry. We will inspect the range, central tendency, and variance of all variables. We will note implausible values and make appropriate replacements in the cleaned dataset.
We have monitored the proportion of missing data during the trial. We assume that missing observations do so at random. The mixed-effects models that we will use for the analysis of primary and secondary outcomes are robust to data missing at random.
Analytic principlesGeneral considerationsWe will conduct the analyses respecting these principles:
- •
all participants will be analyzed in the group to which they were allocated (intention-to-treat40)
- •
all treatment effect estimates will be provided along with their associated 95% confidence intervals
- •
all statistical tests will be 2-sided with a nominal alpha level of 0.05
- •
p Values will not be adjusted for multiplicity. However, the outcomes are clearly categorized by degree of importance33 and no subgroup analysis will be performed.
- •
the null hypothesis for each outcome is that there is no difference between the intervention groups. Whereas, the alternative hypothesis is that graded sensory-motor precision training is superior to the control intervention.
- •
The primary outcome is pain intensity, defined as average pain intensity in the past week, assessed using a subject-rated 11-point NRS at 18-weeks post-randomization.33 The NRS is a continuous measure that ranges from 0 (no pain) to 10 (worst pain imaginable).45
Secondary outcomesThe secondary outcomes are function, quality of life (QoL), recovery, adverse effects, serious adverse effects, global perceived effect (GPE), and intervention credibility. Measurement properties are described in the protocol.33 Function is assessed using the Roland-Morris Disability Questionnaire (RMDQ).46 QoL is assessed using the EQ-5D-5L.47,48 Recovery is defined as recovery from back pain at 26-weeks post-randomization. We will consider a participant recovered at 26-weeks when the outcome score for pain intensity (in the past week) is either 0 or 1 on the 11-point NRS at both 18- and 26-weeks.49–51 We are collecting data on adverse effects using passive capture,44 throughout the trial period (0–52wks for each participant).33 We will report adverse effects using the United States Food and Drug Administration (FDA) definitions,52 wherein ‘any untoward medical occurrence associated with the intervention, whether or not considered related to the intervention’(edited) constitutes an adverse effect and a serious adverse effect is considered to have occurred when any of the following sequelae occur or medical intervention is required to prevent occurrence: ‘death, threat to life, in-patient hospitalization or prolongation of existing hospitalization, a persistent or significant incapacity or substantial disruption of the ability to conduct normal life functions’. The GPE of intervention is assessed using the Global Back Recovery Scale (GBRS).53 Intervention credibility is assessed using the Credibility and Expectancy Questionnaire (CEQ).54
Compliance with the interventionCompliance was assessed by recording the attendance of participants at each treatment session. We will consider compliance as a continuous variable, defined as the number of treatment sessions attended, and as a binary variable, defined as attendance of greater than or equal to eight treatment sessions (75% of the intervention). We will present frequency distributions for both groups to describe the proportion of participants that attended each intervention session. We will also present the proportion of participants in either group that attended greater than or equal to eight treatment sessions.
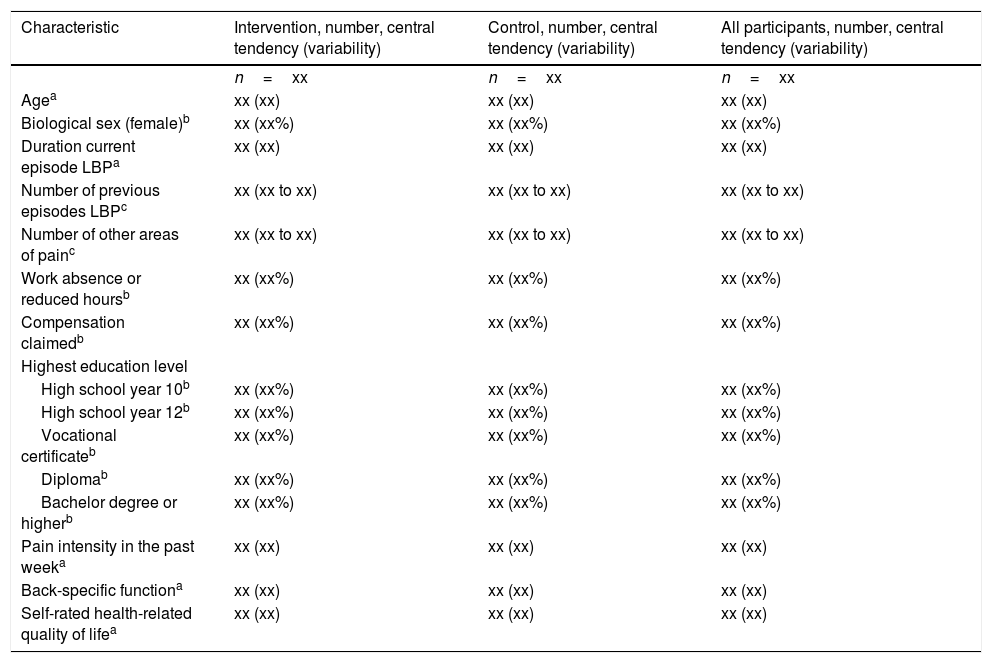
AnalysisBaseline descriptionWe will use the data items depicted in Table 1 to describe the sample and each group at baseline. We will use the frequency and percentage of observations to summarize binary variables, the mean and standard deviation to summarize normally distributed continuous variables and the median and inter-quartile range otherwise.
Baseline characteristics (shell).
| Characteristic | Intervention, number, central tendency (variability) | Control, number, central tendency (variability) | All participants, number, central tendency (variability) |
|---|---|---|---|
| n=xx | n=xx | n=xx | |
| Agea | xx (xx) | xx (xx) | xx (xx) |
| Biological sex (female)b | xx (xx%) | xx (xx%) | xx (xx%) |
| Duration current episode LBPa | xx (xx) | xx (xx) | xx (xx) |
| Number of previous episodes LBPc | xx (xx to xx) | xx (xx to xx) | xx (xx to xx) |
| Number of other areas of painc | xx (xx to xx) | xx (xx to xx) | xx (xx to xx) |
| Work absence or reduced hoursb | xx (xx%) | xx (xx%) | xx (xx%) |
| Compensation claimedb | xx (xx%) | xx (xx%) | xx (xx%) |
| Highest education level | |||
| High school year 10b | xx (xx%) | xx (xx%) | xx (xx%) |
| High school year 12b | xx (xx%) | xx (xx%) | xx (xx%) |
| Vocational certificateb | xx (xx%) | xx (xx%) | xx (xx%) |
| Diplomab | xx (xx%) | xx (xx%) | xx (xx%) |
| Bachelor degree or higherb | xx (xx%) | xx (xx%) | xx (xx%) |
| Pain intensity in the past weeka | xx (xx) | xx (xx) | xx (xx) |
| Back-specific functiona | xx (xx) | xx (xx) | xx (xx) |
| Self-rated health-related quality of lifea | xx (xx) | xx (xx) | xx (xx) |
We will use a mixed-effects model to estimate the effect of allocation to intervention group on the primary outcome; pain intensity at 18-weeks post randomization. Mixed-effect models are recommended for estimating treatment effects at specific time-points in clinical trials.55–57 We will model intervention group as a binary variable and time as a categorical variable with 4 levels corresponding to the repeated measures. We will use an unconstrained correlation structure as this is most plausible, given the repeated measurements are at different time intervals. The model will include three fixed-effect terms for the group.time interactions and a random intercept. The intercept term will account for the dependency of observations within participants due to repeated measures. The model is
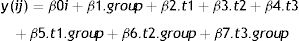
where:
- •
y(ij) is the outcome for the i’th participant at the j’th time point,
- •
β0i is the intercept for the i’th participant, modelled as a random effect, ∼N(β′0i, var(β0))
- •
t1,t2,t3 are indicator variables for the three post-randomization time-points. Baseline is the reference time.
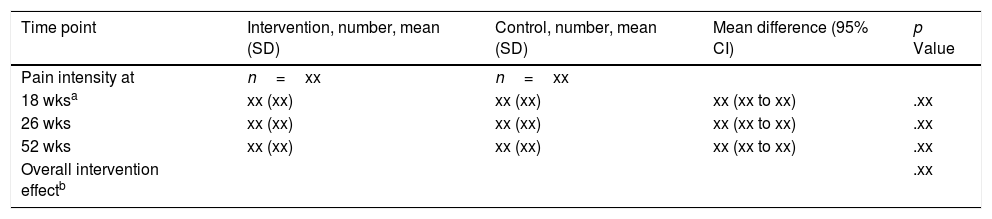
The primary analysis will use the point estimate of β5 and its 95% confidence interval to estimate the effect of intervention at 18-weeks post-randomization (Table 2).
Analysis of primary outcome (shell).
| Time point | Intervention, number, mean (SD) | Control, number, mean (SD) | Mean difference (95% CI) | p Value |
|---|---|---|---|---|
| Pain intensity at | n=xx | n=xx | ||
| 18 wksa | xx (xx) | xx (xx) | xx (xx to xx) | .xx |
| 26 wks | xx (xx) | xx (xx) | xx (xx to xx) | .xx |
| 52 wks | xx (xx) | xx (xx) | xx (xx to xx) | .xx |
| Overall intervention effectb | .xx |
a, b: p values are from a mixed effects model comparing between group differences at 18-weeks post-randomization (a: primary outcome) and over the entire 52-week trial (b).
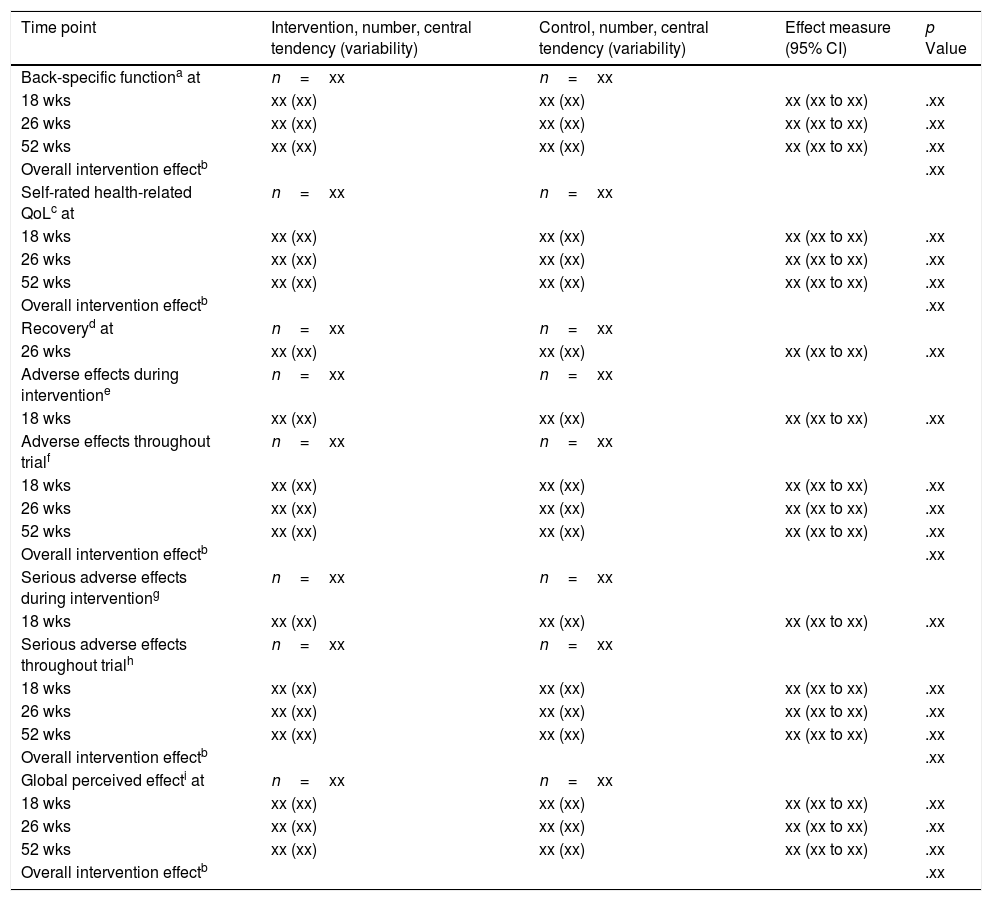
We will also use mixed-effects models to estimate the effect of allocation to intervention group on function, QoL, adverse effects, serious adverse effects and GPE. These models will be specified similarly to the primary outcome. We will use appropriate coefficients and their 95% confidence intervals to estimate the effects of intervention at 18, 26, and 52-weeks post-randomization (Table 3).
Analysis of secondary outcomes (shell).
| Time point | Intervention, number, central tendency (variability) | Control, number, central tendency (variability) | Effect measure (95% CI) | p Value |
|---|---|---|---|---|
| Back-specific functiona at | n=xx | n=xx | ||
| 18 wks | xx (xx) | xx (xx) | xx (xx to xx) | .xx |
| 26 wks | xx (xx) | xx (xx) | xx (xx to xx) | .xx |
| 52 wks | xx (xx) | xx (xx) | xx (xx to xx) | .xx |
| Overall intervention effectb | .xx | |||
| Self-rated health-related QoLc at | n=xx | n=xx | ||
| 18 wks | xx (xx) | xx (xx) | xx (xx to xx) | .xx |
| 26 wks | xx (xx) | xx (xx) | xx (xx to xx) | .xx |
| 52 wks | xx (xx) | xx (xx) | xx (xx to xx) | .xx |
| Overall intervention effectb | .xx | |||
| Recoveryd at | n=xx | n=xx | ||
| 26 wks | xx (xx) | xx (xx) | xx (xx to xx) | .xx |
| Adverse effects during interventione | n=xx | n=xx | ||
| 18 wks | xx (xx) | xx (xx) | xx (xx to xx) | .xx |
| Adverse effects throughout trialf | n=xx | n=xx | ||
| 18 wks | xx (xx) | xx (xx) | xx (xx to xx) | .xx |
| 26 wks | xx (xx) | xx (xx) | xx (xx to xx) | .xx |
| 52 wks | xx (xx) | xx (xx) | xx (xx to xx) | .xx |
| Overall intervention effectb | .xx | |||
| Serious adverse effects during interventiong | n=xx | n=xx | ||
| 18 wks | xx (xx) | xx (xx) | xx (xx to xx) | .xx |
| Serious adverse effects throughout trialh | n=xx | n=xx | ||
| 18 wks | xx (xx) | xx (xx) | xx (xx to xx) | .xx |
| 26 wks | xx (xx) | xx (xx) | xx (xx to xx) | .xx |
| 52 wks | xx (xx) | xx (xx) | xx (xx to xx) | .xx |
| Overall intervention effectb | .xx | |||
| Global perceived effecti at | n=xx | n=xx | ||
| 18 wks | xx (xx) | xx (xx) | xx (xx to xx) | .xx |
| 26 wks | xx (xx) | xx (xx) | xx (xx to xx) | .xx |
| 52 wks | xx (xx) | xx (xx) | xx (xx to xx) | .xx |
| Overall intervention effectb | .xx |
We will calculate the proportion of participants in each group that meet the definition of recovery and compare these proportions using a Chi2 Test, or Fisher's Exact test where appropriate (Table 3). We will display lists of all adverse effects and serious adverse effects reported throughout the trial period (0-52wks: available data for each participant) and the proportion of participants in either group that experienced them (Supplemental Material Table A2). We will calculate the proportion of participants that experienced any adverse effect or any serious adverse effect and compare these proportions using a Chi2 Test, or Fisher's Exact test where appropriate (Table 3). We will compare the mean group scores for the CEQ at baseline and at 2-wks post-randomization using an independent samples t-test.
Estimating treatment effect with incomplete adherenceIf there is significant non-adherence with the allocated interventions we will estimate the complier-average causal effect (CACE) using instrumental variable estimation.58–60 We will also estimate the average treatment effect in the treated (ATET) using propensity score weighting.61,62
Conflicts of interestMKB is supported by a NeuRA PhD Candidature Scholarship and was supported during this work by an Australian Research Training Programme Scholarship and a UNSW Research Excellence Award. MKB received conference travel support from the Chiropractor's Association of Australia to speak about pain neuroscience and rehabilitation and Memorial University of Newfoundland to speak about engagement with research evidence. AGC is supported by the UNSW Prince of Wales Clinical School Postgraduate Research Scholarship. EOH is supported by an Australian Research Training Programme Scholarship. RR is supported by the UNSW School of Medical Sciences Postgraduate Research Scholarship. MKB, AGC, RR, EOH are additionally supported by NeuRA PhD Candidature Supplementary Scholarships. RDH, HL, GLM, TRS and CGM are supported by research fellowships funded by the NHMRC of Australia. GLM has received support from: ConnectHealth UK, Seqirus, Kaiser Permanente, Workers’ Compensation Boards in Australia, Europe and North America, AIA Australia, the International Olympic Committee, Port Adelaide Football Club, Arsenal Football Club. Professional and scientific bodies have reimbursed GLM for travel costs related to presentation of research on pain at scientific conferences/symposia. GLM has received speaker fees for lectures on pain and rehabilitation. GLM receives book royalties from NOIgroup publications, Dancing Giraffe Press & OPTP. TRS has received grant funding from the NHMRC of Australia. TRS also received funding from Eli Lilly Ltd to cover travel expenses; unrelated to the present topic area. CGM has received grant funding from Australian and overseas government and not for profit agencies. CGM is an investigator on the SHaPED trial that received heat wraps at no cost from Flexeze. JMcA has received project grant funding from the NHMRC of Australia. SL, MH, BMW, NOC, SG and SS have nil declarations of interest.
This work was funded by the National Health and Medical Research Council (NHMRC) of Australia, ID1087045
The following are supplementary data to this article:


