
Neck pain is a musculoskeletal condition with high prevalence that may affect the physical, social, and psychological aspects of the individual, contributing to the increase in costs in society and business.
ObjectiveTo determine the prevalence of neck pain and associated factors in a population-based sample of adults aged 20 and more.
MethodsCross-sectional study based on a population survey. A total number of 600 individuals were interviewed in their homes, and the following data were collected: (1) participant characteristics (demographic, socioeconomic, and work-related aspects) using a pre-coded questionnaire; (2) physical activity level using the IPAQ; and (3) musculoskeletal symptoms using the Nordic questionnaire. Descriptive, bivariate, and Poisson regression analyses were performed.
ResultsThe prevalence of neck pain was 20.3% (95% CI 17.3–23.7). The adjusted analyses showed that individuals who were widowers or separated (PR=2.26; 1.42–5.88), had a low income (PR=1.32; 1.22–6.27) or low educational level (PR=1.83; 1.02–5.26), worked while sitting and leaning (PR=1.55; 1.08–2.40), and who reported having two or more diseases (PR=1.71; 1.55–6.31) remained associated with neck pain.
ConclusionThis study reveals the high prevalence of neck pain and remarkable association with widowed/separated people who have low income and low educational level, who perform their occupational activities in sitting and leaning positions, and who reported having two or more diseases. Knowledge of these risk factors will contribute to the development of forms of assistance in which neck pain can be prevented and better managed.
Neck pain is one of the major musculoskeletal disorders in the adult population1; its prevalence in the world ranges from 16.7% to 75.1%.2 This condition has a complex etiology, including a number of factors: ergonomic (strenuous physical activity, use of force and vibration, inadequate posture, repetitive movement), individual (age, body mass index, genome, musculoskeletal pain history), behavioral (smoking and level of physical activity), and psychosocial (job satisfaction, stress level, anxiety, and depression).3,4
Some studies show the relationship between neck pain and associated factors. In China, it was observed that individuals who reported neck pain5 were the ones who performed manual activities above shoulder level, utilized vibrating tools, and remained in the sitting or standing position with bent necks. In the United States,6 neck pain was associated with women, married and separated people who suffered from some morbidity (respiratory, cardiovascular, and gastrointestinal diseases, among others) and psychological alterations (depression, difficulty falling asleep, and insomnia), whereas high educational level6 and regular physical activities were considered protective factors.7
Neck pain is a major cause of morbidity and disability in everyday life and at work in many countries. It can have an impact on the individual's physical, social, and psychological well-being, contributing to increasing costs to society and businesses. In addition, with the increasing aging population of medium- and low-income countries, the prevalence of neck pain will grow significantly in the coming decades,8 requiring knowledge of the risk factors and forms of preventive and/or curative interventions (for example, global postural re-education, segmental stretching,9 dry needling, and percutaneous electrical nerve stimulation,10 among others). It is also important to highlight that, in Brazil, population-based studies regarding pain have been frequently related to lumbar or general pain,11 while neck pain needs further research.
The present study aimed to verify the prevalence of neck pain in a population-based sample of adults aged 20 and older and to analyze the associations of neck pain with the demographic, socioeconomic and ergonomic aspects that are related to the aforementioned lifestyle and morbidity.
MethodsThis cross-sectional design study was conducted in the urban area of Bauru, a city located in the central western region of the State of São Paulo (Brazil) has a population of approximately 337,094 inhabitants – of which 207,021 are aged over 20. The project was approved by the Human Research Ethics Committee of Universidade do Sagrado Coração, Bauru, SP, Brazil (approval no. 957481). The participants signed a consent form, as recommended by Resolution 196 of the National Health Council.
The age and gender groups (called sample domains) were firstly defined with a minimum number of individuals per sample, in order to allow further analysis. Six sample domains were determined: 20–35-year-old men; 20–35-year-old women; 36–59-year-old men; 36–59-year-old women; 60-year-old and older men; and 60-year-old and older women.
The sample size calculation was based on the following premises: an estimated proportion of 50% of the population subgroups, since this is the maximum variability that leads to obtaining conservative sample sizes; a 95% confidence level in the estimation of confidence intervals; a 10% sampling error, indicating that the amplitude between the estimated sample and the population parameter should not exceed this value; and a design effect (deff) equal to 2. Therefore, the sample size for each group was at least 200 individuals (100 male and 100 female), totaling 600 participants.
Sampling was drawn from a two-stage cluster. The primary sampling units (PSUs) were the census tracts, and the secondary sampling units were the residences. The PSUs were drawn by systematic sampling with a probability proportional to their sizes.12 The sampling units were obtained from the National Survey of Household Samples from 2011,13 which produced an address list of private homes for each census tract. A total of 50 urban census tracts were drawn from the 476 identified ones.
The number of households to be drawn from each sampling domain12 was determined, and the ratio between the average number of individuals and the number of households was then calculated. Therefore, it was decided that around 12 households should be visited for every census tract. These households were systematically drawn and all individuals residing in them were considered eligible for the interviews. A new household was randomly selected in case of refusal.
The individuals who were not located after four visits (of which at least one at night and one on the weekend), including those who were traveling, were considered as loss. The individuals who refused to answer the questionnaire by personal choice were considered as refusals.
Individuals who were living in institutions such as nursing homes and prisons and those who were unable to answer the questionnaire were excluded from the study. The elderly underwent the Mini-Mental State Examination at the beginning of the interview, so their cognitive state, as well as the reliability of their answers, could be assessed. Participants who scored less than 27 points14 are considered to have cognitive loss and, therefore, were excluded.
Interviews were conducted by 10 senior physical therapy students. All have undergone theoretical and practical training, which included home approach, interviewing techniques, and issues related to the research tool. A pilot study was performed as part of the training, and the fieldwork was supervised by the researchers involved in the study.
Data was collected from February to June 2012. After the interviews, the questionnaires were coded by the interviewers and revised by the researcher in charge. The supervisors also conducted quality control, which consisted of administering reduced questionnaires to 10% of the respondents.
The variable “neck pain” was observed using the Nordic questionnaire, which was validated and adapted to the Brazilian culture.15 Neck pain was defined as pain, ache, or discomfort in the area between the occiput and the third thoracic vertebra and between the medial borders of the scapulae.16 In the interview, individuals were asked the following question: “Did you have any pain or discomfort in the neck in the past year?” In addition to the verbal questionnaire, an image of the spinal regions in different colors was also presented, so the interviewees could better specify the neck region that was painful.15
The demographic characteristics (age, gender, and race) and socioeconomic characteristics (income and marital status) were evaluated through a pre-coded questionnaire with closed questions. Gender was categorized as female and male; age was categorized into three age groups; marital status was categorized into single, married, and widowed/separated; and education was defined in years (0–4 years, 5–8, 9–11, and 12 or more). Race (white, black, mulatto) was noted by the interviewers and income was based on the minimum wage (MW) (low: up to 3 times the MW; middle: from 4 to 9 times the MW; and high: 10 or more times the MW).17
The questions regarding the sedentary activities (time on TV and on the computer and/or playing video games) were “Do you watch TV in a normal week?” (yes; no); “How many times do you watch TV in a normal week?” (up to two times; three to four times; five times or more in the week); “How many hours do you watch TV on a normal day?” (up to 2h; over 3h per day); “How often do you use the computer or play video games in a normal week?” (up to two times; three to four times; five times or more per week); “For how many hours do you use a computer or play video games on a normal day?” (up to 2h; over 3h per day).18
The ergonomic variables were characterized by the perception of the interviewees, who identified one of four options (never, rarely, usually, or always) that best characterized the frequency of exposure they had at work or at the time of the interview. The measured variables included physical stress, vibration, repeatability, and bad posture, characterized by how often the interviewee worked in the sitting or standing positions. In order to define the association between neck pain and ergonomic variables, the frequencies obtained in the categories “never” and “rarely” were added and categorized into a single group; the same was done to the categories “generally” and “always”.17
The individuals who reported smoking daily (at least one cigarette per day) or occasionally (less than one cigarette per day) were considered smokers. The individuals who had stopped smoking at least 6 months before the interview were considered former smokers.19
Data on morbidity were collected during the interview, in which the subjects answered the question: “among the alternatives below (hypertension; osteoporosis; diabetes; osteoarthritis; skin, respiratory, gastrointestinal, pancreatic, or liver diseases; genital and urinary system diseases), choose the one/ones that matches/match the diagnosis you received from a doctor in the last 12 months.20
The International Physical Activity Questionnaire (IPAQ)21 has been validated for the Brazilian population and was utilized to check the physical activity level of the subjects. A threshold of 150min of physical activity per week was established to classify the individuals as active (150min per week or more) or insufficiently active (below 150min per week).22
The obtained data was then inserted into a database and the analyses were stratified by gender, using the SPSS version 10.0 (SPSS Inc., Chicago, IL, USA). Absolute and relative frequency distributions were performed for categorical variables, as well as the calculation of prevalence ratios (PR) with 95% confidence interval (CI).
Poisson regression was utilized to analyze the variables associated with neck pain, respecting a hierarchical model of relationships among the variables. This technique is justified since the outcome could present high prevalence (20% or more), which would result in an overestimated effect size and odds ratio (OR) obtained using logistic regression analysis. The PR were calculated, as well as their respective 95% confidence intervals (CI).
ResultsA total of 641 eligible individuals were found in the selected households, but only 600 were interviewed. The main reasons for loss (n=41) were “absent residents” and “scheduled with the interviewer but did not show up”. The refusals were “unresponsive in the interview” and “the interview is too long/it takes too much time to answer”.
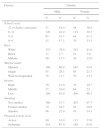
Table 1 shows the sociodemographic characteristics, the levels of physical activity, and smoking habits of the sample of individuals older than 20 years, living in the city of Bauru in the central western region of São Paulo state (Brazil). It can be observed that the highest percentage of individuals of both genders had between 9 and 11 years of schooling, were white, married, non-smokers, and had low income and sedentary habits.
Distribution of frequencies of sociodemographic characteristics, level of physical activity, and smoking habits of the sample of individuals aged over 20 living in the city of Bauru, according to gender.
| Factors | Gender | |||
|---|---|---|---|---|
| Male | Female | |||
| N | % | N | % | |
| School years | ||||
| 12 or higher education | 57 | 19.0 | 48 | 16.0 |
| 9–11 | 126 | 42.0 | 118 | 39.3 |
| 5–8 | 65 | 21.7 | 64 | 21.3 |
| 0–4 | 52 | 17.3 | 70 | 23.3 |
| Race | ||||
| White | 237 | 79.0 | 243 | 81.0 |
| Black | 17 | 5.7 | 21 | 7.0 |
| Mulatto | 46 | 15.3 | 36 | 12.0 |
| Marital status | ||||
| Married | 180 | 60.0 | 165 | 55.0 |
| Single | 85 | 28.3 | 65 | 21.7 |
| Widower/separated | 35 | 11.7 | 70 | 23.3 |
| Income | ||||
| High | 39 | 13.0 | 32 | 10.7 |
| Middle | 72 | 24.0 | 68 | 22. |
| Low | 189 | 63.0 | 200 | 66.7 |
| Smoking | ||||
| Not smoker | 160 | 53.3 | 203 | 67.7 |
| Former smoker | 74 | 24.7 | 54 | 18.0 |
| Smoker | 66 | 22.0 | 43 | 14.3 |
| Physical activity level | ||||
| Active | 99 | 33.0 | 111 | 37.0 |
| Sedentary | 201 | 67.0 | 189 | 63.0 |
Of the total number of interviewees, 94.3% watch TV and 95.4% of them watch it more than three times a week, while 46.5% watch TV for three or more hours a day. The data show that 47.7% of the interviewees use computers and play video games, and 74.5% of them use these devices for more than five hours a day, whilst 55.6% use them for up to two hours a day.
It was possible to observe that 62.8% of the subjects had always worked in the sitting position; 76.3% had worked in the standing position; 48.5% had worked in the standing position and leaning their bodies; 26.0% had worked in the sitting position and leaning their bodies; 2.8% had worked in the kneeling position; and 8.2% had worked in the sitting position and lifting loads. Approximately 60.0% of the subjects had always performed repetitive movements; 33.3% had always carried loads, and 15.8% were always exposed to vibration.
20.3% of the individuals (CI 17.3–23.7) had reported feeling neck pain at least once in the 12 months preceding the interview. From these, 18.0% (CI 14.0–22.7) were men and 22.7% (CI 18.2–27.7) were women.
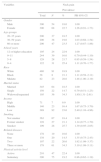
Table 2 shows that the individuals who were separated and widowed, mulatto, had low income, and reported having had two, three or more diseases were associated with the presence of neck pain.
Prevalence of neck pain by sociodemographic characteristics, physical activity level, reported diseases, and smoking.
| Variables | Neck pain | |||
|---|---|---|---|---|
| Prevalence | ||||
| Total | N | % | PR 95% CI | |
| Gender | ||||
| Male | 300 | 54 | 18.0 | 1.00 |
| Female | 300 | 68 | 22.7 | 1.26 (0.91–1.73) |
| Age-groups | ||||
| 20–35 years | 200 | 37 | 18.5 | 1.00 |
| 36–59 years | 200 | 38 | 19.0 | 1.03 (0.68–1.54) |
| 60 or more | 200 | 47 | 23.5 | 1.27 (0.87–1.86) |
| School years | ||||
| 12 or higher education | 105 | 24 | 22.9 | 1.00 |
| 9–11 | 244 | 39 | 16.0 | 0.70 (0.44–1.10) |
| 5–8 | 129 | 28 | 21.7 | 0.95 (0.59–1.54) |
| 0–4 | 122 | 31 | 25.4 | 1.11 (0.70–1.77) |
| Race | ||||
| White | 480 | 91 | 18.9 | 1.00 |
| Black | 38 | 8 | 21.1 | 1.11 (0.58–2.11) |
| Mulatto | 82 | 23 | 28.0 | 1.48 (1.00–2.19) |
| Marital status | ||||
| Married | 345 | 64 | 18.5 | 1.00 |
| Single | 150 | 22 | 14.7 | 0.79 (0.51–1.23) |
| Widowed/separated | 105 | 36 | 34.3 | 1.85(1.31–2.61) |
| Income | ||||
| High | 71 | 7 | 9.9 | 1.00 |
| Middle | 140 | 23 | 16.4 | 1.67 (0.75–3.70) |
| Low | 389 | 92 | 23.6 | 2.40 (1.16–4.96) |
| Smoking | ||||
| Not smoker | 363 | 67 | 18.4 | 1.00 |
| Former smoker | 128 | 27 | 21.1 | 1.14 (0.77–1.70) |
| Smoker | 109 | 28 | 25.7 | 1.39 (0.95–2.05) |
| Related diseases | ||||
| None | 178 | 19 | 10.6 | 1.00 |
| One | 138 | 20 | 14.5 | 1.35 (0.75–2.43) |
| Two | 107 | 22 | 20.6 | 1.92 (1.09–3.37) |
| Three or more | 178 | 61 | 34.3 | 3.19 (1.99–5.11) |
| Physical activity level | ||||
| Active | 210 | 47 | 22.4 | 1.00 |
| Sedentary | 390 | 75 | 19.2 | 0.86 (0.62–1.19) |
PR, prevalence ratios; CI, confidence intervals.
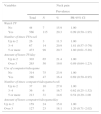
From Table 3, it is possible to notice that the variables related to sedentary activities were not associated with neck pain.
Prevalence of neck pain by sedentary activities.
| Variables | Neck pain | |||
|---|---|---|---|---|
| Prevalence | ||||
| Total | N | % | PR 95% CI | |
| Watch TV | ||||
| No | 44 | 7 | 15.9 | 1.00 |
| Yes | 566 | 115 | 20.3 | 0.99 (0.50–1.95) |
| Number of times TV/week | ||||
| Up to 2 | 26 | 3 | 11.5 | 1.00 |
| 3–4 | 67 | 14 | 20.9 | 1.81 (0.57–5-79) |
| 5 or more | 473 | 98 | 20.7 | 1.80 (0.61–5.28) |
| Amount of hours TV/day | ||||
| Up to 2 | 303 | 65 | 21.4 | 1.00 |
| Over 3 | 263 | 50 | 19.0 | 0.89 (0.64–1.23) |
| Use of computer/videogame | ||||
| No | 314 | 75 | 23.9 | 1.00 |
| Yes | 286 | 47 | 16.4 | 0.69 (0.50–0.95) |
| Number of times computer/videogame/week | ||||
| Up to 2 | 37 | 10 | 27.0 | 1.00 |
| 3–4 | 36 | 6 | 16.7 | 0.62 (0.25–1.52) |
| 5 or more | 213 | 31 | 14.6 | 0.54 (0.29–1.00 |
| Amount of hours computer/videogame/day | ||||
| Up to 2 | 159 | 24 | 15.0 | 1.00 |
| Over 3 | 127 | 23 | 18.1 | 1.20 (0.71–2.02) |
PR, prevalence ratios; CI, confidence intervals.
Neck pain was significantly associated with repetitive movement, activities that require lifting and moving loads, and being in the sitting and leaning positions (Table 4).
Prevalence of neck pain by ergonomic or work variables.
| Variables | Neck pain | |||
|---|---|---|---|---|
| Prevalence | ||||
| Total | N | % | PR 95% CI | |
| Repetitive movements | ||||
| Never/Rarely | 240 | 39 | 16.2 | 1.00 |
| Always/Usually | 360 | 83 | 23.1 | 1.42 (1.01–2.00) |
| Vibration/Shake | ||||
| Never/Rarely | 505 | 98 | 19.4 | 1.00 |
| Always/Usually | 95 | 24 | 25.3 | 1.30 (0.88–1.92) |
| Carrying and transporting loads | ||||
| Never/Rarely | 400 | 72 | 18.0 | 1.00 |
| Always/Usually | 200 | 50 | 25.0 | 1.39 (1.01–1.91) |
| Sitting position | ||||
| Never/Rarely | 223 | 43 | 19.3 | 1.00 |
| Always/Usually | 377 | 79 | 21.0 | 1.09 (0.78–1.52) |
| Sitting and lifting loads | ||||
| Never/Rarely | 551 | 110 | 19.9 | 1.00 |
| Always/Usually | 49 | 12 | 24.5 | 1.23 (0.73–2.06) |
| Sitting and leaning | ||||
| Never/Rarely | 444 | 82 | 18.4 | 1.00 |
| Always/Usually | 156 | 40 | 25.6 | 1.39 (1.00–1.93) |
| Standing position | ||||
| Never/Rarely | 142 | 26 | 18.3 | 1.00 |
| Always/Usually | 458 | 96 | 21.0 | 1.14 (0.77 -1.69) |
| Standing and leaning | ||||
| Never/Rarely | 309 | 56 | 18.1 | 1.00 |
| Always/Usually | 291 | 66 | 22.7 | 1.25 (0.91–1.72) |
PR, prevalence ratios; CI, confidence intervals.
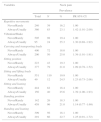
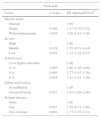
In the Poisson regression, the associations with neck pain remained for the people who were widowed and separated, had low income, had studied for 1–4 years or 5–8 years, often or always performed daily activities while sitting or leaning, and reported having had two or more diseases (Table 5).
Poisson regression analysis, final model, for associations of variables studied with neck pain.
| Neck pain | ||
|---|---|---|
| Factor | p-Value | PR adjusted/95%CI* |
| Marital status | ||
| Married | – | 1.00 |
| Single | 0.466 | 1.17 (0.70–2.22) |
| Widowed/separated | 0.029 | 2.26 (1.42–5.88) |
| Income | ||
| High | – | 1.00 |
| Middle | 0.129 | 1.55 (0.73–4.44) |
| Low | 0.003 | 1.32 (1.22–6.27) |
| School years | ||
| 12 or higher education | – | 1.00 |
| 9–11 | 0.055 | 1.46 (1.16–4.00) |
| 5–8 | 0.040 | 1.77 (1.07–4.76) |
| 0–4 | 0.014 | 1.83 (1.02–5.26) |
| Sitting and leaning | ||
| Never/Rarely | – | 1.00 |
| Always/Usually | 0.021 | 1.55 (1.08–2.40) |
| Related diseases | ||
| None | – | 1.00 |
| One | 0.055 | 1.29 (0.72–2.80) |
| Two or more | 0.001 | 1.71 (1.55–6.31) |
In this study, the prevalence of neck pain was 20.3%, which is similar to what was reported in studies from southern Brazil (24.0%),11 Spain (19.5%),23 and Greece (20.4%)24; these numbers are lower than those found in China (48.7%)5 and Sri Lanka (56.9%),25 and higher than those found in the United States (4.4%).6 These variations in prevalence rates may be related to socioeconomic characteristics (income and education), the perception of human health, the quality of health systems and, especially, the methodological variations of the studies8 (prevalence period, setting the episode of neck pain, and the anatomical location).
Regarding the association of the outcome with the independent variables investigated in this study, marital status, income, years of schooling, sitting and leaning, and related diseases remained associated with neck pain in the final model. Being separated/widowed (2.26; 95% CI 1.42–5.88) is associated with neck pain; this data is similar to what was found in studies from Greece24 and Sweden.26 In Korea27 and in the autonomous community of Madrid,28 differences in marital status were not observed. The literature states that the influence of marital status is not completely clear. Marital status is probably not a risk factor for pain, but a mark for risk, and it may be related to more ergonomic exposures at home/work or characteristics of behavioral risk.29 Another plausible explanation is the increased social support for those who live with a partner.29
Working in sitting and leaning body positions is the ergonomic exposure that remains associated with the outcome, which is in accordance with studies from China,5 Sweden,30 and Sri Lanka.25 There are no noticeable differences in studies from Thailand31 and Estonia.32 The sitting posture in occupational activities – associated with poor postural habits, ergonomically unsuitable environments, and psychosocial factors – increases the activity of the neck extensor muscles and the sternocleidomastoid by about 35%. There is also an increase in internal pressure on the intervertebral disc core, an increase in compressive load on neck ligaments, joint capsules, and other structures of the cervical spine. This contributes to the development of inflammations in musculoskeletal structures associated with painful symptoms, as well as neck pain.33
Neck pain was associated with individuals who reported having two or more diseases. This data is similar to what was found in studies from the community of Madrid34 and the countries of Denmark35 and Spain.23 The presence of pathological disorders makes the individual more susceptible to pain. Thus, the predisposing individual risks for pain are the previous pathological experiences and the similar symptoms in other parts of the body.36 Malchaire et al.3 state that this interpretation is difficult because most studies are cross-sectional; therefore, the association of symptoms with the diseases can be interpreted as a cause or as an effect.3
Low levels of income and education are associated with the outcome, which corroborates the results found in Germany37 and in the Spanish community of Catalunya38 and contradicts those found in countries such as Spain,23 Korea,27 and Sweden.30 There are some hypotheses that could explain the association between events related to health and low education: socioeconomic groups not having access to specialized interventions; low knowledge interfering with the understanding of risk factors, the adoption of self-care actions, and the adherence to interventions. Individuals with low education usually work in occupations with high risk of musculoskeletal injury.39 The other variables did not show statistically significant results in the final model; however, the literature describes these variables as risk factors for the presence of neck pain.
The main limitation of the study is the fact that data regarding the frequency, severity, intensity, length of neck pain, and how the outcome affected and/or limited the subjects’ regular activities or how it changed their daily routine, have not been collected. The strength of the study is that the results are consistent with the literature and the number of interviewees.
Neck pain is a common condition that causes substantial disability. Considering that the available data from national surveys on the outcome are scarce in Brazil, this study will contribute as a reference for other epidemiological investigations and will cooperate with the national assessment of prevalence and risk factors, systematic reviews, and meta-analyses. Further studies should be conducted on the predictors and the clinical outcome of neck pain in different configurations.
This study reveals a high prevalence of neck pain and remarkable associations with individuals who are widowed/separated people, perform occupational activities while sitting and leaning, have low levels of education and income, and report two or more diseases. Knowledge of these risk factors will contribute to the development of assistance programs for the prevention and management of neck pain.
Conflicts of interestThe authors declare no conflicts of interest.


