

Plantar fasciitis is commonly found among the physically active population, including conscripts. Some studies have reported that being overweight and having psychological symptoms contribute to pain from plantar fasciitis. However, there is a lack of information regarding the physical predictors, and more research is needed to determine the relationship between such predictors and pain intensity from plantar fasciitis in conscripts.
ObjectiveTo determine which physical and psychological variables act as predictors of pain intensity among Thai novice conscripts with plantar fasciitis.
MethodsTwo hundred and seventy Thai novice conscripts without musculoskeletal pain completed the Depression, Anxiety and Stress Scale short version and then received baseline assessment of ankle dorsiflexion angle, ankle plantarflexor strength, and quality of lower extremity movement from a physical therapist. After 10 weeks of military training, 71 of these Thai conscripts developed pain from plantar fasciitis. Multiple linear regression analysis with the forward stepwise method was used to explore the predictors of pain intensity due to plantar fasciitis.
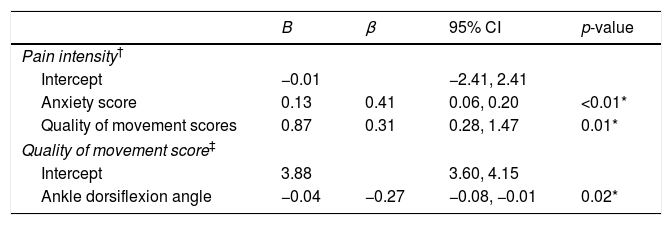
ResultsUsing a forward regression analysis, anxiety (B=0.13; 95% CI, 0.06–0.20; p<0.01) and quality of movement score (B=0.87; 95% CI, 0.28–1.47; p=0.01) were significant predictors of pain intensity. The regression model with these predictors explained 25% of the variability in pain intensity from plantar fasciitis.
ConclusionHigher scores of anxiety and movement quality on the lateral step-down task were associated with pain intensity from plantar fasciitis after the completion of a 10-week military program. However, lower ankle dorsiflexion angle and ankle plantarflexor strength did not predict pain intensity.
Plantar fasciitis (PF), the most common cause of plantar heel pain, has an unfavorable impact on quality of life related to foot health and general health.1,2 PF comprises up to 15% of all adult foot complaints and accounts for 8–10% of running-related and training-related injuries.3,4 The prevalence of this condition in athletic, occupational, and military settings is commonly reported.1,5,6 Previous studies reported a number of risk factors for PF, including higher body mass index (BMI), greater training frequency, greater training duration, training on hard surfaces, inappropriate footwear, and sudden changes in running variables such as distance, frequency, speed, and surface.7,8 Pain associated with PF may restrict the ability of patients to perform activities during daily life, work, and social and family functions, leading to substantial disability and poor health-related quality of life.5
Individuals with PF have worse foot-specific quality of life, including lower foot function, than asymptomatic controls.2 Reduction in foot function and gait capacity affects overall health and may account for the reduction of general health-related quality of life.2 Specific deviations in foot and ankle variables such as limited ankle dorsiflexion angle and deficits in ankle plantarflexor strength have been reported to be PF-related gait limitations that lead to the onset of pain and to functional changes in foot biomechanics during the stance phase of the gait cycle.9–11 Limited ankle dorsiflexion angle causes excessive midfoot pronation during the midstance phase. In addition, deficits in ankle plantarflexor strength may reduce the ability to generate concentric force for gait propulsion. The plantar fascia then increase in tension during the windlass mechanism.10 Abnormal foot biomechanics such as excessive foot pronation may disrupt the synchronous movement of the foot, tibia, femur, and pelvic regions, leading to functional changes in the lower kinetic chain.9,12
Beyond addressing foot biomechanics, examining gait variables in the area proximal to the foot and ankle may clearly illustrate gait deviations in PF. A number of studies have also mentioned decreased strength of the core trunk and hip muscles as possible risk factors for PF.13,14 The reduction in core strength may alter the lower-extremity movement pattern, resulting in excessive femoral adduction and medial rotation as well as knee valgus, all of which may have significant implications for distal limb function. Due to these changes, overload weight-bearing activities produce excessive medial rotation of the femur and tibia as well as more foot pronation, which then leads to disruption of the plantar fascia during the midstance phase of the gait cycle.12,15
In addition to physical factors, psychological factors also seem to influence PF pain. It is possible that other nonbiological mechanisms may affect pain perception.16 Stress and depression were found to be significantly associated with foot pain in female patients with PF.16 In particular, emotional stress is the main cause of reduced functional status and physical fitness, conditions that lead to susceptibility to overuse injuries in military and other young, physically active populations.17 Direct interactions among the brain, perceptions and emotional reactions, and the body influence physical function and symptom expression in each person.18 Stress signals may cause a reduction in blood flow to specific bones and tissues. Additionally, activities that place much stress on the foot cause mechanical stiffness of the plantar fascia. This increased stiffness leads to higher hydrostatic pressure within the plantar tissues during loading, a condition that may reduce the cross-sectional area of blood vessels and decrease local blood supply.19 This results in oxygen deprivation of specific tissues and increased susceptibility to physical pain.20
An overall review of the literature indicates that physical and psychological factors are reported as the main contributors to pain from PF.9,11,13,14,16 However, there is a lack of evidence from prospective cohort studies regarding the prognosis of PF. Since pain is the main complaint of patients with PF, the current study was conducted to examine the predictors of pain intensity in individuals with PF. This study involved male conscripts who were enrolled in a 10-week training program consisting of long-distance running (at least 10km per week) and high-load weight-bearing exercises that could increase the risk of PF and other lower-extremity injuries.21 The objective of this prospective cohort study was to determine whether physical variables (i.e., ankle dorsiflexion angle, ankle plantarflexor strength, and lower-extremity movement pattern) and psychological variables (i.e., depression, anxiety, and stress scores) were associated with pain intensity in conscripts with PF. We hypothesized that both physical and psychological factors could influence the intensity of pain due to PF during participation in the military training program.
MethodsA prospective cohort study with a 10-week follow-up was conducted. The participants in the study were Thai male conscripts who attended basic military training from May to July 2016 at the Infantry Battalion of the 11th Military Circle, a military training center in Bangkok city. The studied variables included BMI, depression, anxiety, and stress scores, ankle dorsiflexion angle, ankle plantarflexor strength and lower extremity movement pattern.
Study populationA total of 502 Thai male conscripts 20 years of age and older were invited to enroll in the present study. Of these, 457 conscripts agreed to participate and were subsequently asked to complete a screening questionnaire (Fig. 1). The exclusion criteria were: lower back and/or lower extremity pain during the last three months with a visual analog scale (VAS) of more than 3cm, history of PF, history of lower extremity fracture/surgery, and medical diagnosis of gout, rheumatoid arthritis, systemic lupus erythematosus (SLE), cancer, or infectious disease. The most painful side was selected for the analysis. In cases with equal foot pain intensity in the PF group, the leg side was randomly selected using a computer program. On physical examination, individuals with differences of more than 1cm in true leg length and positive signs on the straight leg raising (SLR) test, such as numbness, paresthesia or referred pain in the posterior leg, were excluded.22 One hundred and eighty-seven conscripts fulfilled at least one of these criteria and were excluded from the study. The remaining 270 conscripts were followed up for a period of 10 weeks during military training. They were all enrolled in the same military training program, which combined daily physical training and military skills training. The physical training program consisted of running approximately 40km per week and performing physical exercises such as push-ups, sit-ups, pull-ups and chin-ups for approximately two hours per day. The military skills training included postural training with and without a weapon, periodic road-march training, marksmanship training, maneuvers during the day and at night, and training in throwing explosives, camouflage and reconnaissance. All participants gave written informed consent to participation in the study, and their rights were protected. According to the rule of thumb for determining sample sizes,23 106 conscripts were required to achieve 80% power from the regression analysis in the current study. The study procedures were approved by the ethics committee of Chulalongkorn University, Thailand (approval no. 077/2016).
Questionnaires
Two different sets of questionnaires were used during the study period. The first set was used to collect individual and psychological factors at baseline, including age, BMI, depression, anxiety, and stress scores. The Depression, Anxiety and Stress Scale short version (DASS-21) was used to evaluate the participants’ psychological symptoms; higher scores indicated greater severity of the symptoms.24,25 The depression scale contains items related to low positive affect, hopelessness, devaluation of life, self-deprecation, and inertia. It does not contain somatic items. High scores on this scale are associated with mood disorders. The anxiety scale has items related to autonomic arousal, physiological hyperarousal, feelings of fear, and panic attacks. High scores on this scale are associated with panic disorder. The stress scale contains items reflecting difficulty relaxing, tension, impatience, irritability and agitation, and overreaction to stressful events. High scores have been associated with generalized anxiety disorder.24 The second set was a follow-up questionnaire that was used to screen conscripts with PF and to collect data on the average intensity of pain from PF in the previous week.1
Lower-extremity physical examinationPhysical variables, including ankle dorsiflexion angle, ankle plantarflexor strength, and lower extremity movement pattern, were assessed by the first physical therapist, who was assigned to conduct specific assessments in a standardized manner. Before data were collected for the current study, a pilot study was performed to compute the intrarater reliability of physical examinations of 10 male conscripts. The results showed ICC3,1 ranging from 0.72 to 0.96, indicating moderate to good reliability.26
Active ankle dorsiflexion angle was first assessed with the subject in a prone position with knee extension. A standard goniometer was placed on the heel, and the angle between a vertical line and the lateral line of the fifth phalange was measured.27 The average angle measured in three trials was recorded. Then, ankle plantarflexor strength was assessed using the single-leg heel rise task. The participant was instructed to keep his trunk straight and to elevate the heel, rolling on the ball of the foot, every two seconds in rhythm with the metronome. The number of sufficient single heel rises was counted and recorded. The task was ended when the subject presented at least one of the following movements: forward movement of the trunk, knee flexion, inability to complete the full range of ankle plantarflexion, and inability to repeat the task. The previous study reported the normal ankle plantarflexor strength observed during repetition of this task at least 25 times. The task was terminated if the height of the heel rise was less than 50% of the full height measured at the beginning of the task.28
Lower extremity movement pattern was measured using the lateral step down (LSD) test with the contralateral leg hanging down from a 15-cm step height.29,30 The participant was instructed to bend the knee of the tested leg until the contralateral leg touched the floor and then return to the starting position. During the LSD task, the examiner assigned a score based on five criteria: arm strategy, trunk alignment, pelvic plane, knee position and steady stance. The score ranged from 0 to 6 points; a higher score indicated poorer quality of movement. The abnormalities that could be observed during assessment included: removal of a hand from the waist (1 point), leaning of the trunk in any direction (1 point), movement of the pelvis in the horizontal plane (1 point), medial movement of the tibial tuberosity to either the second toe (1 point) or to the medial border of the foot (2 points), and stepping down on the nontested limb (1 point). Lower extremity movement patterns were categorized into three levels corresponding to good (0–1 point), moderate (2–3 points) and poor (4–6 points) quality of movement.29
Study proceduresBaseline measurements were collected prior to the beginning of military training. A total of 270 participants completed a self-report questionnaire and underwent physical examination by the first physical therapist. All participants were asked to complete the follow-up questionnaire at 2-week intervals during the 10-week military training period. The participants who reported foot or heel pain were required to see the second physical therapist (P.H.), who had 9 years of clinical experience in the assessment and treatment of foot and ankle problems and who diagnosed the presence or absence of PF. The PF diagnostic criteria included tenderness of the medial calcaneal tubercle, heel pain from ordinary weight-bearing activities, and heel pain during the first few steps of walking after a prolonged period of inactivity that gradually decreased after walking for a while.1,5 In the follow-up evaluation, 71 conscripts were diagnosed as having PF (Fig. 1). Data from this group were used in the statistical analysis.
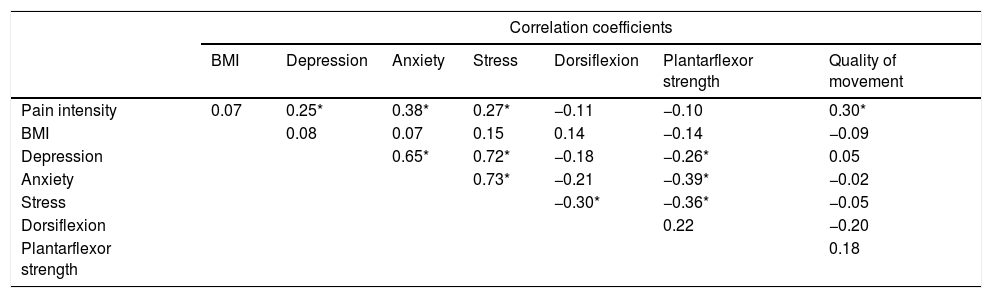
Statistical analysisDescriptive statistics were used to present the baseline characteristics of the participants and average pain intensity from PF during the previous week. We first performed a correlation matrix of the variables to determine the univariate relationships among all variables by calculating either Pearson or Spearman ρ coefficients. In the case of high correlation (r=0.65) among all independent variables, only the variable that was most correlated with pain intensity was retained in the multiple linear regression to prevent multicollinearity of the independent variables.
To investigate the predictors of pain intensity, using the VAS, among Thai novice conscripts with PF, all independent variables (BMI, depression, anxiety, stress, ankle dorsiflexion angle, ankle plantarflexor strength, and quality of lower extremity movement scores) were included in multiple linear regression using the forward stepwise method. Since the significant predictors should be individually and sequentially entered into the regression model according to their relationship with the dependent variable, we used the forward selection procedure to analyze the data. The significance level of the linear regression results was tested at each step, and the standardized β coefficients for each variable in the final model were calculated. Regression diagnostics (collinearity and residuals analysis) were performed to determine whether the data were appropriate for regression analysis.31 We additionally performed the second model to investigate the predictors of quality of lower extremity movement score using two independent variables, ankle dorsiflexion angle and ankle plantarflexor strength. There were no significant differences between the right and left legs in any of the physical examination tests. All statistical analyses were performed using SPSS software version 22.0 (IBM statistics) with a significance level of p<0.05.
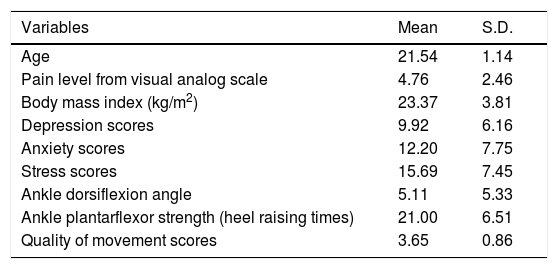
ResultsSeventy-one (26.2%) of the 270 conscripts had PF symptoms after 10 weeks of military training. The average pain score of the 71 participants with PF was 4.76±2.46 (Table 1). As shown in Table 2, there was significant correlation between pain intensity and depression (r=0.25, p=0.03), pain intensity and anxiety (r=0.38, p<0.01), pain intensity and stress (r=0.27, p=0.03) and pain intensity and quality of movement score (r=0.30, p=0.01). In the multicollinearity analysis, anxiety was highly correlated with depression (r=0.65, p<0.01) and stress (r=0.73, p<0.01). The highest correlation was found between pain intensity and anxiety score. Thus, only the variable anxiety was included in the multiple linear regression analysis.
Characteristics of the participants (n=71).
| Variables | Mean | S.D. |
|---|---|---|
| Age | 21.54 | 1.14 |
| Pain level from visual analog scale | 4.76 | 2.46 |
| Body mass index (kg/m2) | 23.37 | 3.81 |
| Depression scores | 9.92 | 6.16 |
| Anxiety scores | 12.20 | 7.75 |
| Stress scores | 15.69 | 7.45 |
| Ankle dorsiflexion angle | 5.11 | 5.33 |
| Ankle plantarflexor strength (heel raising times) | 21.00 | 6.51 |
| Quality of movement scores | 3.65 | 0.86 |
Correlation analysis among the variables.
| Correlation coefficients | |||||||
|---|---|---|---|---|---|---|---|
| BMI | Depression | Anxiety | Stress | Dorsiflexion | Plantarflexor strength | Quality of movement | |
| Pain intensity | 0.07 | 0.25* | 0.38* | 0.27* | −0.11 | −0.10 | 0.30* |
| BMI | 0.08 | 0.07 | 0.15 | 0.14 | −0.14 | −0.09 | |
| Depression | 0.65* | 0.72* | −0.18 | −0.26* | 0.05 | ||
| Anxiety | 0.73* | −0.21 | −0.39* | −0.02 | |||
| Stress | −0.30* | −0.36* | −0.05 | ||||
| Dorsiflexion | 0.22 | −0.20 | |||||
| Plantarflexor strength | 0.18 | ||||||
As shown in Table 3, the final model from forward regression indicated that the average pain intensity was associated with anxiety (p<0.01) and quality of lower extremity movement (p=0.01). The conscripts with PF who reported higher levels of pain intensity scored higher on anxiety and quality of lower extremity movement. From the regression model, there was a 0.13cm increase in pain intensity for each point of anxiety score, and there was a 0.87cm increase in pain intensity for each point of quality of lower extremity movement score. The overall model accounted for 25% of the variation in pain intensity. As seen in Table 3 the additional regression model indicated that the only variable associated with quality of lower extremity movement was ankle dorsiflexion angle (p=0.02). The conscripts with PF who reported poorer quality of movement had lower ankle dorsiflexion angle. Two models from the regression analysis met the assumptions of homogeneity of variance and linearity; additionally, the residuals were approximately normally distributed.
Multiple linear regression to predict pain intensity and quality of movement scores among Thai novice conscripts with plantar fasciitis.
The main purpose of the current cohort study was to determine the physical and psychological predictors of pain intensity among conscripts with PF. The authors conducted research on this specific population since the conscripts were enrolled in a vigorous training program that could increase injury from PF; the training program included high-load activities, training on hard surfaces, long-distance running, and the use of rigid footwear.6,21 This helped ensure that the reported pain intensity level depended on physical and psychological variables and not on environmental variables. In the 71 participants with PF, the significant variables included anxiety score and movement quality on an LSD task. The variables that were found to be highly correlated with pain intensity were important in monitoring changes in PF management.32
Among all physical variables, the current study demonstrated that a higher score on the LSD test – which reflects poorer core stability and quality of lower extremity movement – was associated with higher pain intensity in conscripts with PF. Generally, the components of core stability assessment include strength, endurance, flexibility, motor control, and function.33 The LSD test provides a functional assessment of core stability based on measurement of the movement coordination of the arms, trunk, and lower extremities. During this task, the joints of the stance leg are required to flex to move the contralateral foot to the floor. Impairment in range of motion or decreased neuromuscular control of any portion of the lower extremity may require alternative strategies to complete the task.34 As seen in Table 1, the mean angle of ankle dorsiflexion was less than the normative data value (angle<10°).35 Although this factor showed little association with pain intensity, it was significantly associated with poor quality of movement. A compensatory movement that is often used to attain more dorsiflexion is pronation of the subtalar joint; this pronation is, in turn, related to internal rotation of the tibia and dynamic valgus of the knee.34 It has been assumed that patients with higher pain intensity from PF have more dynamic pronation of the subtalar joint, leading to elongation of and excessive tension in the plantar fascia.
Although higher BMI and some physical assessments of lower extremity movement (i.e., lower ankle dorsiflexion angle and lower ankle plantarflexor strength) were previously reported as risk factors for PF,5,9 there was little association of these variables with pain intensity. The variables analyzed in the current study differed from the variables investigated in previous studies that used a multiple regression approach. For example, Riddle et al.32 incorporated the variables age, BMI, pain duration, pain intensity, and ankle dorsiflexion angle into a regression model to predict self-reported disability in patients with PF. They found only BMI to be significantly associated with disability. The contrasting findings could reflect differences in patient population and condition that include both the severity and duration of symptoms.
Among the studied psychological variables, anxiety was the most significant predictor of pain intensity in conscripts with PF. The anxiety scale includes items related to autonomic arousal, physiological hyperarousal, feelings of fear, and panic attacks. High scores on this scale are associated with panic disorder.24 Anxiety might induce withdrawal and avoidance of functional activities due to negative appraisal of individual capacities. Persons suffering from this condition might also have a reduced ability to cope with pain. Fear of being hurt and the anticipation of suffering are factors that have been found to be highly correlated with pain intensity.36 However, the current study reports psychological factors differently from previous research. For example, Cotchett et al. conducted two studies to determine the impact of psychological factors on foot pain in patients with PF.16,37 One study reported no significant association between any of the tested psychological variables (depression, anxiety, and stress) and foot pain scores based on a foot health status questionnaire (FHSQ) administered to male patients with PF.16 In contrast, the other study found a significant association between first-step pain and pain catastrophizing 37, which is defined as “an exaggerated negative mental state brought to bear during an actual or anticipated painful experience”.38 The latter study also indicated a role of psychological factors in patients with PF. Such findings add further supportive evidence for the notion that psychological symptoms are important factors that contribute to pain development from PF, as found in the current study.
Some limitations of the present study should be noted. The participants in this study were novice conscripts, and they represent a population that is engaging in vigorous physical activity. The results are not applicable to the general population, including athletic groups and male groups in the same age range. Therefore, the clinical implications of these results should be recognized before the results are applied to other population groups, and the results should be validated in other samples of patients with PF. In addition, the sample size in this study was quite small. However, as shown in Table 2, only five variables were included in the multiple linear regression analysis; thus, the target sample size is 90 conscripts.
Notwithstanding these limitations, a major strength of this study is that it represents the first prospective cohort study to investigate the physical and psychological factors related to pain in conscripts with PF. Our study provided information regarding the role of proximal biomechanics, other than only foot and ankle regions, to the development of PF. The significant predictors identified in this study can be used to screen novice conscripts who may develop higher pain intensity from PF. Since quality of movement was found to be a predictor of pain from PF, a program designed to strengthen the core trunk and hip muscles prior to the beginning of military training should be included in the military training program. In addition, future studies should determine the role of psychological factors and how they relate to the level of pain due to PF.
ConclusionsThe results demonstrate that conscripts who had anxiety and poor quality of lower extremity movement at baseline developed higher pain intensity from PF after the 10-week military program than conscripts who lacked these characteristics. Focusing on these variables may improve the effectiveness of physical therapy intervention for conscripts with PF. Both prevention and treatment programs should consider the importance of functional core stability and psychological factors as a means of achieving a better outcome.
Authors’ contributionsPH, PP, and SB: (1) Substantial contributions to conception and design, or acquisition of data, or analysis and interpretation of data. (2) Drafting the article or revising it critically for important intellectual content. (3) Final approval of the version to be published. (4) Taking public responsibility for its content.
Funding statementThis study was supported by the scholarship from “The 100th Anniversary Chulalongkorn University Fund for Doctoral Scholarship” and “The Faculty of Allied Health Sciences, Chulalongkorn University”, Bangkok, Thailand.
Conflicts of interestThe authors declare no conflicts of interest.
The authors would like to thank the Thai male conscripts from the Infantry Battalion of 11th Military Circle, the center camp of military training in Bangkok for their participation on this study.
The following are the supplementary data to this article:


