Isometric muscle strength measured by Handheld dynamometer indicates physical ability. There is no normative data for the Brazilian population. This study aims (a) to describe the development of isometric muscle strength in healthy children and adolescents 5–15 years of age; (b) to evaluate Handheld dynamometer inter and intra-rater reliability.
MethodsIsometric muscle strength was obtained for shoulder abduction, elbow and knee flexion and extension, dorsiflexion and plantar flexion in 55 boys and 55 girls, aged between 5 and 15 years. Inter-rater reliability was determined based on the evaluation of 2 raters, with a 20-min interval between them. Intra-rater reliability was based on 2 evaluations from the same rater, one week apart. Interclass correlation coefficient (ICC2,1; 3,1), Bland Altman plots and linear regression models with mixed effects were used to quantify inter and intra-rater reliability, agreement and associations with physical activity level and maturational factors.
ResultsA linear development of isometric muscular strength was observed for ages between 5 and 10. After age 10, boys showed a larger isometric muscular strength, when compared to girls. Both inter and intra-rater measurements of the Handheld dynamometer are reliable (ICC>0.63).
ConclusionsThis study shows increase in isometric muscle strength starting at 10 years of age for boys, when compared to girls and inter and intra-rater reliability for the assessment of isometric strength, using the Handheld dynamometer for the muscle groups tested on the dominant and non-dominant side, for children between 5 and 15 years of age.
Maximal muscular strength generated by a muscle, or by a muscle group, suggests the physical ability of a subject. In order to measure and to quantify the muscle performance using an isometric contraction, the Handheld dynamometer (HHD) has been used in clinical practice. HHD is an easy-to-handle instrument with wide applicability and it presents quick and objective responses.1–4 Normative data are available for some specific populations, such as healthy athletes,5 adults6 and children.7 Specifically, for the last group, a set of studies report normative isometric strength data for various muscle groups, spanning the ages of 3–18. These studies are from Canada, Australia, Sweden and France.7–10 Data from the South American population have not yet been published.
Inter and intra-rater reliability data are essential in clinical practice, since they allow for the reproduction of the measurements by different raters and permit monitoring different diseases and their history. HHD inter and intra-rater reliability for assessing isometric muscle strength (IMS) was evaluated for children aged 4–17 years by Hébert et al.,2 and 2 to years by Rose et al.1 Gajdosik11 evaluated only the intra-rater reliability for children aged 2–4 years and Eek et al.8 evaluated only the inter-rater reliability for children aged 6–13 years. These studies show us the lack of normative (or reference data) and inter-rater reliability data for different muscle groups of the upper and lower limbs.
Muscular strength development is associated with factors such as age, sex, sexual maturation, physical activity level, height, body mass index and limb dominance.7,8,12,13 Among these factors, height usually has a strong positive correlation with strength development,7,9,10,14 followed by body mass index (BMI).7,14 Intercontinental anthropometric characteristics deserve special attention in normative studies. In adulthood, height is dependent on the genetic inheritance associated with environmental stimuli (positive and negative) received throughout an individual's growth.15,16 Studies conducted by Howe et al.17 demonstrated that height is a variable related to the child's length at birth and that, in high-income countries, it is minimally influenced by the socioeconomic factor.17 BMI is influenced by eating habits and physical activity level, and both are influenced by the educational level of the family.18 BMI is also influenced by the local temperature (or climatic state of a certain locality) which in turn, influences the level of physical activity.19
Thus, besides the presumed genetic inheritance, climatic and socio-cultural differences may influence the muscular strength performance in children and adolescents. This study aimed to evaluate the development of isometric muscular strength for the main muscle groups of the upper and lower limbs in healthy children and adolescents, using the HHD. We developed referenced data for the Latin American population and showed inter and intra-rater reliability of the tool used.
MethodsStudy design and participantsThis was a cross-sectional observational study. The sample size was calculated using a 95% confidence level, 20% amplitude and an estimate of 0.70 for the intraclass correlation coefficient – ICC.20 The total sample size estimated was 110 children and adolescents, assigned to 11 groups of 10 individuals according to age (5–15 years). Each age group was composed of 5 boys and 5 girls.
The 110 healthy Brazilian children and adolescents, who participated in the study, were recruited from private schools and non-governmental organizations (NGOs) from Ribeirão Preto. Inclusion criteria were: (a) absence of any diseases and, (b) intact cognitive function to understand the commands given by the rater. Exclusion criteria were: (a) history, confirmed by caregivers, of neurological orthopedic deformity or complaint of muscle weakness or pain, (b) use of medications for pain or musculoskeletal disorders, (c) history of trauma or fractures up to 12 months prior to the test, and (d) previous surgeries on the upper limbs and/or spine. Guardians signed the Free and Informed Consent form and the participants signed the Assent. This study was approved by the Ethics and Research Committee with human beings of the Hospital das Clínicas da Faculdade de Medicina de Ribeirão Preto [protocol number 38398414.2.0000.5440].
Instrumentation and proceduresGuardians answered a health assessment questionnaire about the participant's health. When the inclusion criteria were met, a visit was scheduled to take place at the school or the NGOs, where measurements were taken. The body mass was obtained by weighing each participant with a digital scale (Zhongshan, Camry® Electronic), with values in kg and fractions of 0.5kg. Height was measured by means of a graduated measuring tape in millimeters with a total of 2m (value recorded in meters), which was affixed to the wall. Measurements were obtained with the child or adolescent standing, leaning against the wall, without shoes. BMI was calculated by dividing body mass by the square of the body height. To determine hand dominance, the participant was asked which was the upper limb most used to perform daily tasks. The International Physical Activity Level Questionnaire (IPAQ) was used to classify the physical activity level. The maturational Tanner questionnaire was answered by children ages 10 and older, in a private place. For the children younger than 10, guardians were responsible for answering the questionnaire, to ensure validity of the answers and to protect the privacy of the participants.21
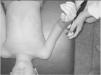
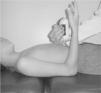
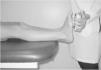
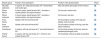
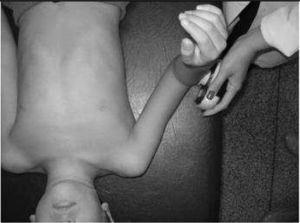
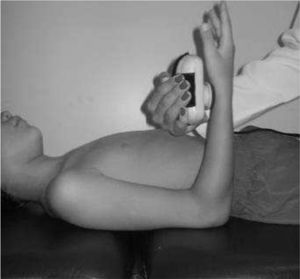
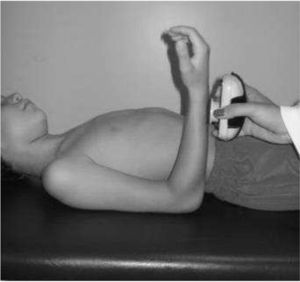
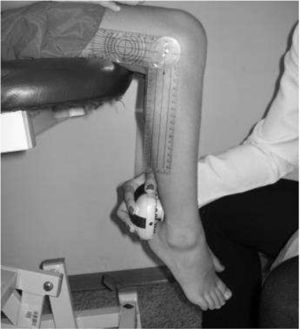
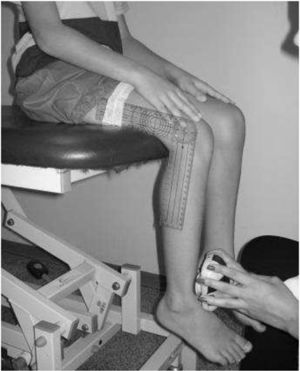
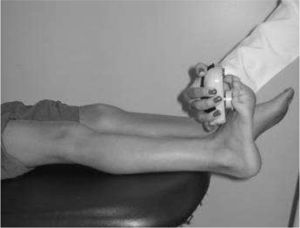
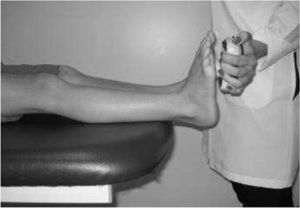
IMS was measured using a Handheld dynamometer (Lafayette Instrument®, Lafayette, UK) capable of quantifying up to 136.1kgf. The muscle groups measured bilaterally were: shoulder abductors, elbow flexors, elbow extensors, knee flexors, knee extensors, dorsiflexors and plantar flexors. The positioning for the acquisition of IMS data was standardized, following the methodology of Beenakker et al.,22 and Hébert et al.,2 and it is described in Table 1. In both evaluations, the participants performed three repetitions of maximal isometric contractions of each muscle group and maintained the contraction for 5s. A rest interval of 30s, between contractions, was ensured. Participants were instructed to remain in the proper position during the test, in order to avoid destabilization of the assessed limb, but when this occurred, the measurement was repeated. Participants were verbally encouraged, with the voice command “push”, to perform their maximum muscle strength without moving the assessed limb.
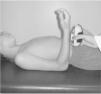
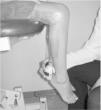
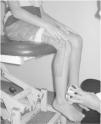
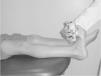
Description of the isometric muscle strength assessment protocol.
| Muscle group | Position of the participant | Position of the dynamometer | Photo |
|---|---|---|---|
| Shoulder abductors | In supine, 45° abducted shoulder, 90° flexed elbow and neutral grip | Near the lateral epicondyle of the humerus | |
| Elbow flexors | In bench press, elbow flexed at 90°, shoulder in neutral position and supine forearm | On the wrist, anterior face | |
| Elbow extensors | In bench press, elbow flexed at 90°, shoulder in neutral position and supine forearm | On the wrist, rear face | |
| Knee flexors | Seated, with the knee flexed 90° | On the posterior surface of the leg and distally, near the ankle | |
| Knee extensors | Seated, with the knee flexed 90° | On the anterior surface of the leg, near the lateral malleolus | |
| Dorsiflexors | In supine, with hip and knee at 0° and ankle flexed at 90° | On the dorsal surface of the foot, near the metatarsophalangeal joints | |
| Plantar flexors | In supine, with hip and knees at 0° of flexion and ankles flexed at 90° | On the plantar surface as distal as possible | |
Inter-rater reliability was determined by using two evaluations performed by two trained examiners (rater A and rater B) on the same day, with a 20-min interval between evaluations. Intra-rater reliability was determined by using the evaluation of one rater (rater A) on two different days (assessment A1 and assessment A2), with an interval of up to one week between the two assessments.
Data analysisStatistical analysis was performed using SAS System, version 9.3. Descriptive statistics were conducted to characterize boys and girls with mean and 95% CI for the IMS of each muscle group, bilaterally. Intraclass correlation coefficient of randomly selected raters (ICC2,1) and Intraclass correlation coefficient, between raters A and B, (ICC3,1) with 95% confidence interval (CI) were used to evaluate inter-rater reliability. The degree of reliability used (ICC from 0 to 1) was the one described by Landis and Koch,23 as follows: <0, poor reliability; 0–0.20, low reliability; 0.21–0.40, good reliability; 0.41–0.60, moderate reliability; 0.61–0.80, great reliability and 0.81–1, excellent reliability. The agreement between the IMS measures, obtained in the A1 and A2 assessments, was analyzed by the Bland and Altman plot, considering multiple observations per subject. To compare the IMS between the dominant and non-dominant sides, and to associate with the IPAQ and the maturational classification of Tanner, we used the linear regression model with mixed effects.
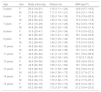
ResultsCharacterization of the sampleAnthropometric characteristics of the sample are presented in Table 2. Based on the growth curve of the World Health Organization, considering the mean BMI of the groups divided by age and sex, the sample was characterized as eutrophic. There was predominance of right-handers (97%) and no record of ambidextrous. Analysis of physical activity level indicated that 56.3% of the girls were insufficiently active (56.3%), 14.5% sedentary, 23.6% active and 5.6% very active; 50.9% of the boys were insufficiently active, 12.8% sedentary, 16.3% active and 20% very active. According to the classification of sexual maturation, the majority of the sample was pre-pubertal (58%), 38% pubertal and 4% post-pubertal.
Anthropometric characteristics shown as mean and interval (minimum and maximum) for each age group separated by sex.
| Age | Sex | Body mass (kg) | Stature (m) | BMI (kg/m2) |
|---|---|---|---|---|
| 5 years | F | 20.0 (18–21) | 1.16 (1.11–1.24) | 14.8 (13.7–16.2) |
| M | 21.8 (16–26) | 1.17 (1.15–1.21) | 16.0 (12.1–19.0) | |
| 6 years | F | 27.8 (21–32) | 1.25 (1.19–1.33) | 17.6 (13.9–20.2) |
| M | 22.2 (20–24) | 1.20 (1.16–1.24) | 15.3 (13.9–17.8) | |
| 7 years | F | 25.2 (16–29) | 1.23 (1.13–1.29) | 16.2 (12.5–19.8) |
| M | 30.8 (25–39) | 1.26 (1.25–1.33) | 17.8 (14.8–21.4) | |
| 8 years | F | 31.6 (23–41) | 1.34 (1.33–1.36) | 17.4 (13.0–22.2) |
| M | 32.0 (25–45) | 1.32 (1.21–1. 90) | 18.1 (14.6–23.6) | |
| 9 years | F | 38.4 (24–46) | 1.39 (1.29–1.43) | 19.5 (14.4–24.2) |
| M | 33.2 (26–45) | 1.36 (1.30–1.40) | 17.8 (14.3–23.0) | |
| 10 years | F | 44.8 (24–65) | 1.45 (1.33–1.59) | 20.3 (13.6–25.7) |
| M | 34.6 (31–40) | 1.43 (1.40–1.46) | 16.7 (14.7–18.8) | |
| 11 years | F | 46.2 (34–60) | 1.41 (1.14–1.55) | 23.1 (16.2–26.9) |
| M | 41.0 (30–55) | 1.50 (1.39–1.60) | 17.9(13.7–22.8) | |
| 12 years | F | 46.4 (34–56) | 1.56 (1.43–1.66) | 18.8 (16.6–20.3) |
| M | 44.8 (34–59) | 1.56 (1.47–1.62) | 18.1 (15.2–23.0) | |
| 13 years | F | 50.2 (46–54) | 1.61 (1.59–1.66) | 19.2 (18.2–21.4) |
| M | 60.0 (51–70) | 1.64 (1.56–1.72) | 22.2 (17.9–27.1) | |
| 14 years | F | 59.6 (40–73) | 1.64 (1.60–1.75) | 21.9 (16.0–28.5) |
| M | 63.2 (49–74) | 1.70 (1.62–1.77) | 21.2 (17.8–25.1) | |
| 15 years | F | 60.6 (44–79) | 1.62 (1.55–1.72) | 22.8 (14.4–30.1) |
| M | 63.2 (55–68) | 1.72 (1.67–1.80) | 21.2 (19.4–23.5) | |
Subtitle: BMI, body mass index; F, female; M, male; kg, kilograms; M, meters.
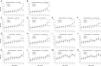
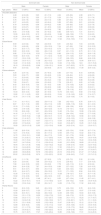
Fig. 1 shows the mean and 95% CI for the IMS of each muscle group bilaterally, for both boys and girls, aged 5–15 years. The normative data and 95% CI for isometric muscular strength bilaterally of shoulder abductors, flexors and elbow extensors, flexors and extensors of knees, dorsiflexors and plantar flexors is shown in the supplementary material (Appendix A). Up to 10 years of age, no significant difference was observed in IMS development between boys and girls (p>0.05). In general, the boys showed increase in strength, especially for the upper limb muscle groups, starting at age 10. For the girls, it was possible to observe a small variation in strength across age. Comparing the sexes, boys ages 14 and 15 showed a significant increase in IMS for shoulder abductors, flexors and elbow extensors, and knee flexors, when compared to the girls of the same age group (p<0.05).
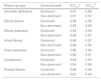
Inter-rater reliability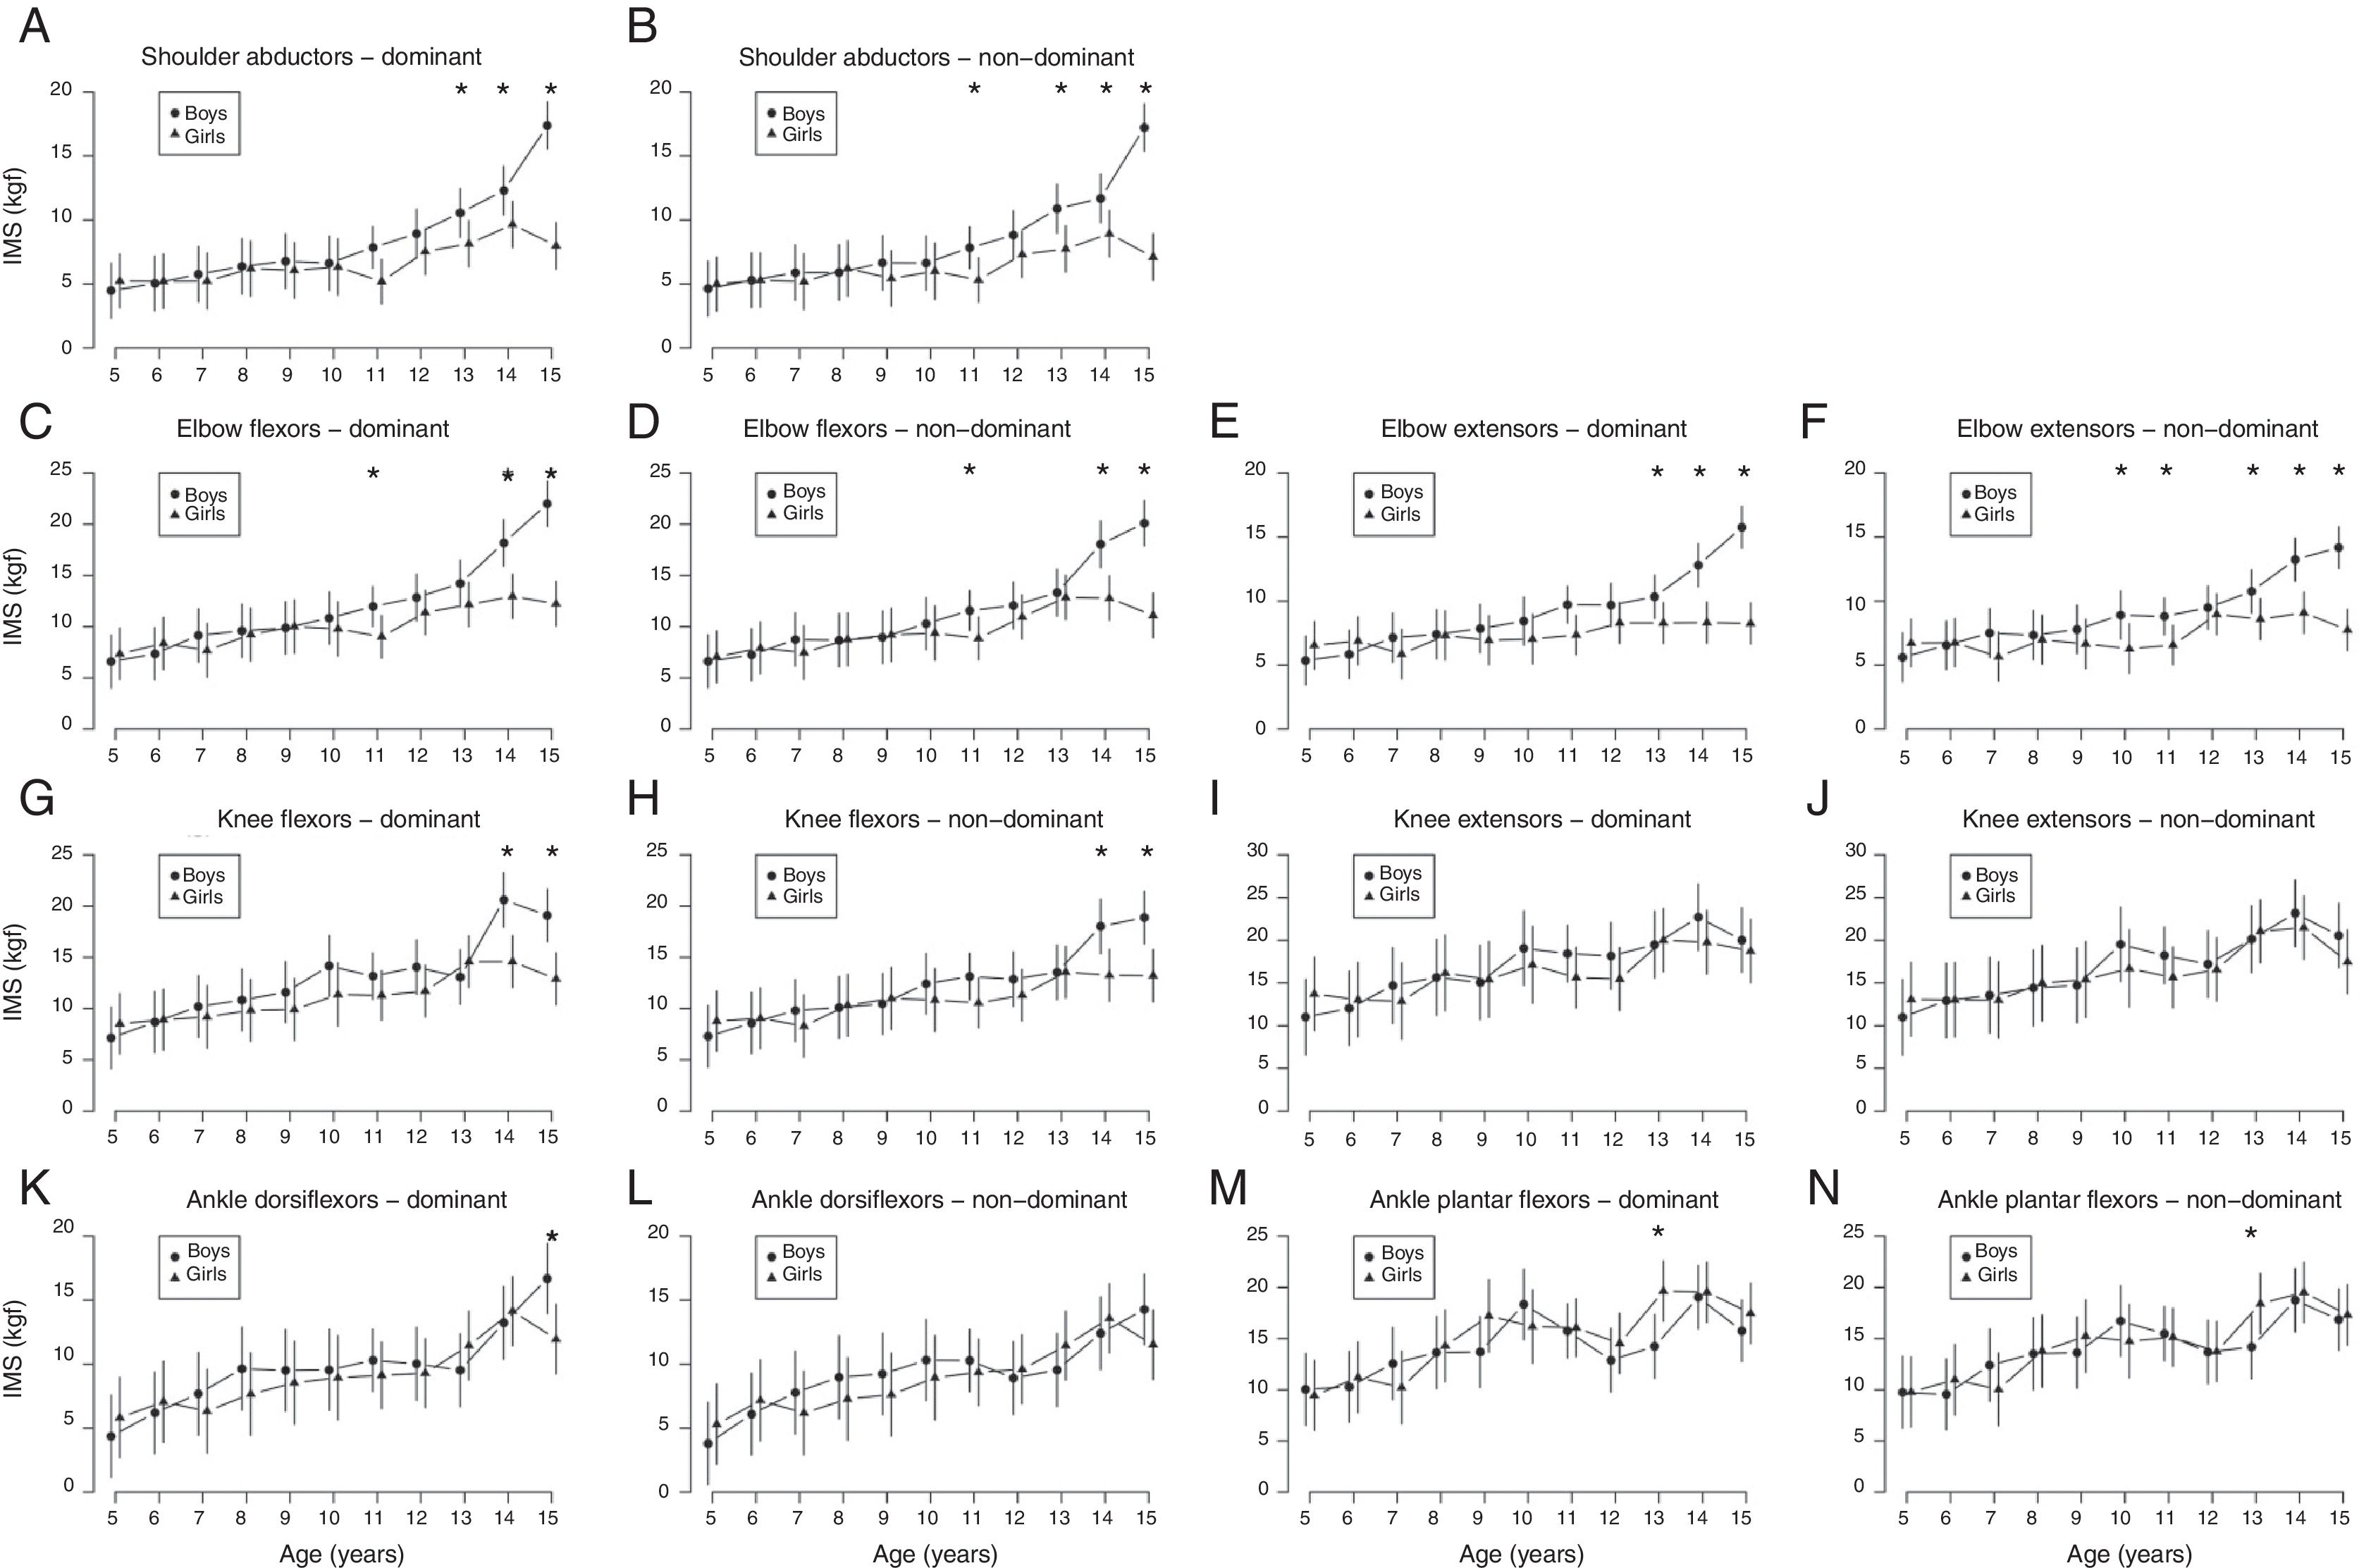
Table 3 shows the ICC values, following Shrout and Fleiss.24 Using the reliability graduation proposed by Landis and Koch,23 it is possible to observe excellent inter-rater reliability (>0.88) for all muscle groups tested, both on the dominant and non-dominant sides, except for elbow extensors, which presented lower reliability (0.63) on the dominant side.
Inter-rater reliability considering the different muscle groups analyzed bilaterally.
| Muscle groups | Dominant side | ICC2,1a | ICC3,1b |
|---|---|---|---|
| Shoulder abductors | Dominant | 0.97 | 0.98 |
| Non-dominant | 0.97 | 0.97 | |
| Elbow flexors | Dominant | 0.98 | 0.98 |
| Non-dominant | 0.98 | 0.98 | |
| Elbow extensors | Dominant | 0.63 | 0.64 |
| Non-dominant | 0.94 | 0.97 | |
| Knee flexors | Dominant | 0.96 | 0.97 |
| Non-dominant | 0.96 | 0.96 | |
| Knee extensors | Dominant | 0.96 | 0.96 |
| Non-dominant | 0.96 | 0.97 | |
| Dorsiflexors | Dominant | 0.94 | 0.95 |
| Non-dominant | 0.94 | 0.95 | |
| Plantar flexors | Dominant | 0.88 | 0.95 |
| non-dominant | 0.91 | 0.94 | |
Subtitle: ICC, intraclass correlation coefficient.
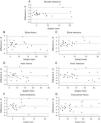
Intra-rater reliability (Bland–Altman plot) is shown in Fig. 2. The results obtained in the intra-rater analysis showed a mean bias between the first and second evaluations of 0.12, for shoulder abductors, 0.04 for elbow flexors, 0.55 for elbow extensors, 0.12 for knee flexors, 0.002 for knee extensors, 0.41 for dorsiflexors and 0.37 for plantar flexors. For the upper limb muscle groups, the analysis indicated little dispersion, considering the y axis, and low variation in the error of the measurements, according to the lower mean displacement of the values A and B (ΔA–B). In the lower limb, a larger dispersion was observed for knee extensors and plantar flexors.
Association between the IMS and maturational level, physical activity level and dominant side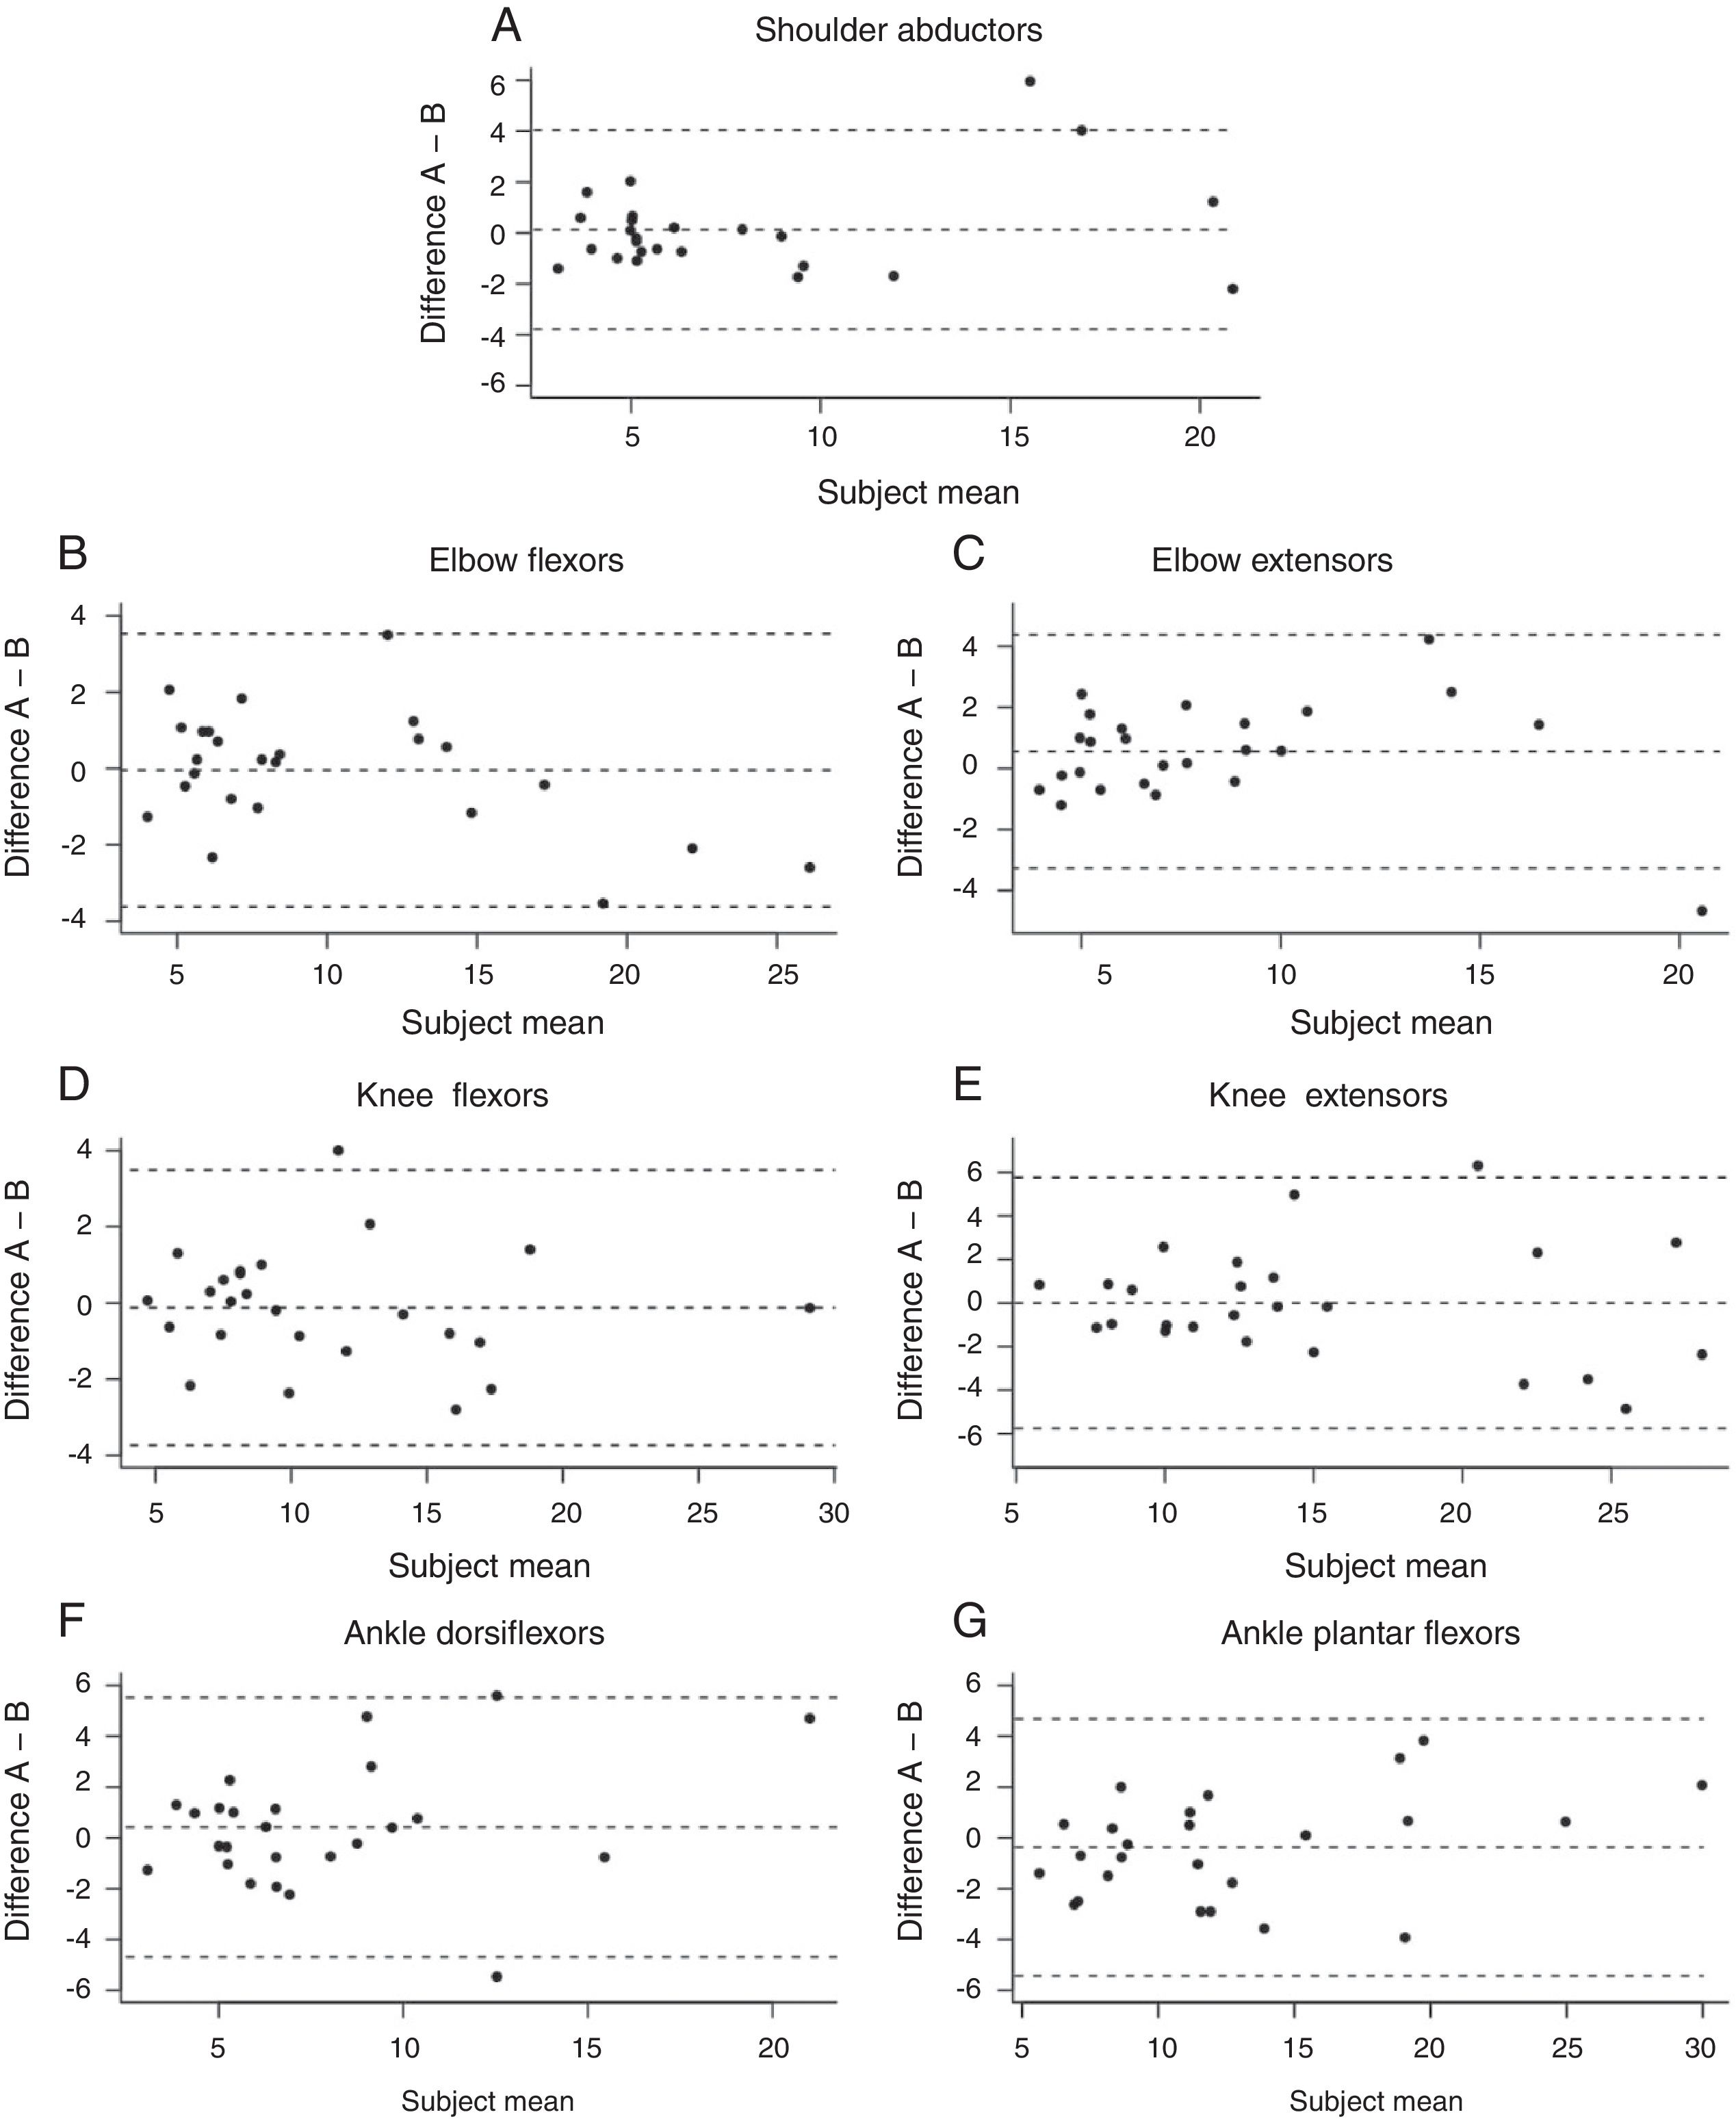
The association analysis between the IMS and maturational level did not indicate a significant difference between pre-puberty vs. puberty, and between IMS vs. physical activity level. No difference was observed between the sedentary vs. insufficiently active and sedentary vs. active (p>0.05) for all muscle groups, except dorsiflexors (p<0.01). A significant difference was observed between IMS and dominant side for all muscle groups, except for elbow extensors and knee extensors (p=0.20, p=0.87, respectively).
DiscussionThis study presents normative data of isometric muscular strength in 7 muscle groups, during development, for boys and girls aged between 5 and 15 years. These muscle groups were selected due to the fact that they are the main muscles evaluated in pediatric clinical practice and, to encourage participant adherence to the study. We observed an increase in IMS around 10 years of age, corroborating the studies of Hébert et al.,2 and Soliman et al.25 When we evaluated the sexes separately, we were able to identify a greater increase in IMS for boys, ages 14 and 15. Authors from other countries describe that this difference in IMS between sexes also occurs around the age of 13.7,8 Studies in the literature show that muscular performance depends on body size and proportion, changes in muscle mass, fiber types and development of neuromotor control.26 The development of muscle strength across age, is influenced by cross-sectional area of the muscles,27 distribution and diameter of fiber types,28 central nervous system maturation29 and testosterone androgenic concentrations.30
For the Brazilian population, Mattiello-Sverzut et al. studied the diameter of the biceps muscle fibers of healthy women and men, aged 13–84 years.31 They concluded that from the age of 13 on, boys presented a growing curve with increased diameter of oxidative and glycolytic fibers up to about 30 years, and that girls did not show an increase in the diameter of the fibers across age. Although in this study the muscular morphology was not analyzed, it is possible to observe a correlation between the morphometric aspects of the fiber types and the strength development, at least for the elbow flexors (muscle investigated by the authors) in the Brazilian population.
The acquisition of the IMS with the HHD followed a Stratford and Balsor's description, when an individual is asked to apply maximal strength against the HHD, which is positioned rigidly and perpendicular to the body segment.32 This method is called the “do method” and has provided accurate measurements of isometric muscle strength.33 This same methodology was used by other authors to evaluate reliability in children with cerebral palsy, aged 7–13 years, in athletes and in young adults.3,4,34,35 These authors used stabilization belts to help with positioning. Although the present study did not use stabilization of the limbs with belts to perform the test, it was possible to obtain satisfactory reliability results that are discussed below.
Inter and intra-rater reliability studies using the HHD in healthy children and adolescents are few.34,36,37 According to the classification proposed by Landis and Koch,23 the results of the present study indicated excellent inter-rater reliability for all muscle groups tested, both on the dominant and non-dominant sides (except for the elbow extensors, dominant side, which showed good reliability). Hebert et al.2 observed good and excellent inter-rater reliability using the HHD in children and adolescents 4–17 years of age. For the analysis of intra-rater agreement, data obtained from different studies demonstrated that the HHD is reliable.2,34,37 These studies were performed with volunteers of different age groups (children and adults), test procedures, health status, disease and associated comorbidities (such as spinal amyotrophy or female athletes), reinforcing the idea that it can be used to monitor clinical evolution, under different conditions, times and therapies.
IMS association with sexual maturation did not indicate a significant difference between pre-puberty vs. puberty. We also did not observe an association between IMS and level of physical activity. In both cases, we expected to find a positive association with IMS, pubertal having stronger IMS, when compared to pre-pubertal, as reported by Ré,38 and the active subjects showing greater strength, when compared to sedentary subjects. Although the tests we chose are widely used in the scientific literature, maturational classification is based only on verbal information. According to a study by Lee et al.,39 IPAQ may not refer exactly to physical activity level. Hagströmer et al.40 studied the validity of IPAQ in adolescents aged 12–17 years and reported reasonable validity for the ages of 12–14, and low validity between the ages of 15 and 17. Currently, the scientific literature has other scales to assess the degree of physical activity that could be more appropriate to the reality of the subjects interviewed.41 On the other hand, the association between IMS and dominance showed that the dominant side is stronger than the non-dominant side (except for elbow extensors and knee extensors). This predominance of strength on the dominant side was also observed, as a response to hand grip by the bulb dynamometer, in Brazilian children and adolescents.13
This study is not without limitations: (a) children and adolescents were recruited through convenience sampling methods and only from the city of Ribeirão Preto (Sao Paulo State); (b) the majority of the volunteers belonged to private schools. In the future, the influence of socioeconomic and cultural factors on muscle strength of children and adolescents should be investigated. Others instruments that can assess sexual maturation and level of physical activity should be used to investigate any association of these factors with muscle strength.
ConclusionThis study demonstrates that boys develop more pronounced isometric muscular strength starting at 10 years of age and it peaks at 14 and 15. The girls present lower isometric strength, when compared to the boys, mainly starting at 10 years of age. The development of muscle strength for the Brazilian population is similar to that observed in the Northern Hemisphere. Furthermore, the Handheld dynamometer can be widely used in clinical practice by different raters, in several evaluations, for different muscular groups, covering an extensive age range.
FundingThis work was funded by the Fundação de Amparo à Pesquisa do Estado de São Paulo (FAPESP) [grant numbers 2014/23232-7].
Conflicts of interestThe authors declare no conflicts of interest.
The authors wish to thank the volunteers who participated in this study and their caregivers, and the schools and ONG's for providing the space for data collection. The authors also wish to thank Fundação de Amparo à Pesquisa do Estado de São Paulo (FAPESP) for financial support. ACM-S is the recipient of a Research Productivity Funding (CNPq).
| Dominant side | Non dominant side | |||||||
|---|---|---|---|---|---|---|---|---|
| Male | Female | Male | Female | |||||
| Age (years) | Mean | CI (95%) | Mean | CI (95%) | Mean | CI (95%) | Mean | CI (95%) |
| Shoulder abductors | ||||||||
| 5 | 4.48 | (2.3–6.6) | 5.23 | (3.1–7.3) | 4.64 | (2.5–6.8) | 4.98 | (2.9–7.1) |
| 6 | 5.04 | (2.9–7.2) | 5.20 | (3.1–7.3) | 5.29 | (3.1–7.4) | 5.30 | (3.1–7.4) |
| 7 | 5.76 | (3.6–7.9) | 5.23 | (3.0–7.4) | 5.89 | (3.7–8.0) | 5.18 | (3.0–7.4) |
| 8 | 6.37 | (4.2–8.5) | 6.20 | (4.0–8.4) | 5.89 | (3.7–8.8) | 6.21 | (4.0–8.4) |
| 9 | 6.78 | (4.6–8.9) | 6.06 | (3.9–8.2) | 6.66 | (4.5–8.8) | 5.43 | (3.2–7.6) |
| 10 | 6.62 | (4.5–8.7) | 6.33 | (4.1–8.5) | 6.64 | (4.5–8.7) | 5.99 | (3.8–8.2) |
| 11 | 7.85 | (6.2–9.5) | 5.18 | (3.4–6.9) | 7.82 | (6.2–9.4) | 5.31 | (3.6–7.0) |
| 12 | 8.93 | (7.0–10.8) | 7.54 | (5.7–9.3) | 8.82 | (6.9–10.7) | 7.31 | (5.5–9.1) |
| 13 | 10.55 | (8.6–12.5) | 8.13 | (6.3–9.9) | 10.88 | (8.9–12.8) | 7.73 | (5.9–9.5) |
| 14 | 12.30 | (10.4–14.2) | 9.65 | (7.8–11.4) | 11.69 | (9.8–13.6) | 8.93 | (7.1–10.8) |
| 15 | 17.37 | (15.5–19.2) | 7.98 | (6.1–9.8) | 17.22 | (15.3–19.0) | 7.10 | (5.3–8.9) |
| Elbow flexors | ||||||||
| 5 | 6.59 | (4.0–9.2) | 7.35 | (4.8–9.9) | 6.61 | (4.0–9.2) | 7.04 | (4.5–9.6) |
| 6 | 7.35 | (4.8–9.9) | 8.36 | (5.8–10.9) | 7.24 | (4.7–9.8) | 7.92 | (5.3–10.5) |
| 7 | 9.14 | (6.5–11.7) | 7.68 | (5.0–10.3) | 8.74 | (6.1–11.3) | 7.46 | (4.8–10.1) |
| 8 | 9.60 | (6.9–12.2) | 9.24 | (6.6–11.8) | 8.67 | (6.1–11.3) | 8.75 | (6.1–11.3) |
| 9 | 9.88 | (7.31–12.4) | 10.01 | (7.4–12.6) | 8.96 | (6.4–11.5) | 9.20 | (6.6–11.8) |
| 10 | 10.83 | (8.3–13.4) | 9.79 | (7.1–12.4) | 10.30 | (7.7–12.8) | 9.37 | (6.7–12.0) |
| 11 | 11.97 | (10.0–13.9) | 9.01 | (6.9–11.1) | 11.57 | (9.6–13.5) | 8.86 | (6.8–10.9) |
| 12 | 12.84 | (10.5–15.1) | 11.39 | (9.2–13.5) | 12.07 | (9.8–14.3) | 10.94 | (8.8–13.1) |
| 13 | 14.22 | (11.9–16.5) | 12.16 | (10.0–14.3) | 13.32 | (11.0–15.6) | 12.8 | (10.7–15.0) |
| 14 | 18.19 | (15.9–20.5) | 12.96 | (10.8–15.1) | 18.04 | (15.7–20.3) | 12.79 | (10.6–14.9) |
| 15 | 6.59 | (4.0–9.2) | 7.35 | (4.8–9.9) | 20.10 | (17.9–22.3) | 11.09 | (8.9–13.3) |
| Elbow extensors | ||||||||
| 5 | 5.35 | (3.4–7.3) | 6.54 | (4.7–8.4) | 5.60 | (3.7–7.5) | 6.72 | (4.8–8.5) |
| 6 | 5.83 | (3.9–7.7) | 6.89 | (5.0–8.8) | 6.54 | (4.6–8.4) | 6.74 | (4.8–8.6) |
| 7 | 7.14 | (5.2–9.0) | 5.86 | (3.9–7.8) | 7.50 | (5.6–9.4) | 5.65 | (3.7–7.6) |
| 8 | 7.40 | (5.4–9.3) | 7.31 | (5.4–9.2) | 7.33 | (5.4–9.2) | 6.98 | (5.0–8.9) |
| 9 | 7.85 | (5.9–9.7) | 6.94 | (5.0–8.8) | 7.78 | (5.9–9.7) | 6.65 | (4.7–8.6) |
| 10 | 8.43 | (6.5–10.4) | 7.03 | (5.1–9.0) | 8.90 | (7.0–10.8) | 6.28 | (4.3–8.2) |
| 11 | 9.72 | (8.3–11.1) | 7.35 | (5.8–8.9) | 8.80 | (7.3–10.2) | 6.55 | (5.0–8.1) |
| 12 | 9.69 | (8.0–11.4) | 8.29 | (6.7–9.9) | 9.48 | (7.8–11.8) | 8.97 | (7.3–10.5) |
| 13 | 10.33 | (8.6–12.0) | 8.29 | (6.7–9.9) | 10.75 | (9.0–12.4) | 8.58 | (7.0–10.2) |
| 14 | 12.80 | (11.1–14.5) | 8.32 | (6.0–9.9) | 13.24 | (11.5–14.9) | 9.08 | (7.4–10.7) |
| 15 | 15.76 | (14.1–17.4) | 8.26 | (6.6–9.9) | 14.18 | (12.5–15.8) | 7.74 | (6.1–9.3) |
| Knee flexors | ||||||||
| 5 | 7.14 | (4.1–10.1) | 8.52 | (5.6–11.4) | 7.28 | (4.2–10.3) | 8.76 | (5.8–11.7) |
| 6 | 8.67 | (5.7–11.6) | 8.90 | (5.9–11.9) | 8.59 | (5.60–11.6) | 9.06 | (6.1–12.0) |
| 7 | 10.19 | (7.1–13.2) | 9.19 | (6.1–12.2) | 9.81 | (6.8–12.8) | 8.29 | (5.2–11.3) |
| 8 | 10.84 | (7.8–13.8) | 9.83 | (6.8–12.8) | 10.10 | (7.0–13.1) | 10.32 | (7.3–13.3) |
| 9 | 11.59 | (8.6–14.6) | 9.91 | (6.9–12.9) | 10.45 | (7.5–13.4) | 10.99 | (7.9–14.0) |
| 10 | 14.16 | (11. 2–17.1) | 11.37 | (8.3–14.4) | 12.42 | (9.4–15.4) | 10.83 | (7.7–13.9) |
| 11 | 13.17 | (10.9–15.4) | 11.28 | (8.8–13.7) | 13.13 | (10.8–15.4) | 10.56 | (8.1–12.9) |
| 12 | 14.04 | (11.4–16.7) | 11.70 | (9.2–14.2) | 12.87 | (10.2–15.5) | 11.31 | (8.8–13.8) |
| 13 | 13.07 | (10.4–15.7) | 14.57 | (12.0–17.1) | 13.54 | (10.8–16.2) | 13.56 | (11.0–16.0) |
| 14 | 20.60 | (17.9–23.2) | 14.57 | (12.0–17.1) | 18.02 | (15.3–20.7) | 13.25 | (10.7–15.8) |
| 15 | 19.09 | (16.51–21.6) | 12.90 | (10.3–15.4) | 18.89 | (16.3–21.4) | 13.21 | (10.6–15.7) |
| Knee extensors | ||||||||
| 5 | 11.06 | (6.6–15.4) | 13.71 | (9.4–18.0) | 10.98 | (6.5–15.4) | 13.08 | (8.7–17.4) |
| 6 | 12.01 | (7.6–16.4) | 13.04 | (8.7–17.4) | 12.93 | (8.5–17.3) | 13.02 | (8.6–17.4) |
| 7 | 14.70 | (10.2–19.1) | 12.85 | (8.4–17.3) | 13.55 | (9.1–17.9) | 12.99 | (8.5–17.5) |
| 8 | 15.65 | (11.2–20.1) | 16.16 | (11.7–20.6) | 14.41 | (9.9–18.8) | 14.97 | (10.5–19.4) |
| 9 | 15.06 | (10.7–19.4) | 15.41 | (10.9–19.9) | 14.71 | (10.3–19.1) | 15.40 | (10.9–19.8) |
| 10 | 19.07 | (14.7–23.4) | 17.13 | (12.6–21.6) | 19.52 | (15.1–23.9) | 16.69 | (12.1–21.2) |
| 11 | 18.44 | (15.1–21.8) | 15.62 | (12.0–19.2) | 18.22 | (14.9–21.5) | 15.65 | (12.0–19.2) |
| 12 | 18.16 | (14.2–22.0) | 15.45 | (11.7–19.1) | 17.20 | (13.3–21.1) | 16.57 | (12.9–20.3) |
| 13 | 19.48 | (15.5–23.4) | 20.00 | (16.3–23.7) | 20.13 | (16.2–24.0) | 21.04 | (17.3–24.7) |
| 14 | 22.69 | (18.8–26.6) | 19.76 | (16.0–23.5) | 23.16 | (19.2–27.0) | 21.47 | (17.7–25.2) |
| 15 | 20.02 | (16.2–23.8) | 18.74 | (15.0–22.5) | 20.55 | (16.8–24.3) | 17.47 | (13.7–21.2) |
| Dorsiflexors | ||||||||
| 5 | 4.36 | (1.1–7.6) | 5.82 | (2.7–8.9) | 3.79 | (0.5–7.0) | 5.30 | (2.1–8.4) |
| 6 | 6.20 | (3.0–9.4) | 7.06 | (3.9–10.2) | 6.10 | (2.9–9.3) | 7.17 | (3.9–10.3) |
| 7 | 7.68 | (4.4–10.9) | 6.33 | (3.0–9.6) | 7.78 | (4.5–11.0) | 6.18 | (2.9–9.4) |
| 8 | 9.64 | (6.4–12.9) | 7.67 | (4.4–10.9) | 8.98 | (5.7–12.2) | 7.28 | (4.0–10.5) |
| 9 | 9.51 | (6.3–12.7) | 8.54 | (5.3–11.8) | 9.23 | (6.0–12.4) | 7.62 | (4.4–10.9) |
| 10 | 9.55 | (6.4–12.7) | 8.94 | (5.6–12.2) | 10.31 | (7.1–13.5) | 8.94 | (5.6–12.2) |
| 11 | 10.30 | (7.9–12.7) | 9.12 | (6.5–11.7) | 10.28 | (7.8–12.7) | 9.37 | (6.7–11.9) |
| 12 | 10.02 | (7.2–12.9) | 9.30 | (6.6–12.0) | 8.91 | (6.0–11.7) | 9.60 | (6.9–12.3) |
| 13 | 9.53 | (6.7–12.3) | 11.46 | (8.7–4.1) | 9.55 | (6.7–12.4) | 11.45 | (8.7–14.1) |
| 14 | 13.22 | (10.4–16.1) | 14.14 | (11.4–16.8) | 12.41 | (9.5–15.2) | 13.58 | (10.9–16.3) |
| 15 | 16.69 | (13.9–19.4) | 11.95 | (9.2–14.7) | 14.26 | (11.5–17.0) | 11.52 | (8.8–14.2) |
| Plantar flexors | ||||||||
| 5 | 10.04 | (6.5–13.5) | 9.45 | (6.0–12.9) | 9.75 | (6.2–13.2) | 9.78 | (6.3–13.2) |
| 6 | 10.29 | (6.8–13.7) | 11.20 | (7.7–14.7) | 9.54 | (6.0–13.0) | 10.97 | (7.5–14.4) |
| 7 | 12.56 | (9.0–16.1) | 10.22 | (6.6–13.8) | 12.40 | (8.9–15.9) | 10.04 | (6.5–13.6) |
| 8 | 13.64 | (10.1–17.2) | 14.29 | (10.8–17.8) | 13.51 | (9.9–17.0) | 13.76 | (10.2–17.3) |
| 9 | 13.68 | (10.2–17.1) | 17.21 | (13.7–20.7) | 13.62 | (10.1–17.1) | 15.23 | (11.7–18.7) |
| 10 | 18.33 | (14.9–21.8) | 16.18 | (12.6–19.8) | 16.71 | (13.2–20.1) | 14.75 | (11.1–18.3) |
| 11 | 15.74 | (13.1–18.4) | 16.05 | (13.2–18.9) | 15.47 | (12.8–18.1) | 15.12 | (12.3–17.9) |
| 12 | 12.89 | (9.8–16.0) | 14.52 | (11.6–17.4) | 13.67 | (10.5–16.8) | 13.73 | (10.8–16.6) |
| 13 | 14.23 | (11.1–17.3) | 19.63 | (16.7–22.6) | 14.18 | (11.0–17.3) | 18.40 | (15.4–21.3) |
| 14 | 19.03 | (15.9–22.1) | 19.52 | (16.5–22.5) | 18.73 | (15.6–21.8) | 19.51 | (16.5–22.4) |
| 15 | 15.75 | (12.7–18.7) | 17.47 | (14.5–20.4) | 16.85 | (13.8–19.8) | 17.31 | (14.3–20.3) |
Subtitle: CI, confidence interval.