


Pelvic floor muscle function has been shown to be inversely associated with pelvic organ prolapse in Western women, however differences have been documented between ethnic groups.
ObjectiveTo determine if pelvic floor muscle strength and thickness and hiatal area are associated with pelvic organ prolapse in Nepali women.
MethodsThis cross-sectional study included non-pregnant Nepali women ≥18 years attending an outpatient gynecology clinic in Kathmandu, Nepal. A clinical examination included the pelvic organ prolapse quantification (POP-Q)- system examination and Modified Oxford Scale. Puborectalis muscle thickness and hiatal area were assessed using 3D/4D translabial ultrasound. Statistical analysis included Pearson's correlation and multiple regression (p<0.05).
ResultsOf the 123 women; 14 (11%) had POP-Q stage 0 prolapse, 29 (24%) stage I, 69 (56%) stage II, 8 (7%) stage III, and 3 (2%) stage IV. Mean±SD Modified Oxford Scale was 3.37±0.48 and muscle thickness was 1.14±0.21cm, hiatal area at rest was 14.67±3.11cm2 and on contraction was 11.29±2.51cm2. No associations were found between pelvic floor muscle strength or thickness and POP-Q stages 0–IV. There was a positive correlation found between hiatal area at rest and pelvic organ prolapse stage (r=0.34, p<0.001)and hiatal area on contraction and prolapse stage (r=0.30, p<0.001) and a negative correlation between pelvic floor muscle strength and hiatal area on contraction (r=−0.36, p<0.001).
ConclusionIn contrast to previous findings, pelvic floor muscle strength and thickness are not associated with pelvic organ prolapse in this sample of Nepali women. It is important to consider these findings when developing pelvic organ prolapse treatment and management strategies in this population.
The pelvic floor muscles (PFMs) play an important role in providing pelvic organ support and maintaining urinary and fecal continence.1 The levator hiatus is the largest hernia portal in the human body and pelvic organ prolapse (POP) occurs through this portal.2 One of the key PFMs of the levator hiatus is the puborectalis.2 A normal puborectalis muscle contraction creates a controlled narrowing of the hiatal area (HA) in a ventrocephalad direction resisting downward pressure of the pelvic organs with any increase in intra-abdominal pressure.1,2 Having thicker and stronger PFMs is thought to provide more support to the pelvic organs reducing the risk of developing a POP.3
A comprehensive assessment of the pelvic floor plays an important role in the diagnosis and treatment of pelvic floor dysfunction. There are various ways of assessing PFM strength and function including digital palpation, manometry, and 3D/4D translabial ultrasound (TLUS).1 Digital palpation assesses the squeeze pressure or strength of the puborectalis muscle around the clinician's finger and can be quantified using the Modified Oxford Scale (MOS).4 Furthermore, digital palpation provides evaluation of the quality and direction of the contraction allowing immediate verbal and tactile biofeedback assisting the woman to consciously contract the muscles.5,6 Incorporating TLUS allows further analysis of functional PFM anatomy including assessment of levator avulsion, HA, and puborectalis muscle thickness.7,8 Translabial ultrasound has become widely utilized as an effective tool for health professionals to assess the pelvic floor functional anatomy.2
However, the etiology of POP is complex and multifactorial, and recent evidence suggests ethnicity may well be an important factor.9,10 A study comparing East Asian women to Caucasians found the former had a smaller HA and thicker puborectalis muscle.9 Shek et al.10 found that Ugandan women have an increased HA and greater pelvic organ descent compared to Caucasians although muscle thickness was similar between the two groups.10 Nepali women appear to have a lower rate of levator avulsion and obstetric anal sphincter tears and a higher rate of uterine retroversion when compared to other populations.11,12 These differences are important to consider when determining the most appropriate treatment option for women.
Previous studies have shown that PFM strength, puborectalis muscle thickness, and HA are associated with POP in various populations.13–15 Women with a significant POP, i.e. symptomatic POP, are more likely to have weaker and thinner PFMs and a larger HA compared to women with no or mild POP.13–18 Due to the high prevalence of POP in Nepali women and the differences previously documented in their functional anatomy, we sought to explore the association between PFM strength, puborectalis muscle thickness, and HA with POP stages 0–IV.
MethodsThis cross-sectional study is a secondary analysis of data collected over a 3-week period in November 2016. As per previously published cross-sectional studies with a similar sample size, this study analyzed stored imaging data.7,8,17–19 Participants included nonpregnant women 18 years or over consecutively attending the outpatient gynecology clinic at Kathmandu Model Hospital. Exclusion criteria included women with a history of previous gynecological surgery and those unable to complete the questionnaire or follow instructions due to cognitive or language deficits.
After informed consent was obtained, the women completed an interview with a Nepali intern, who recorded demographic information and medical and obstetric history. This included the participants’ general background and demographic data, chief complaints, medical history, and obstetric and gynecological history. Following this, all pelvic examinations were performed by the same examiner who is an experienced gynecologist with >5 years experience and was blinded to the demographic and clinical data at the time of the examination.
Participants were instructed to empty their bladder prior to the assessment and all examinations were performed in the dorsal lithotomy position. Vaginal examination included the validated pelvic organ prolapse quantification (POP-Q) system performed on maximum Valsalva and MOS to assess PFM strength.1,18,20 There are five stages in the POP-Q system from 0 to IV, where 0=no prolapse to stage IV=complete eversion of the total length of the vagina.20
PFM strength on digital palpation was assessed using the MOS where the index finger is placed into the vagina to palpate the puborectalis muscle during maximal contraction.18,21 The MOS is a validated 6-point scale that rates the PFM contraction from 0 to 5: 0=no contraction, 1=minor flicker, 2=weak contraction, 3=moderate contraction, 4=good contraction, and 5=strong contraction.18,21 Half grades are permitted, for example a grade of 3+ is translated as being more than a moderate contraction (grade 3) but less than a good contraction (grade 4), as described by Laycock and Jerwood.18 Muscle strength was calculated as the mean score of three maximal voluntary contractions and a minimum of 4s rest was allowed between attempts.13,18,21 The MOS strongly correlates with perineometry and translabial ultrasound as a reliable way to measure PFM strength.21 A maximal PFM contraction was achieved by asking the participant to squeeze as firmly as possible around the examiner's finger as though they are trying to stop passing gas.21 Additional coaching was given if the woman was unable to correctly squeeze their muscles or displayed co-contraction of other muscles, breath holding, or a bearing down action.22
Three/4D translabial ultrasound was performed using a 4D GE Voluson-i System (GE Medical Systems, Zipf, Austria), with an 8–4MHz curved array volume transducer. As previously described, volumes were acquired in the midsagittal plane at rest and set to an acquisition angle of 85° for the maximum PFM contraction and at least two volumes were acquired for the contraction.11,12 The intra-class correlation coefficient values for HA and puborectalis muscle thickness show very good agreement between 3/4D translabial ultrasound and magnetic resonance imaging (MRI) measurements.2 Post imaging analysis of HA and puborectalis muscle thickness were performed by the first author using proprietary software at a later date, while blinded to all other data. All analyses were conducted in the plane of minimal hiatal dimensions.16 The HA is bordered by the puborectalis muscle, the symphysis pubis, and the inferior pubic ramus (Fig. 1).2 Puborectalis muscle thickness was measured as described by Dietz et al. at two points posterolateral to the vagina and rectum bilaterally, in the plane of the maximal puborectalis muscle thickness (Fig. 1).16 The mean of the four measurements was used for statistical analysis.17
 and four measurement sites of puborectalis muscle thickness (PRMT).")
Statistical analysis was performed using SPSS version 24 (SPSS, Chicago, IL). We assessed the association between puborectalis muscle thickness and strength and muscle strength and HA at maximal contraction. Additionally, we assessed any association between muscle thickness, strength, and HA with POP-Q stages 0–IV. All associations were investigated using Pearson's correlation coefficient and p-values of <0.05 were considered significant. Separate multiple regression analyses were performed to assess the relationship between POP stage and the outcome variables PFM thickness, MOS, and HA adjusting for age, parity, and body mass index (BMI). POP stage was analyzed as a categorical variable while the others were continuous. Ethics approval was granted by the Institutional Review Committee (IRC) of the Public Health Concern Trust Nepal, Kathmandu, Nepal letter dated June 16, 2016.
ResultsA total of 129 women were seen in the clinic during the inclusion period and six were excluded due to previous pelvic surgery or being unable to complete the questionnaire or assessment due to cognitive or literacy deficiencies. Of the 123 women assessed; mean±SD age was 39±10.2 years, BMI 26±4.37kg/m2 and median parity was two (range 0–9) (Table 1). Three (2%) women were nulliparous, two (1.6%) had unilateral avulsions, two (1.6%) had anal sphincter tears, and there were no instrumental or operative deliveries. There were 14 (11%) women with no POP, 29 (24%) women with POP-Q stage I, 69 (56%) with stage II, 8 (7%) with stage III, and 3 (2%) with stage IV. The mean MOS, PFM thickness, and HA by POP-Q stage 0–IV is presented in Table 2.
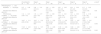
Characteristics of participants by pelvic organ prolapse quantification (POP-Q) system.
| All participants (n=123) | Stage 0 (n=14) | Stage I (n=29) | Stage II (n=69) | Stage III (n=8) | Stage IV (n=3) | |
|---|---|---|---|---|---|---|
| Age (years)Mean±SD | 39±10.03 | 36±10.05 | 37±10.09 | 39±9.56 | 46±12.88 | 43±5.03 |
| BMI (kg/m2)Mean±SD | 26±4.38 | 23±3.42 | 26±4.50 | 26±4.48 | 24±2.91 | 29±5.02 |
| ParityMedian (range) | 2 (0–9) | 2 (0–4) | 2 (0–9) | 3 (0–8) | 3 (2–6) | 4 (3–5) |
| Vaginally nulliparousN (%) | 17 (14%) | 5 (36%) | 1 (3%) | 6 (9%) | 0 (0%) | 0 (0%) |
| MenopausalN (%) | 19 (15%) | 4 (3%) | 3 (10%) | 9 (13%) | 2 (25%) | 1 (33%) |
Pelvic floor muscle (PFM) functional anatomy by pelvic organ prolapse quantification (POP-Q) system.
| All participants (N=121) | Stage 0 (n=14) | Stage I (n=29) | Stage II (n=69) | Stage III (n=8) | Stage IV (n=3) | p-valuea | |
|---|---|---|---|---|---|---|---|
| PFM strength (N=123) | |||||||
| MOSMean±SD(range) | 3.37±0.48 (2.0–4.5) | 3.34±0.41 (2.5–4.0) | 3.44±0.53 (2.5–4.5) | 3.35±0.48 (2.0–4.0) | 3.34±0.48 (2.5–4.0) | 3.17±0.29 (3.0–3.5) | |
| Adjusted mean difference (95% CI)** | REF | 0.11 (−0.22, 0.45) | 0.02 (−0.28, 0.32) | 0.06 (−0.39, 0.50) | −0.16 (−0.80, 0.49) | 0.86 | |
| PFM thickness (cm)Mean±SD (range) | 1.14±0.21 (0.65–1.79) | 1.15±0.17 (0.91–1.50) | 1.17±0.20 (0.84–1.56) | 1.11±0.21 (0.65–1.59) | 1.21±0.30 (0.72–1.79) | 1.18±0.18 (1.04–1.38) | |
| Adjusted mean difference (95% CI)b | REF | 0.03 (−0.11, 0.16) | −0.05 (−0.18, 0.8) | 0.04 (−0.15, 0.22) | −0.01 (−0.27, 0.26) | 0.46 | |
| HA at rest (cm2)Mean±SD (range) | 14.67±3.11 (8.35–27.09) | 12.67±1.93 (9.38–16.15) | 14.19±3.20 (8.35–20.94) | 14.71±2.61 (10.08–22.73) | 18.37±4.67 (12.69–27.09) | 16.52±5.07 (11.80–21.88) | |
| Adjusted mean difference (95% CI)b | REF | 1.57 (−0.45, 3.58) | 2.04 (0.21, 3.87) | 5.42 (2.72, 8.11) | 3.74 (−1.15, 7.63) | 0.003 | |
| HA at contraction (cm2)Mean±SD(range) | 11.29±2.51 (6.17–21.88) | 10.32±1.97 (7.34–13.42) | 11.09±2.85 (6.17–16.93) | 11.05±2.03 (6.94–15.55) | 13.60±2.09 (10.81–16.41) | 15.83±5.49 (11.17–21.88) | |
| Adjusted mean difference (95% CI)b | REF | 0.69 (−0.93, 2.32) | 0.59 (−0.88, 2.06) | 2.98 (0.81, 5.14) | 5.20 (2.08, 8.33) | 0.002 | |
PFM, pelvic floor muscle; MOS, Modified Oxford Scale; HA, hiatal area.
The ultrasound images for two women were excluded due to inadequate volumes for analysis. The following results pertain to the remaining 121 women; mean±SD puborectalis muscle thickness was 1.14±0.21cm. Mean±SD HA at rest was 14.67±3.11cm2 and during contraction 11.29±2.51cm2 (Table 2).
No association was found between PFM strength (MOS) and puborectalis muscle thickness. Additionally, muscle strength or puborectalis muscle thickness and POP stages 0–IV were not associated (Table 3). There was a significant positive association between POP-Q stage and HA at rest and contraction and a significant negative association between muscle strength and HA on contraction (Table 3). Multiple regression analysis found no difference between POP stages in the mean PFM strength and thickness after adjusting for age, parity, and BMI (Table 2). There was a difference between POP stages in the mean HA at rest (p=0.003) and contraction (p=0.002) after adjusting for age, parity, and BMI. The residuals from the regression analysis were normally distributed.
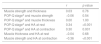
Pearson correlation to determine associations.
| r | p value | |
|---|---|---|
| Muscle strength and thickness | 0.03 | 0.76 |
| POP-Q stagea and muscle strength | −0.06 | 0.54 |
| POP-Q stagea and muscle thickness | 0.00 | 1.00 |
| POP-Q stagea and HA at rest | 0.34 | <0.001 |
| POP-Q stagea and HA at contraction | 0.30 | 0.001 |
| Muscle thickness and HA at rest | −0.04 | 0.68 |
| Muscle strength and HA at contraction | −0.36 | <0.001 |
In this sample of Nepali women, PFM strength or muscle thickness was not associated with POP and these findings are contrary to previous studies that reported a significant association in different populations of women.13,17
PFM strength has been found to be independently associated with POP, suggesting that having weaker muscles increases the risk of developing a POP by seven times (odds ratio [OR] 7.5; 95% CI 1.5, 36.4).13 One study found that in a group of women with pelvic floor disorders, most were unable to contract their PFMs correctly with their mean±SD MOS being 1.5±1.0 in contrast to the women in our group with a POP-Q stage I–IV who had a mean MOS of 3.33±0.48.23 It is important to note that most of the women in our study had a stage I and II POP and were younger in age compared to previously published studies on PFM strength and thickness and POP.13,15,22,23 Finding comparable studies using the same evaluation techniques with participants of a similar age is challenging because women with a symptomatic POP or pelvic floor disorders are typically older than our study population. However, a study by Bocardi et al.24 found no association between age and PFM strength highlighting the complex nature of pelvic floor function.24
The thickness of the puborectalis muscle appears to be associated with certain pelvic floor disorders.16,25 Bo et al. hypothesized that increased thickness and bulk of the PFMs provides a more supportive base for the pelvic organs placing them in a more elevated position inside the pelvis.3 Studies from the USA and Norway have shown that women with a POP or incontinence have thinner PFMs but similar to our results, Athanasiou also found no association between puborectalis muscle thickness and POP stage in British women.13,15,25 These results suggest PFM thickness may play a role in POP and incontinence severity in some women, but not all.
There is evidence suggesting that the greater the cross-sectional area of a muscle the stronger the voluntary concentric contraction.26 In regards to the PFMs, several Norwegian studies have demonstrated that PFM thickness and strength are positively associated, indicating that thicker muscles produce a stronger contraction.17,25,27 It is not clear why we did not find this association with the Nepali women in our study. However, this difference may relate to genetic variations in the morphology of the bony pelvis, connective tissue compliance, muscle positions within the pelvic cavity, or variations in the neurophysiological function of the muscles.3
HA may have a more important role in POP severity for our study population. Our results confirm previous findings that a larger HA is associated with POP and a stronger PFM contraction will more effectively constrict and narrow the HA.13,17,21 However, PFM strength and thickness were not related to POP in our group suggesting that the connective tissues and the passive supporting structures may be more significant in the etiology of POP for Nepali women. Further research is essential in exploring the role of pessaries and lifestyle strategies, such as managing constipation, chronic cough, and heavy lifting, in non-surgically managing symptomatic POP in this population.20,27
Assessing PFM strength and function is crucial in determining the best treatment option for women with a POP.28 The first line non-surgical treatment approach for POP is PFM training as this has been shown to increase the strength and thickness of the PFMs improving both symptoms and POP-Q stage.19,20,29,30 Braekken et al.19 found a PFM training intervention for women with stage I–III POP resulted in a significant increase in PFM thickness and reduction in HA.19 The participants’ mean PFM thickness and HA at baseline were 0.9cm and 23.7cm2, increasing to 1.05cm and decreasing to 22.2cm2 post-intervention, respectively. Another study assessed asymptomatic nulligravid Caucasian women (mean age 20.4 years) and found their mean puborectalis muscle thickness was 0.73cm and HA was 11.25cm2 at rest.16 The Nepali women in our study had thicker PFMs than the participants in both of these studies, a smaller HA than the women with a POP and on average moderate PFM strength. Therefore, we question whether a PFM training program offered to a population of Nepali women, with characteristics similar to the sample included in our study, would be effective at increasing PFM strength and thickness or reducing HA and POP-Q stage as reported in previous studies. This issue should be investigated in future high quality RCTs.
Ethnicity appears to play a role in some of the differences noted in PFM function and biometry between populations.9,10 Nepali women have one of the lowest recorded prevalence for levator avulsions and anal sphincter tears compared to other populations.12 There also appears to be a higher rate of uterine POP, uterine retroversion, and less frequent hiatal ballooning in this population.11 These findings suggest that a one fit all approach to management of POP is ineffective and insufficient for improving outcomes and providing better care to women suffering from this condition.
One of the strengths of this study is that it is the first to use 3D/4D TLUS to assess PFM thickness in this population. The results from our study also add to the growing body of evidence that ethnicity may play a role in PFM function and POP. Our study does have its limitations such as type II error, as the sample population in our study included women attending an outpatient gynecology clinic, so our findings may not be representative of the general population. Due to cultural limitations, assessment of nulliparous women is exceedingly difficult in this population, making it difficult to understand what would be considered normal PFM functional anatomy. Finally, the ability to draw direct comparisons with data obtained from Western populations is difficult due to inherent multiple potential confounders.
ConclusionNo association was found between PFM strength or thickness and POP stage in this sample of Nepali women.
Conflicts of interestThe authors declare no conflicts of interest.
The authors would like to thank Dr Ganesh Dangal and the staff at Kathmandu Model Hospital for their assistance and generosity in accommodating our research needs. We are especially grateful to Dr Vishal Kumar Trivedi for his tireless assistance during data collection. This work was supported by the Foundation of Research Support of the State of Sao Paulo – Brazil (FAPESP 2015/22521-8 and 2017/02565-6), Dr Albert S McKern Research Scholarship, National Health and Medical Research Council (of Australia) Career Development Fellowship #1087062 and unrestricted educational grants from GE Medical.


