
Differential diagnosis is a systematic process used to identify the proper diagnosis from a set of possible competing diagnoses.
MethodsThe goal of this masterclass is to discuss the higher order thinking components of differential diagnosis.
ConclusionsFor healthcare providers, diagnosis is one of many necessary components during the clinical decision making process and it is hallmarked by differentiation of competing structures for a definitive understanding of the underlying condition. The diagnostic process involves identifying or determining the etiology of a disease or condition through evaluation of patient history, physical examination, and review of laboratory data or diagnostic imaging; and the subsequent descriptive title of that finding. Whereas differential diagnosis is a varied skill set among all healthcare providers, the concept of a diagnosis is equally germane, regardless of one's background. In theory, a diagnosis improves the use of classification tools, improves clarity and communication, provides a trajectory of treatment, improves understanding of a person's prognosis, and in some cases, may be useful for preventative treatments. To achieve these improvements, one must have an understanding of relation of the clinical utility of tests and measures with diagnosis, and how to best implement these findings in clinical practice. This requires a deeper understanding (higher order thinking) of the role of diagnosis in the management of patients.
The diagnostic process involves identifying or determining the etiology of a disease or condition through evaluation of patient history, physical examination, and review of laboratory data or diagnostic imaging; and the subsequent descriptive title of that finding.1 Diagnoses are used to improve communication with patients, across providers, for payers, and with health systems. According to Walker,2 within 3000 years, there have been a number of crucial progressions that have shaped how diagnoses are used today. These include the use of a rational basis for establishing medicine as a profession, the development of equipment to aide in diagnosis, the use of autopsy for confirmation of diagnostic findings, the dissection of human bodies for educational purposes, the growth of physical and laboratory examination findings, and the classification of diagnostic commonalities.
In 1893, the first international classification edition, which was known as the International List of Causes of Death (ICD),3 was adopted by the International Statistical Institute. In May of 2018, the World Health Organization (WHO) released the 11th Revision to the ICD system. This system aims to homogenously define diseases, disorders, injuries and health conditions. The ICD classification organizes information into standard groupings of diseases, which allows for: easy storage, retrieval and analysis of health information for evidenced-based decision-making; sharing and comparing health information between hospitals, regions, settings and countries; and data comparisons in the same location across different time periods. Further, the coding system allows a higher level of specificity and clinical detail, improving the ability to document a patient encounter and compare outcomes at a larger, system-based level. At its core, the ICD diagnostic system improves communication among providers of healthcare and should be considered a minimum competency for healthcare diagnosticians.
Improved communication and a common language describing categories of diseases are a useful feature in differential diagnosis. However, understanding how to use the disease categories and recognizing the shortcomings of diagnostic labeling requires higher order thinking. Higher order thinking is posited on the concept that some forms of learning require greater cognitive processing and indirectly require different forms of learning beyond memorization, facts and, concepts. Higher order cognitive skills include conceptualization, analysis, and evaluation, and involves ordered levels of reasoning containing productive thinking, or reasoning, versus learned, or reproductive, thinking.4 Fundamental skills involved with higher order thinking includes analogical and logical reasoning.5 Analogical reasoning involves any type of thinking that relies upon an analogy and involves analyzing sameness. Logical reasoning involves drawing on prior knowledge to make inferences and solve problems. Critical thinking is a component of higher order thinking.
A basic understanding of diagnoses is a complex, iterative and necessary process. In this masterclass, we argue that higher order thinking goes well beyond memorization of tests and measures, sensitivity and specificity, and a laundry list of ICD-based diagnoses. Specifically, we argue that for higher order differential diagnostic reasoning, a clinician requires careful attention to: (1) how test metrics can be misleading; (2) how diagnostic label may overcomplicate care; and (3) how using different methods of classifying diagnoses could improve management.
How test metrics can be misleadingInterpreting test metricsIn order to obtain a diagnosis for a patient (determine the presence or absence of a disorder), clinicians rely on diagnostic tests such as clinical examination or imaging. The main characteristic of a diagnostic study is the comparison of a test (or combination of tests) called the “index test” to a known “reference standard”. This produces the test metrics.6,7
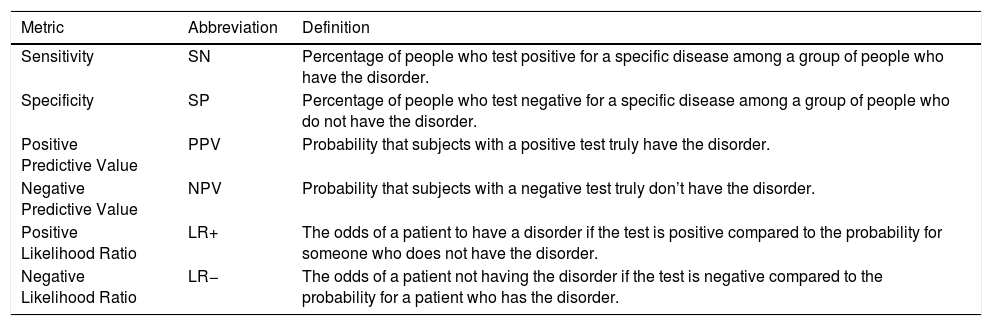
Table 1 provides the most commonly used test metrics in diagnostic assessment. Sensitivity (SN) and Specificity (SP) values are calculated only on defined population within a case-based, case control design. For example, SN is only calculated on patients who have the disease of interest. SP in only calculated on the population who does not have the disease of interest. Like SN and SP, Positive Predictive Value (PPV) and Negative Predictive Value (NPV) are only calculated from a proportion of the population within a case-based, case control design. PPV is calculated only from those who scored a “positive” on the test finding, whereas NPV is calculated only from those who score a “negative” on the test finding. SN, SP, PPV, and NPV are considered internal test metrics and should not to be used for post-test decision-making.
Common test metrics for differential diagnosis.
| Metric | Abbreviation | Definition |
|---|---|---|
| Sensitivity | SN | Percentage of people who test positive for a specific disease among a group of people who have the disorder. |
| Specificity | SP | Percentage of people who test negative for a specific disease among a group of people who do not have the disorder. |
| Positive Predictive Value | PPV | Probability that subjects with a positive test truly have the disorder. |
| Negative Predictive Value | NPV | Probability that subjects with a negative test truly don’t have the disorder. |
| Positive Likelihood Ratio | LR+ | The odds of a patient to have a disorder if the test is positive compared to the probability for someone who does not have the disorder. |
| Negative Likelihood Ratio | LR− | The odds of a patient not having the disorder if the test is negative compared to the probability for a patient who has the disorder. |
Likelihood ratios (LR) are calculated from the full population represented in the case-based, case control design thus are considered metrics that influence clinical utilities (the ability to make rational diagnostic decisions). A LR+ above 1.0 influences post-test probability with a positive finding, whereas a low LR− (a value close to 0) influences post-test probability with a negative finding.8 Both values are wedded to pretest probability and can be used to determine the post-test probability of a given diagnosis; whether ruling in or ruling out. Benchmark values have been provided to give clinicians perspective of individual meaningful levels. For example, LR+ >5 and LR− <0.2 is stated to moderately increase positive or negative post-test probability by approximately 30%.9 But in reality, each likelihood ratio is dependent on the pretest probability and should be considered individually to guide decision-making.
The current diagnostic system is based on interpreting these metrics for a given test to identify the most likely diagnostic label for a patient, but interpreting these metrics have many pitfalls. As previously stated, SN and SP and PPV and NPV are internal test metrics and are not used independently for decision-making. Indeed, individual values can be misleading because they do not represent the full population that one may experience in a clinic. The concepts of SPin and SNout are purported to rule in with high specificity and rule out with high sensitivity; however, this concept is outdated and can lead to interpretation errors.9 For example, a study on the diagnosis of subacromial pain demonstrated that combining three clinical features reached 100% SP, but only 9% SN.10 Even if a patient with three clinical features most likely have a diagnosis of subacromial pain, this cluster will only identify 9% of all patients with this diagnosis, making this “perfect scheme” rare in clinical practice. This may lead to biases if a clinician seeks to identify patients with this combination. For the concepts of SPin and SNout to work, the “other” metrics must be at a reasonable level to reduce the risk of errors in decision-making.
Likelihood ratios have proven useful since they inform on the magnitude of change in post-test probability, but this can also mislead decision-making processes. For example, the accuracy of the Lachman test for anterior cruciate ligament (ACL) tear was established in primary care and orthopedic cohorts.11,12 However, in primary care cohorts, the prevalence (pretest probability) of ACL tears is approximately 4%, while it is closer to 20–25% in orthopedic clinics since primary care cohorts include a diversity of knees (e.g. contusions and sprains) that (often) do not make their way to secondary care clinics.11 Even if this test demonstrates a high LR+,13 the post-test probability when applied to cohorts with different prevalence may be significantly different, which may impact uncertainty and decisions about further imaging or surgical references. Prevalence can influence the assessment of red flags as well. Authors have recently questioned the utility of history elements to rule out serious cause of low back pain (poor negative LR)14,15 because of the exceptionally low prevalence.
Study design and condition severity can influence outcomesInterpretation of test metrics is also highly dependable on the quality of the evidence about the test. For example, the Thessaly test for meniscal tears was initially developed in a study with a low-quality design and the results were not replicated afterward.6,16,17 Clinicians should look closely at study designs, reference standards and how the tests were described as these have most commonly influenced biases in diagnostic accuracy studies.18 Further, the severity of the population group may influence outcomes. Conditions that are advanced and have high degrees of disability and pain will exhibit test results that are more sensitive and less specific. Conditions with low disability and pain will exhibit lower sensitivity and higher specificity.
Impact on decision-making processesDecision-making models propose a balance between the analytical approach based on evidence (e.g., test metrics), and the intuitive approach that relies on the experience of the evaluator.19 Clinicians face the daily challenge of avoiding pitfalls when interpreting diagnostic test results. All tests, clinical examination or imaging, have strength and weaknesses. Flaws in interpreting the accuracy of a test, poor understanding of probabilities and low-quality evidence can derail the analytical process.20 The intuitive process can be overridden by verification or confirmation biases such as anchoring or premature closure in which a favored diagnosis is found and the clinician stop the diagnostic process too early when the scheme seems fitting.20
Ultimately, the results of diagnostic tests lead clinicians to initiate decisions about further tests and treatments. Therefore, clinical reasoning is of paramount importance to link the test results to an appropriate management plan in a complete care pathway. Higher order thinking demands that a clinician move beyond test metrics and reflect on misclassification costs and how the decision may influence downstream utilization of health care.
Take home message: Most test metrics are internal metrics and are not used to determine post-test probability. Metrics can be biased by study design and patient severity as well. Even those used for post-test probability such as likelihood ratios must be used in a full understanding of how pretest might influence the outcomes.
How a diagnostic label may overcomplicate careThe creation of diagnostic codes from a patho-anatomical viewpoint has led to focus on tissue based musculoskeletal disorders. Here we argue that identifying and classifying patients based on this model can lead to overcomplicated or asymptomatic diagnostic labeling that may not translate into better patient outcomes.
Overuse of diagnostic tests and overdiagnosis in musculoskeletal disordersMost fields in medicine have relied on diagnostic tests and metrics to inform clinical decision-making.21 However, it is now recognized that this overreliance on diagnostic labeling in medicine is a driver of overuse of diagnostic tests and overdiagnosis. Overdiagnosis occurs when a patient receives a diagnostic label that may have never caused them harm,22 such as when diagnostic tests identify abnormalities or risk factors that most often will not cause symptoms or impairments.23 Thus, the core of overdiagnosis is strongly related to the definition of diagnostic labeling and interpretation of test metrics.
When a patient presents with symptoms of pain to the spine, knee, hip or shoulder, clinicians often initiate a cascade of history questions, physical examination tests, clinical measures and imaging tests in order to diagnose the sources of the symptoms.24 Musculoskeletal care is plagued by overuse of diagnostic tests. Up to 50% of all imaging test referrals are considered inappropriate.25 Musculoskeletal disorders are particularly prone to overdiagnosis given the documented high prevalence of asymptomatic structural deficits seen on imaging. Examples of such labels include “lumbar degeneration”, “disk bulges”,26 “disk herniation”,27 “degenerative meniscal tears”,28 “degenerative labral tears”,29 “subacromial bursal thickening”30 or “rotator cuff tendinosis”.30
From a clinical pathway perspective, overuse of diagnostic tests and overdiagnosis can trigger downstream utilization of potentially inappropriate treatments such as orthopedic surgery, opioids overprescription, or early and intensive rehabilitation protocols as first-line options.24,31 Differentiating between specific patho-anatomic diagnoses may not be relevant to choose appropriate first-line options. We need to investigate whether diagnostic methods improve patients’ outcomes.
Trials linking diagnostic tests to patients’ outcomesThe evidence linking diagnostic tests to improve patient outcomes in musculoskeletal disorders is scarce. A meta-analysis explored the effect of routine diagnostic imaging on patient reported outcomes for patients with musculoskeletal disorders.32 The authors found 11 trials for low back pain and knee complaints that provided moderate evidence that using routine diagnostic imaging was not beneficial to improve pain.32 A trial showed that replacing spine radiographs by early magnetic resonance imaging (MRI) in primary care did not lead to improved back-related disabilities while increasing cost and possibly the number of spine surgery based on MRI findings.27 A trial found that patients who receive early MRI for low back pain are more likely to be out of work with disabilities one year later.24 Another trial found that adding MRI in primary care for younger patients with traumatic knee complaints did not improve knee-related function after one year.33
These studies show that adding imaging tests that are known to yield high rates of structural asymptomatic findings to the care pathway of musculoskeletal disorders do not translate into better patients’ outcomes. It can contribute to overdiagnosis and overuse of subsequent treatments such as surgery. Future research should investigate if the implementation of current and new diagnostic methods (e.g. ultrasound), classification and biomechanical systems (e.g. McKenzie,34 movement system35) or prediction algorithms (e.g. clinical prediction rules) improve the complete clinical pathway leading to improved patients’ outcomes without exposing them to the harms of overdiagnosis. Said otherwise, knowing the exact structure or movement patterns may not change the downstream decisions of high-quality first-line options that are required to improve outcomes.
Prognosis-rarely used but as equally importantPrognosis is a method of classification which is designed to determine the likelihood something happening in the future.36 Prognosis research asks whether a decision will influence the patient's future outcome. It has been argued that prognostic decision-making should be as much a focus as diagnostic research, since “no care” is as often a good choice as providing care for patients. Failure to incorporate prognostic research in clinical care may lead to harmful effects and overtreatment (see earlier discussion).
Much medical education is concerned with the principles of disease diagnosis and treatment. Indeed, a historical emphasis has been placed on informing the patient and public about new understandings about the causes and mechanisms of disease and how best to reach a diagnosis and prescribe effective treatments linked to the diagnosis. We argue that an equal emphasis on prognosis may reduce overdiagnosis and over-treatment of patients. For example, providing a “watchful waiting” approach to benign conditions that often improve with no formal management, we reduce the risk of providing harms, unnecessary care, and increasing catastrophizing in patients. By being able to predict trajectories, we would be able to develop personalized rehabilitation approaches more likely to improve outcomes. We could determine for which patient we can simply prescribe watchful waiting compared to those that requires intensive rehabilitation, which could redirect cost to improve coverage of rehabilitation.
An interesting finding of the previous trials was that physicians and patients mostly preferred the use of the advanced imaging techniques and were more satisfied with their care although patients’ outcomes were not improved.27,33 This situation poses a real challenge for clinicians. Conceptual models propose that receiving a diagnostic label may have physical, psychosocial and financial consequences as well as increasing treatment burden, exposure to unnecessary tests and treatments and adverse events that lead to dissatisfaction with care.31 Patients are mostly unaware of the possible harms associated with diagnostic labeling. As the natural history of common musculoskeletal disorder may be self-limiting, we need to study how a watchful waiting approach can be best integrated.
Take home message: When a fervent attempt is made to create a diagnosis, it may lead to overdiagnosis and subsequent overtreatment. A focus on prognosis for self-limiting conditions should improve overall findings and outcomes.
How using different methods of classifying diagnoses could improve managementWe showed that current diagnostic labels in musculoskeletal disorders may sometimes have a negative impact on patients’ outcomes. To establish the missing link between diagnosis and outcomes we must harness the complexity and heterogeneity that lie underneath common labels. Phenotyping may be a superior method of understanding musculoskeletal disorders.
Traditionally, the term phenotype has been used to reflect the observable properties of a particular organism that are produced from an interaction of the genotype and the environment.37 Science has modified phenotyping to include physical, biochemical, and genetic characteristics along with interactions with the environment that have produced observable, unique characteristics.37 Phenotyping that has looked at the interactions between genetic factors and psychological characteristics has been performed in patients with shoulder injuries to predict ongoing shoulder pain. George and colleagues have shown that two single nucleotide polymorphisms38 interacted with psychological factors to predict six shoulder impairment phenotypes, and that two pain-related genes interacted with psychological factors to predict four shoulder impairment phenotypes.
Others have phenotyped using only clinical findings. Based on longitudinal cohorts, the field of knee osteoarthritis (OA) as greatly expanded this knowledge in the last decade. Two groups used the Osteoarthritis Initiative study and the Amsterdam OA cohort, including 3494 and 551 participants with knee OA, to identify up to five phenotypes of knee OA.39,40 The phenotypes were based on radiological grades of knee OA, knee muscle strength, body mass index, comorbidities, psychological distress and alteration of pain neurophysiology. The phenotypes were named “minimal joint disease”, “strong muscle strength”, “severe radiographic”, “obese” and “depressive mood” for the same diagnostic label of knee OA.
Other authors have also identified four pain susceptibility phenotypes using 852 participants from the Multicenter Osteoarthritis Study, a cohort of participants with or at risk of knee OA.41 The phenotypes were based on clinical measures such as pressure pain threshold and temporal summation. The phenotype with high sensitization showed predictive capacity to develop persistent knee pain over 2 years.
Another group identified trajectories of knee pain and function following total knee arthroplasty over up to 5 years in a cohort of 689 patients.42 Subgroups of patients demonstrated a persistent pain or function deficit after surgery and these trajectories could be predicted by co-morbidities and psychological or physical reported measures.
In the field of low back pain, one group identified five pain trajectories over 12 weeks in 1585 patients consulting for low back pain (recovery at week 2 or 12, pain reduction without recovery, fluctuating pain and high-level pain for 12 weeks).43 Longer pain duration and belief in risk of persistence predicted delayed or nonrecovery of low back pain. High pain intensity and longer duration were associated with persistent high pain at 12 weeks.
Another group also identified up to nine subgroups using 112 characteristics based on history and physical examination of patients consulting for low back pain in primary care.44 While the authors concluded that predictive capacity of the subgroups for pain intensity, frequency and disability over 12 months was somewhat higher compared to previous subgrouping techniques, they were also more complex to use in clinical practice. The authors proposed that further research should aim to determine if these subgroups better response to targeted treatment approaches.
In a cohort of 682 participants with nontraumatic complaints of arm, neck and shoulder in primary care, one group identified three disability trajectories at 2-year using Disabilities of the Arm, Shoulder and Hand questionnaire (DASH).45 They identified several prognostic variables from the clinical examination, such as a high level of somatization that could predict if patients would follow the continuous high disability trajectory. In a cohort of 127 patients with patellofemoral pain, one group identified three subgroups classified as “strong”, “weak and tighter” and “weak and pronated foot” based on six common clinical measures such as flexibility, strength, patellar mobility and posture of the foot.46 The authors proposed that these subgroups could be used to develop targeted rehabilitation approaches that can further improve patients’ outcomes.
The aforementioned studies suggest that several phenotypes might be present in a “single” diagnosis. This suggests that patients within that diagnosis may have different outcomes with the same treatment. We argue too that the results of test findings may vary in a single diagnosis based on the phenotype of the patient.
Take home message: These examples demonstrate that phenotyping based on patients’ characteristics, reported outcome measures and clinical examination can help us better understand different profiles of patients and different trajectories of presentation for a given diagnostic label. As clinicians and researchers worldwide are continuing to develop large longitudinal cohorts for the study of musculoskeletal disorders, we will obtain more information to identify subgroups.
ConclusionHigher order thinking, a process of decision making that excels beyond memorization, facts and, concepts, is necessary for diagnostic clinicians. In this masterclass, we discuss how higher order thinking may reduce interpretation errors associated with standard diagnostic metrics, how it may reduce overdiagnosis, and how a single diagnosis may actually consist of multiple phenotypes. In the future, we need to study diagnosis beyond normal metrics and venture into linking phenotyping and prognosis evidence to improve targeted care in order to ultimately improve patients’ outcomes. We are at the beginning of our understanding of the different profile of patients with musculoskeletal disorders. Cohorts, database and data mining tools such as artificial intelligence will accelerate our understanding of the linkage between diagnosis and patients’ outcomes.
Conflicts of interestThe authors declare no conflicts of interest.


